Sciences in Cold and Arid Regions ›› 2020, Vol. 12 ›› Issue (6): 389-403.doi: 10.3724/SP.J.1226.2020.00389

Previous Articles     Next Articles

Simulation and projection of climate change using CMIP6 Muti-models in the Belt and Road Region

YanRan Lü1,Tong Jiang1(),YanJun Wang1,BuDa Su1,JinLong Huang1,Hui Tao2   

  1. 1.Institute for Disaster Risk Management/ School of Geographical Sciences, Nanjing University of Information Science & Technology, Nanjing, Jiangsu 210044, China
    2.State Key Laboratory of Desert and Oasis Ecology, Xinjiang Institute of Ecology and Geography, Chinese Academy of Sciences, Urumqi, Xinjiang 830011, China
  • Received:2020-10-01 Accepted:2020-12-15 Online:2020-12-31 Published:2021-01-14
  • Contact: Tong Jiang E-mail:jiangtong@nuist.edu.cn
  • Supported by:
    National Key Research and Development Program of ChinaMOST(2018FY100501);Postgraduate Research & Practice Innovation Program of Jiangsu Province(KYCX20_0957);High-level Talent Recruitment Program of the Nanjing University of Information Science and Technology (NUIST);Guest Professor Program of the Xinjiang Institute of Ecology and Geography, CAS

Abstract:

Climate condition over a region is mostly determined by the changes in precipitation, temperature and evaporation as the key climate variables. The countries belong to the Belt and Road region are subjected to face strong changes in future climate. In this paper, we used five global climate models from the latest Sixth Phase of Coupled Model Intercomparison Project (CMIP6) to evaluate future climate changes under seven combined scenarios of the Shared Socioeconomic Pathways and the Representative Concentration Pathways (SSP1-1.9, SSP1-2.6, SSP2-4.5, SSP3-7.0, SSP4-3.4, SSP4-6.0 and SSP5-8.5) across the Belt and Road region. This study focuses on undertaking a climate change assessment in terms of future changes in precipitation, air temperature and actual evaporation for the three distinct periods as near-term period (2021-2040), mid-term period (2041-2060) and long-term period (2081-2100). To discern spatial structure, K?ppen-Geiger Climate Classification method has been used in this study. In relative terms, the results indicate an evidence of increasing tendency in all the studied variables, where significant changes are anticipated mostly in the long-term period. In addition to, though it is projected to increase under all the SSP-RCP scenarios, greater increases will be happened under higher emission scenarios (SSP5-8.5 and SSP3-7.0). For temperature, robust increases in annual mean temperature is found to be 5.2 °C under SSP3-7.0, and highest 7.0 °C under SSP5-8.5 scenario relative to present day. The northern part especially Cold and Polar region will be even more warmer (+6.1 °C) in the long-term (2081-2100) period under SSP5-8.5. Similarly, at the end of the twenty-first century, annual mean precipitation is inclined to increase largely with a rate of 2.1% and 2.8% per decade under SSP3-7.0 and SSP5-8.5 respectively. Spatial distribution demonstrates that the largest precipitation increases are to be pronounced in the Polar and Arid regions. Precipitation is projected to increase with response to increasing warming most of the regions. Finally, the actual evaporation is projected to increase significantly with rate of 20.3% under SSP3-7.0 and greatest 27.0% for SSP5-8.5 by the end of the century. It is important to note that the changes in evaporation respond to global mean temperature rise consistently in terms of similar spatial pattern for all the scenarios where stronger increase found in the Cold and Polar regions. The increase in precipitation is overruled by enhanced evaporation over the region. However, this study reveals that the CMIP6 models can simulate temperature better than precipitation over the Belt and Road region. Findings of this study could be the reliable basis for initiating policies against further climate induced impacts in the regional scale.

Key words: precipitation, temperature, actual evaporation, multi-models CMIP6, SSPs-RCPs, Belt and Road Region

Figure 1

The Belt and Road region with K?ppen-Geiger Climate Classification"

Table 1

Basic information of the five global climate models (GCMs)"

Climate modelModelling groupOriginal horizontal resolution (longtitude×latitude)
CanESM5CCCma, Canada~2.8°×2.8°
IPSL-CM6A-LRIPSL, France2.5°×1.2676°
MIROC6AORI, NIES, JAMSTEC, Japan1.4063°×1.40°
MRI-ESM2-0MRI, Japan~1.125°×1.12°
CNRM-ESM2-1CNRM-CERFACS, France~1.4°×1.4063°

Figure 2

Comparison of multi-year averaged monthly (a) temperature (b) and precipitation in The Belt and Road region for the period of 1995-2014; unprocessed output ensemble mean (CMIP6), processed GCM ensemble mean (Correction) and CRU (observation)"

Figure 3

Spatial distributions of annual temperature and precipitation in The Belt and Road region for the period of 1995-2014; simulated and observed temperature (a-b); simulated and observed precipitation (c-d) respectively"

Figure 4

Temporal changes of annual mean temperature in the Belt and Road region during 1995-2100 period under the scenarios of SSP1-1.9, SSP1-2.6, SSP2-4.5, SSP3-7.0, SSP4-3.4, SSP4-6.0 and SSP5-8.5"

Figure 5

Spatial patterns of projected temperature changes (℃) during the near-term (2021-2040), mid-term (2041-2060) and long-term (2081-2100) period relative to the baseline period (1995-2014) in the Belt and Road region under SSP1-1.9, SSP1-2.6, SSP2-4.5, SSP3-7.0, SSP4-3.4, SSP4-6.0 and SSP5-8.5"

Table 2

Changes (℃) in temperature for the three defined periods under seven SSP-RCP relative to 1995-2014 period over the five regions of the Belt and Road regions"

TermRegionsSSP1-1.9SSP1-2.6SSP4-3.4SSP2-4.5SSP4-6.0SSP3-7.0SSP5-8.5
Near-termTropical0.70.70.70.80.80.80.8
(2021-2040)Arid1.31.21.31.31.51.31.6
Temperate1.11.01.01.11.01.01.3
Cold1.51.21.51.41.51.31.7
Polar1.91.92.12.12.22.12.6
Mid-termTropical0.81.01.21.31.31.41.3
(2041-2060)Arid1.41.61.92.12.22.32.9
Temperate1.21.51.61.71.81.82.4
Cold1.62.02.32.42.72.73.1
Polar2.22.73.03.23.53.64.3
Long-termTropical0.71.11.72.02.43.02.4
(2081-2100)Arid1.11.72.43.03.84.76.1
Temperate1.11.52.12.63.13.75.0
Cold1.22.13.03.84.65.67.5
Polar1.83.04.14.95.76.88.8

Figure 6

Temporal changes of annual precipitation in the Belt and Road region during 1995-2100 period under the scenarios of SSP1-1.9, SSP1-2.6, SSP2-4.5, SSP3-7.0, SSP4-3.4, SSP4-6.0 and SSP5-8.5"

Figure 7

Multi-model ensemble mean of annual mean precipitation responses (%/℃) to global-mean surface air temperature for the period of the near-term (2021-2040), mid-term (2041-2060) and long-term (2081-2100) relative to the reference period (1995-2014) under SSP1-1.9, SSP1-2.6, SSP2-4.5, SSP3-7.0, SSP4-3.4, SSP4-6.0 and SSP5-8.5"

Table 3

Changes (%/℃) in hydrological sensitivity for the three defined periods under seven SSP-RCP relative to 1995-2014 period over the five regions of the Belt and Road regions"

TermRegionsSSP1-1.9SSP1-2.6SSP4-3.4SSP2-4.5SSP4-6.0SSP3-7.0SSP5-8.5
Near-termTropical4.5-4.5-3.3-0.5-0.6-3.2-2.7
(2021-2040)Arid35.547.117.59.210.1-14.514.1
Temperate11.74.12.83.72.32.81.9
Cold11.012.16.37.05.43.03.8
Polar14.016.612.85.49.85.512.0
Mid-termTropical4.5-4.5-3.3-0.5-0.6-3.2-2.7
(2041-2060)Arid35.547.117.59.210.1-14.514.1
Temperate11.74.12.83.72.32.81.9
Cold11.012.16.37.05.43.03.8
Polar14.016.612.85.49.85.512.0
Long-termTropical-3.9-8.94.1-5.20.1-0.63.8
(2081-2100)Arid-4.932.526.321.658.537.624.5
Temperate0.2-2.69.04.39.43.03.7
Cold15.08.516.48.112.39.94.6
Polar2.08.713.810.015.114.715.9

Figure 8

Temporal changes of annual mean actual evaporation in the Belt and Road region during 1995-2100 under the scenarios of SSP1-1.9, SSP1-2.6, SSP2-4.5, SSP3-7.0, SSP4-3.4, SSP4-6.0 and SSP5-8.5"

Figure 9

Spatial patterns of actual evaporation for the period of near-term (2021-2040), mid-term (2041-2060) and long-term (2081-2100) under SSP1-1.9, SSP1-2.6, SSP2-4.5, SSP3-7.0, SSP4-3.4, SSP4-6.0 and SSP5-8.5 scenarios relative to the reference period (1995-2014) in the Belt and Road region"

Table 4

Changes (%) in actual evaporation for the three defined periods under seven SSP-RCP relative to 1995-2014 period over the five regions of the Belt and Road regions"

TermRegionsSSP1-1.9SSP1-2.6SSP4-3.4SSP2-4.5SSP4-6.0SSP3-7.0SSP5-8.5
Near-termTropical3.42.30.40.10.70.31.6
(2021-2040)Arid4.34.14.95.66.04.76.1
Temperate6.14.12.51.53.01.83.9
Cold7.67.26.15.56.56.17.9
Polar13.112.611.711.212.812.513.6
Mid-termTropical4.74.62.20.81.61.62.9
(2041-2060)Arid5.76.77.07.88.19.010.6
Temperate9.08.85.12.86.03.66.7
Cold9.811.011.09.911.010.913.1
Polar17.521.822.022.620.722.626.6
Long-termTropical4.84.94.73.80.66.58.7
(2081-2100)Arid3.16.112.417.510.514.022.8
Temperate4.19.69.87.69.010.613.5
Cold8.811.815.719.514.117.525.3
Polar14.823.931.839.028.734.851.3
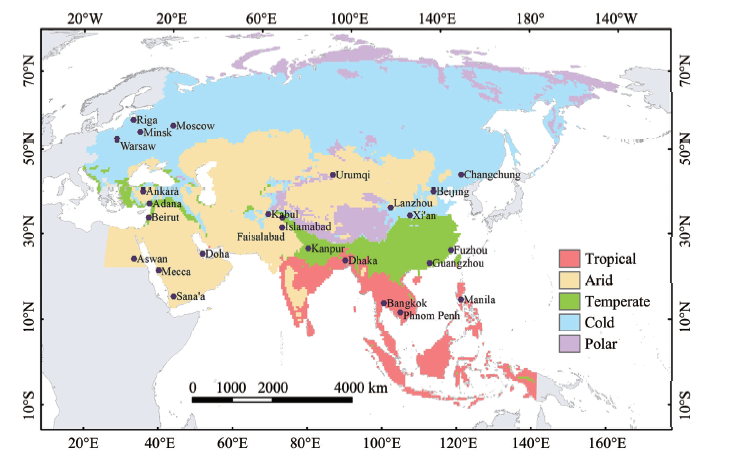
Beck HE, Zimmermann NE, Mcvicar TR, et al., 2018. Present and future Köppen-Geiger climate classification maps at 1-km resolution. Scientific Data, 5: 180214. DOI: 10.1038/sdata.2018.214.
doi: 10.1038/sdata.2018.214
Chen HP, Sun JQ, Lin WQ, et al., 2020. Comparison of CMIP6 and CMIP5 models in simulating climate extremes. Science Bulletin, 65(17): 1415-1418.
Cooke RU, Warren A, Goudie A, 1993. Desert Geomorphology. 2nd edition. London: UCL Press, pp. 10-20.
Coumou D, Rahmstorf S, 2012. A decade of weather extremes. Nature Climate Change, 2(7): 491-496. DOI: 10.1038/nclimate1452.
doi: 10.1038/nclimate1452
IPCC, 2013. Climate change 2013: The physical science basis. Contribution of Working Group I to the Fifth Assessment Report of IPCC the Intergovernmental Panel on Climate Change. United Kingdom and New York, NY, USA: Cambridge University Press.
IPCC, 2014. Climate Change 2014: impacts, adaptation, and vulnerability. Contribution of Working Group Ⅱ to the Fifth Assessment Report of the Intergovernmental Panel on Climate Change. Cambridge and New York, Cambridge University Press.
IPCC, 2018. Special Report1.5 (SR15) Summary for Policy Makers. Korea Incheon.
Jiang T, Tan K, Wang YJ, et al., 2020. Spatial-temporal variation of meteorological disasters in the "Belt and Road" regions. Science & Technology Review, 38(8): 57-65. DOI: 10.3981/j.issn.1000-7857.2020.08.007.
doi: 10.3981/j.issn.1000-7857.2020.08.007
Kriticos DJ, Webber BL, Leriche A, et al., 2012. CliMond: global high-resolution historical and future scenario climate surfaces for bioclimatic modelling. Methods in Ecology and Evolution, 3: 53-64. DOI: 10.1111/j.2041-210X. 2011.00134.x.
doi: 10.1111/j.2041-210X. 2011.00134.x
Li H, Sheffield J, Wood EF, 2010. Bias correction of monthly precipitation and temperature fields from Intergovernmental Panel on Climate Change AR4 models using equidistant quantile matching. Journal of Geophysical Research, 115: D10101.
Lü YR, Jiang T, Tao H, et al., 2020. Spatial-temporal patterns of population exposed to the extreme maximum temperature events in the Belt and Road regions. Science & Technology Review, 38(16): 68-79. DOI: 10.3981/j.issn.1000-7857.2020.
doi: 10.3981/j.issn.1000-7857.2020
O'Neill BC, Kriegler E, Ebi KL, et al., 2017. The roads ahead: narratives for shared socioeconomic pathways describing world futures in the 21st century. Global Environmental Change, 42: 169-80. DOI: 10.1016/j.gloenvcha.2015. 01.004.
doi: 10.1016/j.gloenvcha.2015. 01.004
O'Neill BC, Kriegler E, Riahi K, et al., 2014. A new scenario framework for climate change research: the concept of Shared Socioeconomic Pathways. Climatic Change, 122(3): 387-400. DOI: 10.1201/b20720-17.
doi: 10.1201/b20720-17
Peel MC, Finlayson BL, McMahon TA, 2007. Updated world map of the Köppen-Geiger climate classification. Hydrology and Earth System Sciences, 11: 1633-1644. DOI: 10. 5194/hess-11-1633-2007.
doi: 10. 5194/hess-11-1633-2007
Su BD, HuangJL, Fischer T, et al., 2018. Drought losses in China may triple between 1.5 °C and2.0 °C warming: policy hints of shared socio-economic pathways. PNAS, 115(42): 10600-10605. DOI: 10.1073/pnas.1802129115.
doi: 10.1073/pnas.1802129115
Wang B, Zhou TJ, Yu YQ, et al., 2018. A perspective on earth system model development. Acta Meteorologica Sinica, 66(6): 857-869.
Wang HJ, Tang GL, Chen HS, et al., 2020. The Belt and Road region climate change: facts, impacts and possible risks. Transactions of Atmospheric Sciences, 43(1): 1-9. DOI: 10. 13878/j.cnki.dqkxxb.20191110003.
doi: 10. 13878/j.cnki.dqkxxb.20191110003
Wood AW, Leung LR, Sridhar V, et al., 2004. Hydrologic implications of dynamical and statistical approaches to downscaling climate model outputs, Climatic Change, 62: 189-216.
World Meteorological Organization (WMO), 2019. The Global Climate in 2015-2019. Switzerland: WMO.
Wu SH, Liu LL, Liu YH, et al., 2018. Geographical patterns and environmental change risks in terrestrial areas of the Belt and Road. Acta Geographica Sinica, 73(7): 1214-1225. DOI: 10.11821/dlxb201807003.
doi: 10.11821/dlxb201807003
Zhang JY, Zhuang YH, Li K, 2019. Future Projections of Climate Change over Major Regions of Belt and Road. China Meteorological Press, Beijing, pp. 2-5.
Zho ZC, Luo Y, 2016. Design of CMIP6. Climate Change Research, 12(3): 258-260. DOI: 10.12006/j.issn.1673-1719. 2016.066.
doi: 10.12006/j.issn.1673-1719. 2016.066
Zhou BT, Xu Y, Han ZY, et al., 2020. CMIP5 projected changes in mean and extreme climate in the Belt and Road region. Transactions of Atmospheric Sciences, 43(1): 255-264. DOI: 10. 13878 /j.cnki.dqkxxb.20191125009.
doi: 10. 13878 /j.cnki.dqkxxb.20191125009
Zhou J, Jiang T, Wang YJ, et al., 2020. Spatiotemporal variations of aridity index over the Belt and Road region under the 1.5 °C and2.0 °C warming scenarios. Journal of Geographical Sciences, 30(1): 37-52.
[1] Tao Luo,JuanJuan Ma,Fang Liu,MingYi Zhang,ChaoWei Sun,YanJun Ji,XiaoSa Yuan. Direct incorporation of paraffin wax as phase change material into mass concrete for temperature control: mechanical and thermal properties [J]. Sciences in Cold and Arid Regions, 2021, 13(1): 30-42.
[2] Rong Liu,Xin Wang,ZuoLiang Wang,Jun Wen. Evaluating effects of Dielectric Models on the surface soil moisture retrieval in the Qinghai-Tibet Plateau [J]. Sciences in Cold and Arid Regions, 2021, 13(1): 62-76.
[3] ZhiGuo Rao,YiPing Tian,YunXia Li,HaiChun Guo,XinZhu Zhang,Guang Han,XinPing Zhang. Holocene precipitation δ18O as an indicator of temperature history in arid central Asia: an overview of recent advances [J]. Sciences in Cold and Arid Regions, 2020, 12(6): 371-379.
[4] YuFen Ma,RuQi Li,Men Zhang,MinZhong Wang,Mamtimin Ali. Validation of AIRS-Retrieved atmospheric temperature data over the Taklimakan Desert [J]. Sciences in Cold and Arid Regions, 2020, 12(4): 242-251.
[5] Jia Qin,JinKui Wu,TianDing Han,QiuDong Zhao. Quantitatively estimate the components of natural runoff and identify the impacting factors in asnow-fed river basin of China [J]. Sciences in Cold and Arid Regions, 2020, 12(3): 154-164.
[6] YaLing Chou,LiYuan Sun,BaoAn Li,XiaoLi Wang. Effects of freeze−thaw cycle and dry−wet alternation on slope stability [J]. Sciences in Cold and Arid Regions, 2019, 11(2): 159-172.
[7] YanLi Xie, QiHao Yu, YanHui You, ZhongQiu Zhang, TingTao Gou. The changing process and trend of ground temperature around tower foundations of Qinghai-Tibet Power Transmission line [J]. Sciences in Cold and Arid Regions, 2019, 11(1): 13-20.
[8] Mohan Bahadur Chand,Rijan Bhakta Kayastha. Study of thermal properties of supraglacial debris and degree-day factors on Lirung Glacier, Nepal [J]. Sciences in Cold and Arid Regions, 2018, 10(5): 357-368.
[9] AiHong Xie, ShiMeng Wang, YiCheng Wang, ChuanJin Li. Comparison of temperature extremes between Zhongshan Station and Great Wall Station in Antarctica [J]. Sciences in Cold and Arid Regions, 2018, 10(5): 369-378.
[10] YinHuan Ao, ShiHua Lyu, ZhaoGuo Li, LiJuan Wen, Lin Zhao. Numerical simulation of the climate effect of high-altitude lakes on the Tibetan Plateau [J]. Sciences in Cold and Arid Regions, 2018, 10(5): 379-391.
[11] Zhuo Ga, Za Dui, Duodian Luozhu, Jun Du. Comparison of precipitation products to observations in Tibet during the rainy season [J]. Sciences in Cold and Arid Regions, 2018, 10(5): 392-403.
[12] CaiXia Zhang, XunMing Wang, YongZhong Su, ZhiWen Han, ZhengCai Zhang, Ting Hua. Change in summer daily precipitation and its relation with air temperature in Northwest China during 1957–2016 [J]. Sciences in Cold and Arid Regions, 2018, 10(4): 317-325.
[13] MingJun Zhang, ShengJie Wang. Precipitation isotopes in the Tianshan Mountains as a key to water cycle in arid central Asia [J]. Sciences in Cold and Arid Regions, 2018, 10(1): 27-37.
[14] SiQiong Luo, BoLi Chen, ShiHua Lyu, XueWei Fang, JingYuan Wang, XianHong Meng, LunYu Shang, ShaoYing Wang, Di Ma. An improvement of soil temperature simulations on the Tibetan Plateau [J]. Sciences in Cold and Arid Regions, 2018, 10(1): 80-94.
[15] ZuHan Liu, JianHua Xu, WeiHong Li. Complex network analysis of climate change in the Tarim River Basin, Northwest China [J]. Sciences in Cold and Arid Regions, 2017, 9(5): 476-487.
Viewed
Full text


Abstract

Cited

  Shared   
  Discussed   
[1] Mohan Bahadur Chand,Rijan Bhakta Kayastha. Study of thermal properties of supraglacial debris and degree-day factors on Lirung Glacier, Nepal[J]. Sciences in Cold and Arid Regions, 2018, 10(5): 357 -368 .
[2] AiHong Xie, ShiMeng Wang, YiCheng Wang, ChuanJin Li. Comparison of temperature extremes between Zhongshan Station and Great Wall Station in Antarctica[J]. Sciences in Cold and Arid Regions, 2018, 10(5): 369 -378 .
[3] YanZai Wang, YongQiu Wu, MeiHui Pan, RuiJie Lu. Comparison of two classification methods to identify grain size fractions of aeolian sediment[J]. Sciences in Cold and Arid Regions, 2018, 10(5): 413 -420 .
[4] YinHuan Ao, ShiHua Lyu, ZhaoGuo Li, LiJuan Wen, Lin Zhao. Numerical simulation of the climate effect of high-altitude lakes on the Tibetan Plateau[J]. Sciences in Cold and Arid Regions, 2018, 10(5): 379 -391 .
[5] Zhuo Ga, Za Dui, Duodian Luozhu, Jun Du. Comparison of precipitation products to observations in Tibet during the rainy season[J]. Sciences in Cold and Arid Regions, 2018, 10(5): 392 -403 .
[6] Rong Yang, JunQia Kong, ZeYu Du, YongZhong Su. Altitude pattern of carbon stocks in desert grasslands of an arid land region[J]. Sciences in Cold and Arid Regions, 2018, 10(5): 404 -412 .
[7] Yang Qiu, ZhongKui Xie, XinPing Wang, YaJun Wang, YuBao Zhang, YuHui He, WenMei Li, WenCong Lv. Effect of slow-release iron fertilizer on iron-deficiency chlorosis, yield and quality of Lilium davidii var. unicolor in a two-year field experiment[J]. Sciences in Cold and Arid Regions, 2018, 10(5): 421 -427 .
[8] Ololade A. Oyedapo,Joseph M. Agbedahunsi,H. C Illoh,Akinwumi J. Akinloye. Comparative foliar anatomy of three Khaya species (Meliaceae) used in Nigeria as antisickling agent[J]. Sciences in Cold and Arid Regions, 2018, 10(4): 279 -285 .
[9] YuMing Wei, XiaoFei Ma, PengShan Zhao. Transcriptomic comparison to identify rapidly evolving genes in Braya humilis[J]. Sciences in Cold and Arid Regions, 2018, 10(5): 428 -435 .
[10] FangLei Zhong, AiJun Guo, XiaoJuan Yin, JinFeng Cui, Xiao Yang, YanQiong Zhang. Sociodemographic characteristics, cultural biases, and environmental attitudes: An empirical application of grid-group cultural theory in Northwestern China[J]. Sciences in Cold and Arid Regions, 2018, 10(5): 436 -446 .