Sciences in Cold and Arid Regions ›› 2019, Vol. 11 ›› Issue (1): 41-49.doi: 10.3724/SP.J.1226.2017.00041
Previous Articles Next Articles
PuYu Wang1,*( ),ZhongQin Li1,2,ChunHai Xu1,Ping Zhou1,WenBin Wang1,Shuang Jin1,HongLiang Li1
|
Bahr DB , Meier MF , Peckham SD , 1997. The physical basis of glacier volume-area scaling. Journal of Geophysical Research, 102(B9): 20355−20362. DOI: 10.1029/97JB01696.
doi: 10.1029/97JB01696. |
|
|
Bahr DB , Dyurgerov M , Meier MF , 2009. Sea-level rise from glaciers and ice caps: a lower bound. Geophysical Research Letters, 36(3): L03501. DOI: 10.1029/2008GL036309.
doi: 10.1029/2008GL036309. |
|
|
Bolch T , Kulkarni A , Kääb A , et al . , 2012. The state and fate of Himalayan glaciers. Science, 336(6079): 310−314. DOI: 10. 1126/science.1215828.
doi: 10. 1126/science.1215828. |
|
|
Farinotti D , Huss M , Bauder A , et al . , 2009. A method to estimate the ice volume and ice-thickness distribution of alpine glaciers. Journal of Glaciology, 55(191): 422−430. DOI: 10. 3189/002214309788816759.
doi: 10. 3189/002214309788816759. |
|
|
Farinotti D , Longuevergne L , Moholdt G , et al . , 2015. Substantial glacier mass loss in the Tien Shan over the past 50 years. Nature Geoscience, 8(9): 716−722. DOI: 10.1038/ngeo2513.
doi: 10.1038/ngeo2513. |
|
| Huang MH , Wang MH , Song GP , et al . , 1996. Hydraulic effects in the ablation area of the Hailuogou Glacier. Journal of Glaciology and Geocryology, 18(S1): 46−50. | |
| IPCC, 2013. Climate Change 2013. The physical science basis. Contribution of working group I to the fifth assessment report of the intergovernmental panel on climate change. Cambridge: Cambridge University Press. | |
|
Li HL , Ng F , Li ZQ , et al . , 2012. An extended "perfect-plasticity" method for estimating ice thickness along the flow line of mountain glaciers. Journal of Geophysical Research, 117(F1): F01020. DOI: 10.1029/2011JF002104.
doi: 10.1029/2011JF002104. |
|
|
Li J , Liu SY , Shangguan DH , et al . , 2010c. Identification of ice elevation change of the Shuiguan River No. 4 glacier in the Qilian Mountains, China. Journal of Mountain Science, 7(4): 375−379. DOI: 10.1007/s11629-010-1124-1.
doi: 10.1007/s11629-010-1124-1. |
|
|
Li ZQ , Wang FT , Zhu GC , et al . , 2007. Basic features of the Miaoergou Flat-Topped Glacier in East Tianshan Mountains and its thickness change over the past 24 years. Journal of Glaciology and Geocryology, 29(1): 61−65. DOI: 10.3969/j.issn.1000-0240.2007.01.010.
doi: 10.3969/j.issn.1000-0240.2007.01.010. |
|
|
Li ZQ, Li KM, Wang L, 2010a. Study on recent glacier changes and their impact on water resources in Xinjiang, North western China. Quaternary Sciences, 30(1): 96−106. DOI: 10.39 69/j.issn.1001-7410.2010.01.09.
doi: 10.39 69/j.issn.1001-7410.2010.01.09. |
|
|
Li ZX , He YQ , Pu T , et al . , 2010b. Changes of climate, glaciers and runoff in China's monsoonal temperate glacier region during the last several decades. Quaternary International, 218(1−2): 13−28. DOI: 10.1016/j.quaint.2009.05.010.
doi: 10.1016/j.quaint.2009.05.010. |
|
|
Liu SY , Sun WX , Shen YP , et al . , 2003. Glacier changes since the Little Ice Age maximum in the western Qilian Shan, Northwest China, and consequences of glacier runoff for water supply. Journal of Glaciology,49(164): 117−124. DOI: 10.3189/172756503781830926.
doi: 10.3189/172756503781830926. |
|
| Liu SY , Yao XJ , Guo WQ , et al . , 2015. The contemporary glaciers in China based on the Second Chinese Glacier Inventory. Acta Geographica Sinica, 70(1): 3−16. | |
| Liu YS , Qin X , Zhang T , et al . , 2012. Variation of the Ningchan river glacier No. 3 in the Lenglongling range, east Qilian Mountains. Journal of Glaciology and Geocryology, 34(5): 1031−1036. | |
| Luo Y , Li HL , Li ZQ , et al . , 2012. The relationship between the mass balances and meteorological factors at the glacier of No. 72, Qingbingtan, Shenqi Peak, Tuomuer Area. Journal of Arid Land Resources and Environment, 26(3): 62−67. | |
|
Ma LL , Tian LD , Pu JC , et al . , 2010. Recent area and ice volume change of Kangwure Glacier in the middle of Himalayas. Chinese Science Bulletin, 55(20): 2088−2096. DOI: 10.1007/s11434-010-3211-7.
doi: 10.1007/s11434-010-3211-7. |
|
| Paterson WSB, 1994. The Physics of Glaciers. 3rd Ed. Oxford: Butterworth/Heinemann. | |
|
Pieczonka T , Bolch T , WeiJ F , et al . , 2013. Heterogeneous mass loss of glaciers in the Aksu-Tarim Catchment (Central Tien Shan) revealed by 1976 KH-9 hexagon and 2009 SPOT-5 stereo imagery. Remote Sensing of Environment, 130: 233−244. DOI: 10.1016/j.rse.2012.11.020.
doi: 10.1016/j.rse.2012.11.020. |
|
|
Pieczonka T , Bolch T , 2015. Region-wide glacier mass budgets and area changes for the Central Tien Shan between ~1975 and 1999 using hexagon KH-9 imagery. Global and Planetary Change, 128: 1−13. DOI: 10.1016/j.gloplacha.2014.11.014.
doi: 10.1016/j.gloplacha.2014.11.014. |
|
|
Pratap B , Dobhal DP , Mehta M , et al . , 2015. Influence of debris cover and altitude on glacier surface melting: a case study on Dokriani Glacier, central Himalaya, India. Annals of Glaciology, 56(70): 9−16. DOI: 10.3189/2015AoG70A971.
doi: 10.3189/2015AoG70A971. |
|
|
Shangguan DH , Liu SY , Ding YJ , et al . , 2010. Changes in the elevation and extent of two glaciers along the Yanglonghe River, Qilian Shan, China. Journal of Glaciology, 56(196): 309−317. DOI: 10.3189/002214310791968566.
doi: 10.3189/002214310791968566. |
|
| Shi YF, 2008. Concise Glacier Inventory of China. Shanghai: Shanghai Science Press. | |
|
Tian LD , Zong JB , Yao TD , et al . , 2014. Direct measurement of glacier thinning on the southern Tibetan Plateau (Gurenhekou, Kangwure and Naimona'Nyi glaciers). Journal of Glaciology, 60(223): 879−888. DOI: 10.3189/2014JoG14J022.
doi: 10.3189/2014JoG14J022. |
|
|
Wang PY , Li ZQ , Zhou P , et al . , 2015. Recent changes of two selected glaciers in Hami Prefecture of eastern Xinjiang and their impact on water resources. Quaternary International, 358: 146−152. DOI: 10.1016/j.quaint.2014.05.028.
doi: 10.1016/j.quaint.2014.05.028. |
|
|
Wang PY , Li ZQ , Li HL , et al . , 2016a. Analyses of recent observations of Urumqi Glacier No. 1, Chinese Tianshan Mountains. Environmental Earth Sciences, 75(8): 720. DOI: 10.10 07/s12665-016-5551-3.
doi: 10.10 07/s12665-016-5551-3. |
|
|
Wang PY , Li ZQ , Li HL , et al . , 2016b. Recent evolution in extent, thickness, and velocity of Haxilegen Glacier No. 51, Kuytun River Basin, eastern Tianshan Mountains. Arctic, Antarctic, and Alpine Research, 48(2): 241−252. DOI: 10. 1657/AAAR0014-079.
doi: 10. 1657/AAAR0014-079. |
|
|
Wang PY , Li ZQ , Wang WB , et al . , 2016c. Comparison of changes in glacier area and thickness on the northern and southern slopes of Mt. Bogda, eastern Tianshan Mountains. Journal of Applied Geophysics, 132: 164−173. DOI: 10.10 16/j.jappgeo.2016.07.009.
doi: 10.10 16/j.jappgeo.2016.07.009. |
|
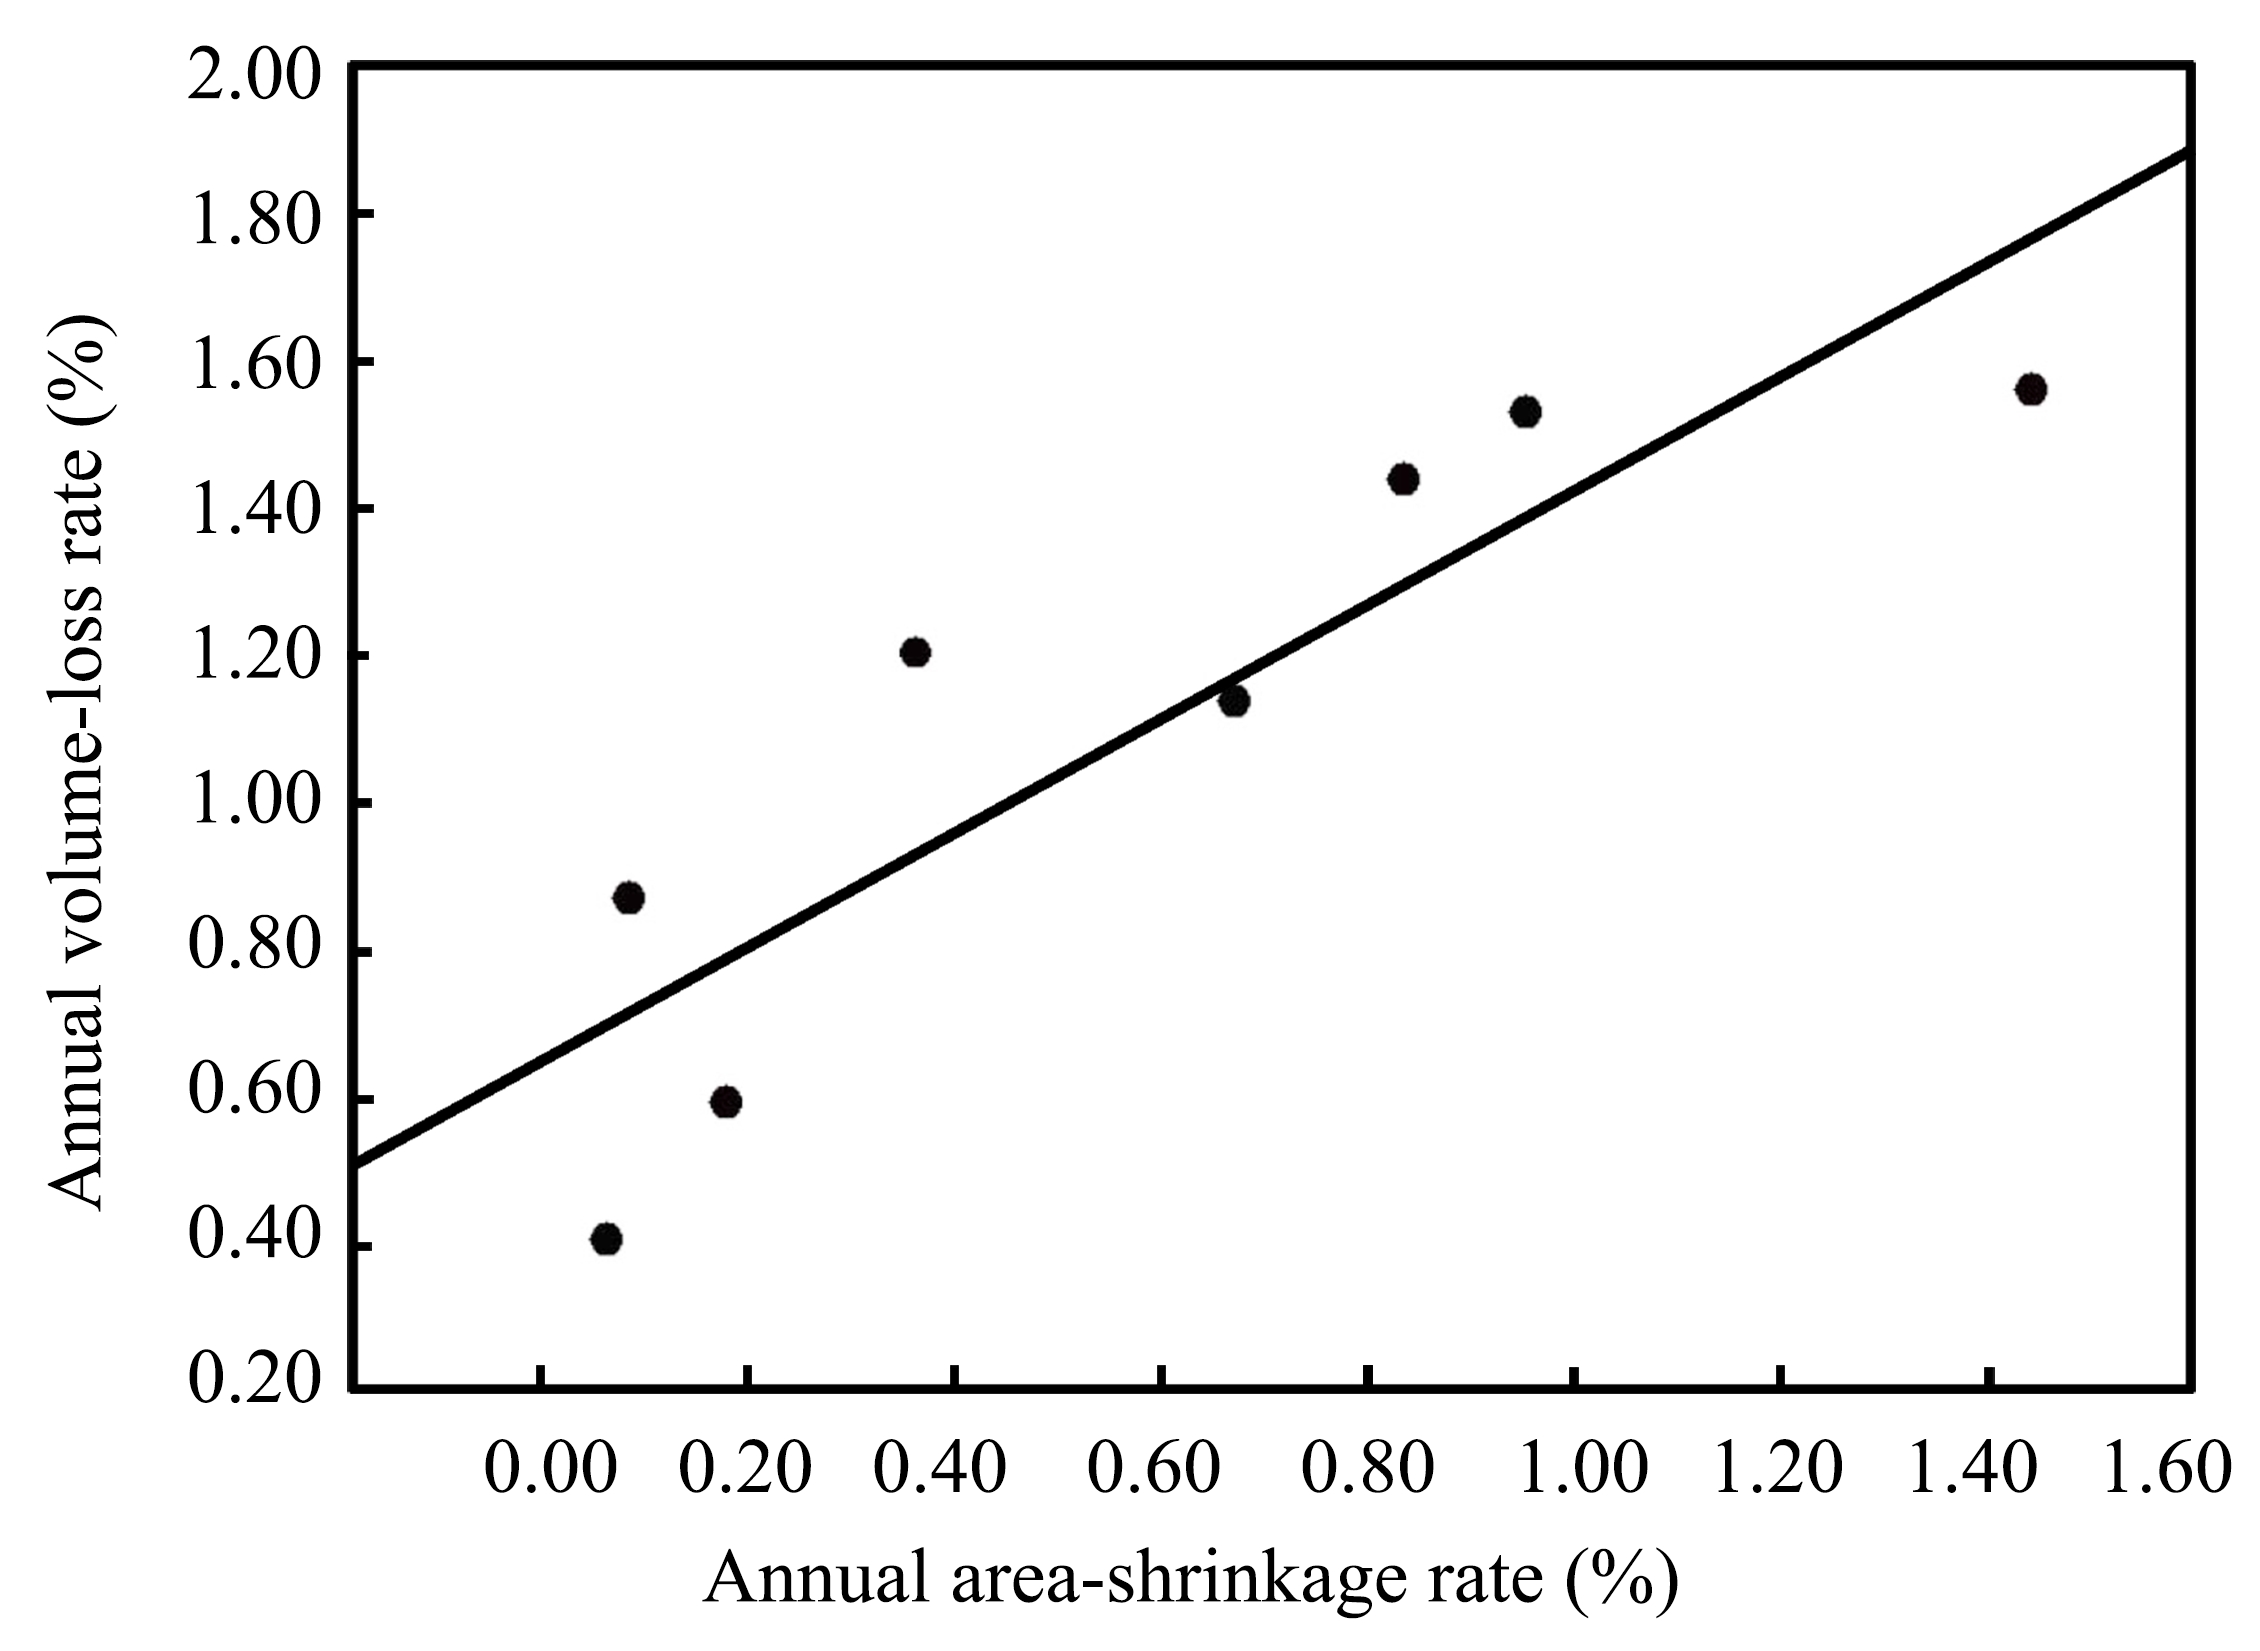
| Wang PY , Li ZQ , Li HL , et al . , 2017a. Analysis of the relation between glacier volume change and area change in the Tianshan Mountains. Journal of Glaciology and Geocryology, 39(1): 9−15. | |
|
Wang PY , Li ZQ , Li HL , et al . , 2017b. Characteristics of a partially debris-covered glacier and its response to atmospheric warming in Mt. Tomor, Tien Shan, China. Global and Planetary Change, 159: 11−24. DOI: 10.1016/j.gloplacha. 2017.10.006.
doi: 10.1016/j.gloplacha. 2017.10.006. |
|
| Wu GH , Zhang SY , Wang ZX , 1983. Retreat and advance of modern Glaciers in Bogda, Tian Shan. Journal of Glaciology and Geocryology, 5(3): 143−152. | |
| Wu LH , Li ZQ , Wang PY , et al . , 2011. Sounding the Sigong River Glacier No. 4 in Mt. Bogda area, the Tianshan Mountains by using ground penetrating radar and estimating the ice volume. Journal of Glaciology and Geocryology, 33(2): 276−282. | |
|
Xie CW , Ding YJ , Liu SY , et al . , 2006. Variation of Keqikaer Glacier terminus in Tomur Peak during last 30 years. Journal of Glaciology and Geocryology, 28(5): 672−677. DOI: 10. 3969/j.issn.1000-0240.2006.05.008.
doi: 10. 3969/j.issn.1000-0240.2006.05.008. |
|
| Yao TD , Shi YF , 1988. Variation of climate, glacier, runoff and future trend of Urumqi River. Science in China (Series B), 6: 657−666. | |
|
Yao TD , Thompson L , Yang W , et al . , 2012. Different glacier status with atmospheric circulations in Tibetan Plateau and surroundings. Nature Climate Change, 2(9): 663−667. DOI: 10.1038/nclimate1580.
doi: 10.1038/nclimate1580. |
|
|
Zhang Y , Liu SY , Ding YJ , et al . , 2006. Preliminary study of mass balance on the Keqicar Baxi Glacier on the south slopes of Tianshan Mountains. Journal of Glaciology and Geocryology, 28(4): 477−484. DOI: 10.3969/j.issn.1000-02 40.2006.04.003.
doi: 10.3969/j.issn.1000-02 40.2006.04.003. |
|
|
Zhang Y , Fujita K , Liu SY , et al . , 2010. Multi-decadal ice-velocity and elevation changes of a monsoonal maritime glacier: Hailuogou glacier, China. Journal of Glaciology, 56(195): 65−74. DOI: 10.3189/002214310791190884.
doi: 10.3189/002214310791190884. |
|
|
Zhang YS , Liu SY , Shangguan DH , et al . , 2012. Thinning and shrinkage of Laohugou No. 12 glacier in the Western Qilian Mountains, China, from 1957 to 2007. Journal of Mountain Science, 9(3): 343−350. DOI: 10.1007/s11629-009-2296-4.
doi: 10.1007/s11629-009-2296-4. |
|
|
Zhu DY , Tian LD , Wang JL , et al . , 2014a. Rapid glacier retreat in the Naimona'Nyi region, western Himalayas, between 2003 and 2013. Journal of Applied Remote Sensing, 8(1): 083508. DOI: 10.1117/1.JRS.8.083508.
doi: 10.1117/1.JRS.8.083508. |
|
| Zhu DY, 2015. Changes of ice thickness for typical glaciers in different areas of Tibetan Plateau. Chongqing: Southwest University. | |
| Zhu ML , Yao TD , Yang W , et al . , 2014b. Ice volume and characteristics of sub-glacial topography of the Zhadang Glacier, Nyainqêntanglha Range. Journal of Glaciology and Geocryology, 36(2): 268−277. |
| [1] | LiLi Yan,Jian Wang. Glacier mapping based on Chinese high-resolution remote sensing GF-1 satellite and topographic data [J]. Sciences in Cold and Arid Regions, 2019, 11(3): 218-225. |
| [2] | Eduard Severskiy. Permafrost response to climate change in the Northern Tien Shan [J]. Sciences in Cold and Arid Regions, 2017, 9(4): 398-403. |
| [3] | ShengJie Wang, WenYing He, HongBin Chen, JianChun Bian, ZhenHui Wang. Statistics of cloud heights over the Tibetan Plateau and its surrounding region derived from CloudSat data [J]. Sciences in Cold and Arid Regions, 2016, 8(1): 72-81. |
| [4] | ZheFan Jing, Kun Wang, Li Liu. Movement and variation of four typical glaciers in the Qilian Mountains, northwestern China [J]. Sciences in Cold and Arid Regions, 2015, 7(3): 206-211. |
|