

1 Introduction
The extent or area of species' geographical distributions, i.e., range size, is a central metric in macroecology (Blackburn and Gaston, 1996). A wide range of species attributes and environmental variables have been considered to correlate with range size, e.g., population density (Borregaard and Rahbek, 2010), species dispersal ability (Ceolin and Giehl, 2017), species body size (Inostroza-Michael et al., 2018), climate (Gallagher, 2016), topography (Li et al., 2016), edaphic characteristics (Geng et al., 2012), and evolutionary history (Leão et al., 2020). Many large-scale range size studies have focused on mammals or birds while studies on plants are scarce, often due to limited data availability. A notable exception is Morueta-Holme et al. (2013), a study that analyzed 85,000 New World plant species and found that the plant range size was mainly determined by habitat area and climate stability. Aridity and temperature were the primary drivers of range size variation in the Australian flora (Gallagher, 2016). Strong climate seasonality and high climate-change velocity were important factors for Chinese vascular plant range sizes (Xu et al., 2018).
Body size and range size are also intimately related. Range size was found to be positively correlated with body size in mammals and birds (Lindstedt et al., 1986; Tomiya, 2013; Tucker et al., 2014; Inostroza-Michael et al., 2018) and in plants (McGlone et al., 2010), while non-significant or negative correlations were also found (Dombroskie and Aarssen, 2010; Outomuro and Johansson, 2019).
Body size is generally well-recorded based on consistent metrics for animals in regionally published books or worldwide databases. In contrast, measuring the body size of plant species is not as straightforward and may include different metrics, e.g., stem height, biomass, and seed size. Height seems the most frequently used indicator of plant body size (Dombroskie and Aarssen, 2010). The study by Yu et al. (2018) focusing on patterns of maximum height among endemic woody species in China is an example of the use of plant height as a macroecological indicator. With the development of LiDAR technology, large-scale forest canopy height data are more easily obtained, creating opportunities for research on global patterns of canopy height (Tao et al., 2016; Zhang et al., 2016). However, these studies included data only on trees while neglecting shrub and herb species, which are the majority growth forms in many non-forest ecosystems. For example, in Xinjiang, herbs can make up 87% of all plant species present (Li et al., 2011). Thus, it is important to include herbs in the analysis for a more comprehensive understanding of plant height patterns across ecosystems. Data from regional flora are reliable data sources for plant height and easily available, and were recorded under the same criterion, so we used this data in our analysis.
To date, most reported research has been conducted within a single group of organisms. Potential differences in range size patterns between plants and animals from the same region have not been tested and productivity has often not been considered a predictor of species range size. With a detailed species distribution database for flora and fauna of Xinjiang, China, we aim to (i) analyze the relationship of range size with body size and environmental variables for plants, mammals, and birds; and (ii) compare the correlation, effect sizes and relative importance of each predictor among the three groups of organisms.
2 Materials and methods
2.1 Study area
Xinjiang, a hyper-arid area, is located in central Asia, with a mountain-basin topography. It covers 1.64 million km2 with diverse environments which is an ideal region for testing the relationship between range size, body size and environmental variables. Xinjiang is home to about 3,600 native vascular plant species belonging to 740 genera and 120 families; 154 mammal species representing 23 families and 7 orders; and 425 bird species representing 56 families and 21 orders (Li et al., 2013). Species richness, including plants, mammals, and birds is relatively high in mountains and low in basins due to the generally greater availability of water in the mountains (Li et al., 2013).
2.2 Species data
Plant height (average, minimum and maximum), as a proxy for plant body size, was collected mainly from local floras such as Florae Xinjiangensis (Commissione Redactorum Florae Xinjiangensis, 1992-2011). These data are originally mostly based on field surveys, a reliable systematic data source. Data from online databases, e.g., Flora of China (
Mean weight of mammals and birds, indicating animal body size, were based on Wilman et al. (2014), local checklists (Ma, 2001; Apdukader, 2002), and A Guide to the Mammals of China (Smith et al., 2010). Distributions of the three groups were obtained from published databases (Li et al., 2011; Li et al., 2013) which are primarily based on county level records. We divided the Xinjiang region into 0.1°×0.1° grid cells and mapped the species in the cells. Based on this, we used the number of the grid cells in which the species occur as a proxy of range area (RA), and the number of grid cells between the easternmost and westernmost cells as east-west extent (extent EW), and between the southernmost and northernmost cells as north-south extent (extent NS). We assume the range area is around 10,000 km2, i.e., 100×(10km×10km), when a species appears in 100 grid cells. These three variables range area, extent EW and extent NS together were regarded as range size; for detailed descriptions see Li et al. (2017b). As the patterns obtained for the three variables are similar, we show mainly the results for range area.
Finally, 3,100 species of plants, 142 species of mammals and 409 species of birds were included in this study and species without detailed distribution or plant height or animal body mass information were omitted.
2.3 Environmental data
Topographical data with a resolution of 0.0083 arc degree (equivalent to 1 km at the equator) were obtained from the United States Geological Survey (USGS). The altitudinal ranges were calculated at 0.1° resolution (about 10 km) with the difference between the max and min altitude in one grid cell. The climate data were obtained from the WorldClim Database (Hijmans et al., 2005), including temperature seasonality (Standard deviation ×100) and precipitation seasonality (coefficient of variation) (
2.4 Data analysis
To examine the relationship between range size and environmental variables, firstly, ordinary least square (OLS) regressions were conducted to detect the best single variable for explaining range size patterns. We then divided the independent variables into temperature (MAT, temperature seasonality), water (MAP, precipitation seasonality), body size (height of plants, weight/body mass of animals), topography (altitudinal range), and vegetation productivity (mean annual EVI), and the dependent variables range area, extent NS and extent EW. After the normality test, we log2-transformed plant range area, mammal range area, plant height, mammal body mass and bird body mass, and left other variables as the raw data. We then conducted variance partitioning analysis with Redundancy Analysis (RDA) to further split the effects of different types of variables. Then, we built multiple OLS regression models to find the variables' partial explained variance. Then, random forest analysis was conducted to distinguish the relative importance of the variables for influencing the species range size (Li, 2013; Lyu et al., 2020).
3 Results
3.1 Plant range size and height patterns
Our analyses included 118 species of trees, 342 species of shrubs and 2,643 species of herbs. The mean range area was 1,429 grid cells when considering all plant species (median = 392), 2,966 cells for trees (median = 810 cells), 1,645 cells for shrubs (median = 482), and 1,366 for herbs (median = 378). Among the species with the narrowest ranges were, for example, Orchis militaris, Delphinium kaschgaricum, and Eutrema salsugineum, while examples of wide-ranged species included Populus nigra, Plantago depressa, and Persicaria orientalis. The mean height of plant species was 0.64 m overall (median = 0.36 m), 10.4 m for trees, 1.1 m for shrubs, and 0.42 m for herbs (with medians 6.4, 0.72, 0.32 m, respectively). For example, Microula tibetica and Gentianella pygmaea were among the smallest herbs, while Picea schrenkiana and Populus nigra were among the tallest trees.
The distribution of range area and height of plants, including trees, shrubs and herbs were right-skewed distributions, which meant that most species had small range size, i.e., restricted distributions (Figure S1), and low height (Figure S2).
We found slight positive correlations between plant range area and height both for plants as a whole and for herbs, while this correlation was non-significant for shrubs and trees (Figure 1).
Figure 1
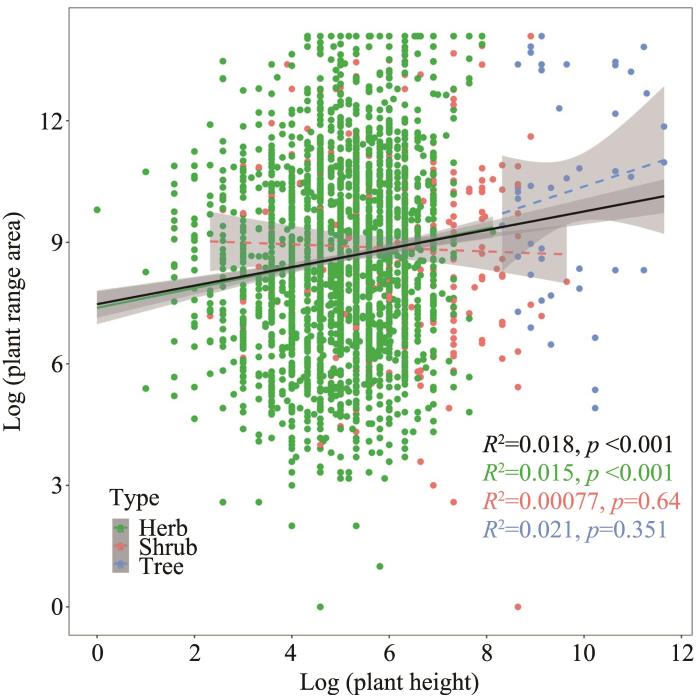
Figure 1
The correlation of plant range area and height (herb, shrub and tree in green, red and blue color, respectively). The black line is the correlation line for whole plant species
Plant range area showed positive relationships with MAT (R2=0.05, p <0.001), temperature seasonality (R2=0.02, p <0.001) and precipitation seasonality (R2=0.07, p <0.001), and negative relationships with altitudinal range (R2=0.09, p <0.001), MAP (R2=0.16, p <0.001) and annual mean EVI (R2=0.17, p <0.001; Figure 2).
Figure 2
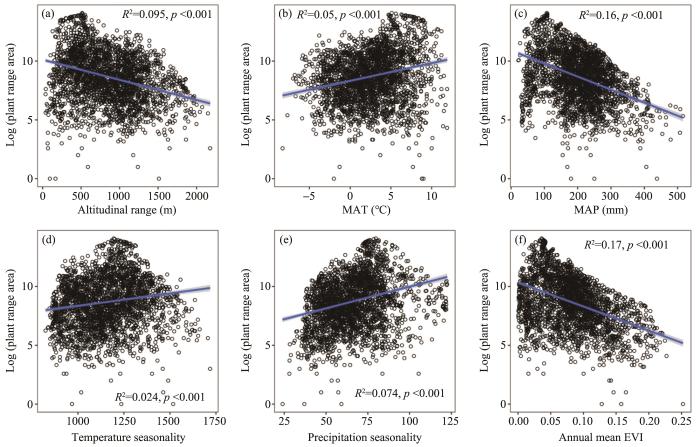
Figure 2
The correlation of plant range size and environmental variables
3.2 Range size and body size characters of mammals and birds
The mean weight of both mammal and bird species was right-skewed, with most species having low weight. The range area within the Xinjiang region was more right-skewed for mammals than birds (Figure S3).
For mammals, the mean range area within the Xinjiang region was 3,653 cells (median = 2,248 cells). The mammal species with the narrowest range was Alces alces (moose), while the species with the broadest range was Mus musculus (house mouse). The mean weight was 24,405 g (median = 143 g). Sorex minutus (shrew) was the lightest mammal species in our dataset for Xinjiang, while Camelus bactrianus (camel) and Bos grunniens (yak) were among the heaviest mammals.
For birds, the mean range area within the Xinjiang region was 7,181 cells (median = 6,869 cells). Examples among the narrowest ranged species were Anas angustirostris and Gavia arctica. Among the bird species with the broadest range were Upupa epops (common hoopoe)
Figure 3
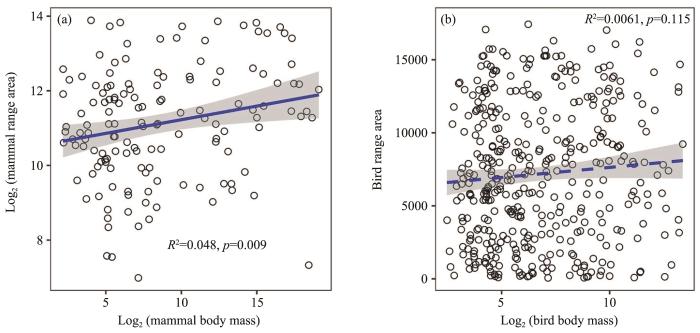
Figure 3
The correlation of body mass and range size of mammals (a) and birds (b)(insignificant for birds with dashed line in (b))
3.3 Comparison of environmental correlates of range size in plants and animals
Similarly to plants (Figure 2), the range area of mammals and birds was positively correlated with MAT (R2 = 0.16-0.17, p <0.001), temperature seasonality (R2 = 0.01, p <0.05 for birds and non-significant for mammals), and precipitation seasonality (R2 =0.07-0.06, p <0.01), and negatively correlated with altitudinal range (R2 =0.11, p <0.001), MAP (R2=0.19-0.15, p <0.001) and mean annual EVI (R2=0.14-0.13, p <0.001; Figures 4, 5).
Figure 4
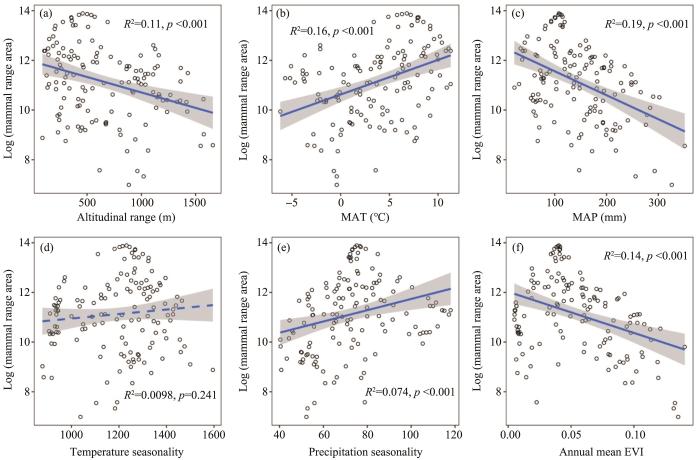
Figure 4
The correlation of mammal range size and environmental variables (insignificant for temperature seasonality with dashed line in (d))
Figure 5
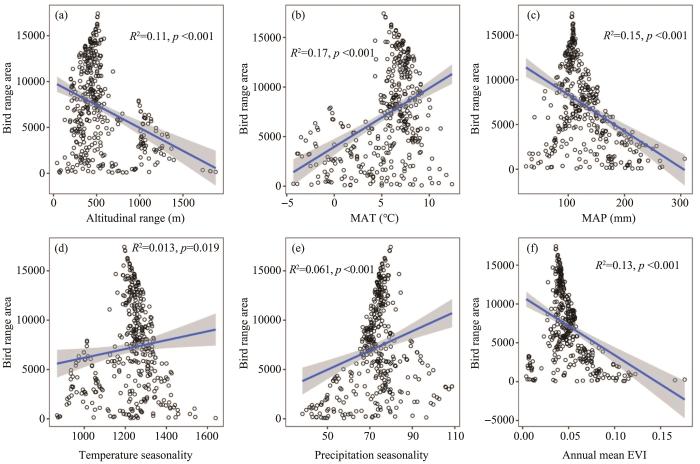
Figure 5
The correlation of bird range size and environmental variables
When including temperature, water, body size, topography, and vegetation productivity as independent variables, and range area, extent NS and extent EW as dependent variables in a redundancy analysis (RDA), the range size of plants and animals was negatively correlated with EVI, MAP and altitudinal range, while positively correlated with MAT, precipitation seasonality, height/weight and temperature seasonality (Figure 6).
Figure 6
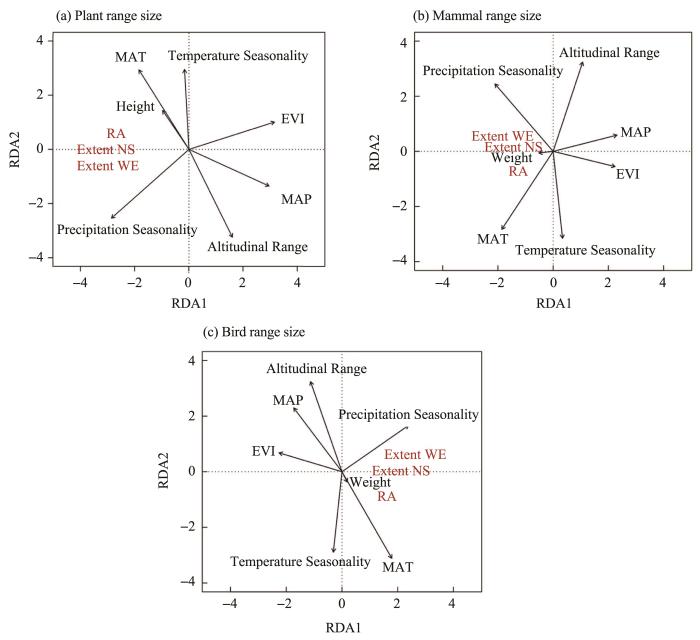
Figure 6
The RDA analysis of range size and environmental variables, body size
To further compare the effects of water and temperature variables, we performed multiple regression models. The range area of plants was better explained by water variables (i.e., MAP, precipitation seasonality), even when controlled for the effects of temperature variables; while the range area of mammals and birds was better explained by temperature variables if we put the climate variables in the model first (Table 1); However, the variance explained by these predictors substantially overlaps with the variance explained by the productivity variable (EVI), which was the variable most consistently associated with range area across groups of organisms (Table 1).
Table 1 The percentage of the variation in plant or animal range size explained by temperature, water, body size, topography, and vegetation productivity according to multiple regressions and their ANOVA decompositions
| Variables | Plant: log2(RA) | Mammal: log2(RA) | Bird: RA |
|---|---|---|---|
| Temperature+water+body mass+topo+productivity | |||
| MAT | 4.53*** | 16.38*** | 17.41*** |
| Temperature seasonality | 0.01 | 11.95*** | 6.77*** |
| MAP | 11.62*** | 3.62** | 0.82* |
| Precipitation seasonality | 8.66*** | 5.63*** | 5.49*** |
| log2(height), log2(weight) | 1.71*** | 3.94** | 0.54 . |
| Altitudinal range | 5.36*** | 0.03 | 0.07 |
| EVI | 3.10*** | 0.16 | 2.07*** |
| Residuals | 65.01 | 58.29 | 66.83 |
| Productivity+temperature+water+body mass+topo | |||
| EVI | 17.35*** | 14.01*** | 13.34*** |
| MAT | 3.65*** | 13.65*** | 12.79*** |
| Temperature seasonality | 0.32*** | 4.44** | 1.28** |
| MAP | 0.00 | 0.05 | 2.13*** |
| Precipitation seasonality | 6.18*** | 5.48*** | 2.48*** |
| log2(height), log2(weight) | 2.37*** | 4.03** | 0.79* |
| Altitudinal range | 5.12*** | 0.05 | 0.36 |
| Residuals | 65.01 | 58.29 | 66.83 |
To verify the consistency of the results across analytical methods, we also conducted a random forest analysis. We calculated the relative importance of each variable as a predictor of range area. We found that EVI was the best predictor of species range area for plants, mammals and birds. The results also pointed to a temperature variable (i.e., MAT) as an important predictor of the mammal and bird species range size (Table 2).
Table 2 Relative importance of the variables (values are relative to the largest, set to 1.00) to predict the species range area, according to the increase in node purity with a random forest analysis. Values ≥0.6 are in bold
| Variables | Plant: log2(RA) | Mammal: log2(RA) | Bird: RA |
|---|---|---|---|
| MAT | 0.53 | 0.60 | 0.62 |
| Temperature seasonality | 0.58 | 0.45 | 0.45 |
| MAP | 0.68 | 0.76 | 0.56 |
| Precipitation seasonality | 0.80 | 0.62 | 0.77 |
| log2(height), log2(weight) | 0.15 | 0.10 | 0.32 |
| Altitudinal range | 0.77 | 0.51 | 0.45 |
| EVI | 1.00 | 1.00 | 1.00 |
Considering the results across analytical methods, we found that range size patterns of plants and animals are generally concordant, i.e., showing similar correlations with the broad groups of environmental variables. However, the relative importance of each variable varies among groups of organisms, with water variables being more important for plants, and temperature variables more important for animals. In addition, we found that productivity is a good predictor of species range size for plants and animals in the Xinjiang region.
4 Discussions
4.1 The body size and range size relationship
Our results suggest that species geographic range size within the Xinjiang region is correlated with body size, productivity, topography and climate. However, the range size and body size relationship was weak when compared to the range size and environment relationship. There was a positive relationship between plant range size and height (mainly driven by herbs), and mammal range size and body mass, while the relationship was not statistically significant for birds. The positive body size and range size relationship is consistent with findings in the literature (Gaston and Blackburn, 1996; Inostroza-Michael et al., 2018). For example, taller plants were found to have larger range sizes in German forests (Kolb et al., 2006). The weak relationship of our study, especially birds, might be associated with the geographic coverage data being limited to the Xinjiang region, while species distributions often go beyond this region. Artificial truncation of the species range can reduce the strength of the relationship between range size and body size (Gaston and Blackburn, 1996). In contrast, the body size of North-American dragonflies (Libellulidae) did not predict range size, while wing shape and migratory status were more important predictors (Outomuro and Johansson, 2019).
The positive range-height relationship for plants might be associated with a competitive advantage of taller plants in the region and perhaps a higher dispersal capacity. In arid/semi-arid floras in Australia, plant species adapted for dispersal by vertebrates were found to have larger range size, on average (Oakwood et al., 1993). The positive range-height pattern was previously found in Xinjiang based on plots encompassing a much smaller number of species than in the present study (Li et al., 2017c). Here, using a larger dataset of species from the entire Xinjiang region, we confirmed the positive range-height pattern on a larger geographic and taxonomic scale.
Some small mammals with extensive ranges in the region (e.g., Mus musculus) may have affected the relationship between range size and body size in mammals, leading to a weaker relationship. For birds, perhaps the large extent of homogeneous habitats, e.g., desert, may have been associated with greater ranges. Together with the range truncation, these might explain the lack of correlation between body size and range size among birds.
4.2 The environmental correlates of range size
In our analysis, we divided environmental variables into four categories: water, temperature, topography and productivity. We then selected some of the most frequently used environmental variables in the diversity/range size research in each category and conducted the statistical analyses. We found a pattern across groups of organisms (i.e., including both plants and animals) of positive relationships between range size and MAT, temperature seasonality, precipitation seasonality, and negative relationships between range size and MAP, altitudinal range and EVI.
On a global scale, large-ranged terrestrial vertebrates seem associated with lower precipitation seasonality and lower topographic heterogeneity in their ranges (Li et al., 2016). Our results for mammals and birds also showed a negative relationship between range size and altitudinal ranges, but a positive relationship for both temperature seasonality and precipitation seasonality. In the Xinjiang region, large-ranged species occurred preferentially in homogenous environments, i.e., in deserts, where the topographic variance is relatively small, and the climate seasonality is large. In contrast, species with small range sizes were concentrated in the mountains, thus associated with higher altitudinal ranges and lower climate seasonality.
From the results of the regression models, random forests and redundancy analyses, we found that temperature variables were better at predicting the range size of animals than of plants compared with water variables. This finding needs more verification in future research comparing range size patterns between plants and animals. Furthermore, we found that productivity strongly predicts both range sizes of both plants and animals. Productivity variables were not widely used in earlier range size research. But remote sensing data is becoming increasingly available and precise, including some new types of satellite data, e.g., sun-induced fluorescence data, and offers great potential as a comprehensive indicator of environment, and a good surrogate for climatic variables.
4.3 Implications for regional biodiversity conservation
Our range size and body size results have implications for regional biodiversity conservation and prioritization because range size is generally the strongest predictor of extinction risk in plants (Nic Lughadha et al., 2018) and animals (Böhm et al., 2016) and simulations indicate that the probability of ecosystem collapse increases rapidly as range size declines (Murray et al., 2017). Furthermore, the power of combining consideration of range size and body size for extinction risk prediction has been demonstrated in recent animal studies focused on single groups, from beetles (Nolte et al., 2019) to vertebrates (Newsome et al., 2020). Extending these approaches to the flora and fauna of whole regions offers the potential to address some of the recognized limitations of the hotspot approaches widely used for conservation prioritization and planning globally (Myers et al., 2000) or locally (Li et al., 2017a). Specifically, we contend that including a greater range of strong predictors, such as the combination of range size and body size, could counteract the recently reported (Shrestha et al., 2019) under-representation of range-restricted species resulting from hotspot approaches to prioritization.
Our research presents the first report of range size and body size patterns of plants and animals in the Xinjiang region. The congruence patterns we report indicate an exciting opportunity to plan future biodiversity conservation in an integrated manner for plants and animals. We suggest that more exploration is needed of range size and body size patterns across major groups of organisms on regional scales, as well as on their relationship to extinction risk, to test and quantify their utility for conservation planning.
5 Conclusions
Based on a reliable plant and vertebrate species database of Xinjiang, China, relationships of environment and body size with the geographic range size of plants, mammals, and birds were thoroughly explored. On a species level, we concluded that: (1) there were generally positive correlations between species range size and body size in both plants and vertebrates; (2) water variables were more important for plant species range size, while that of vertebrate range size was largely influenced by temperature variables; (3) remote sensing indicators could be good predictors of species range size for both plants and vertebrates.
Figure S1
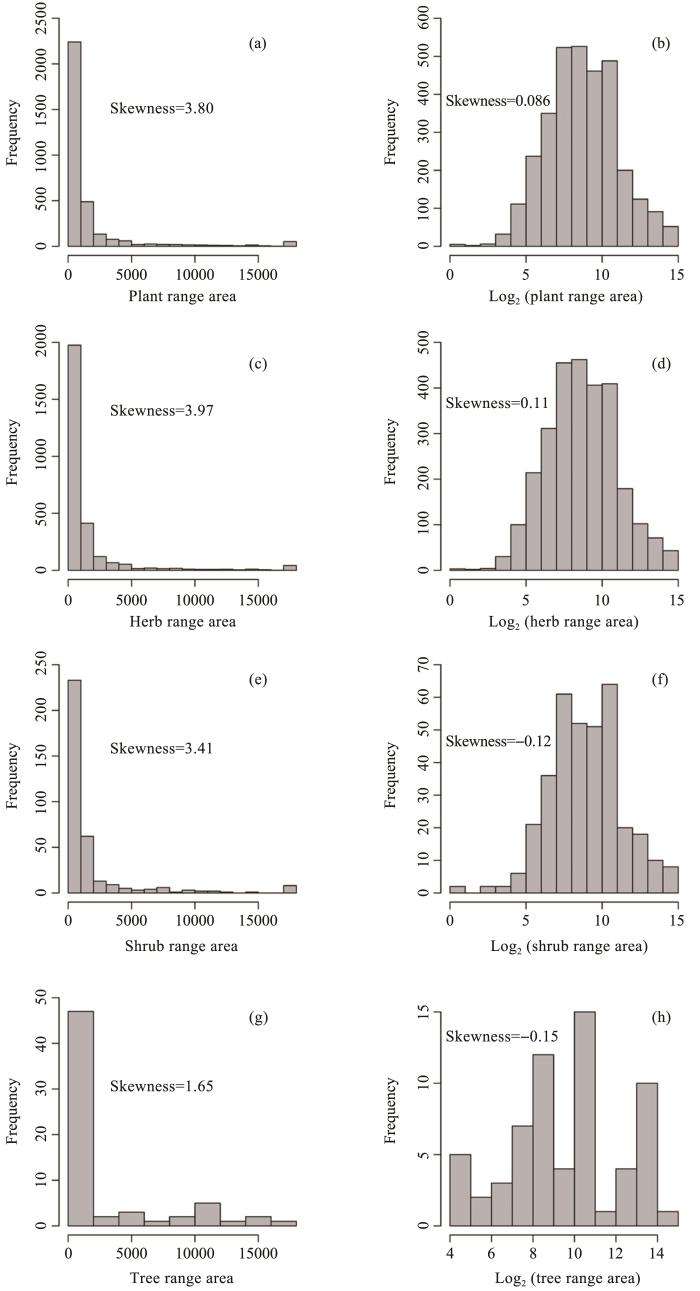
Figure S1
Frequency distributions of plant range area
Figure S2
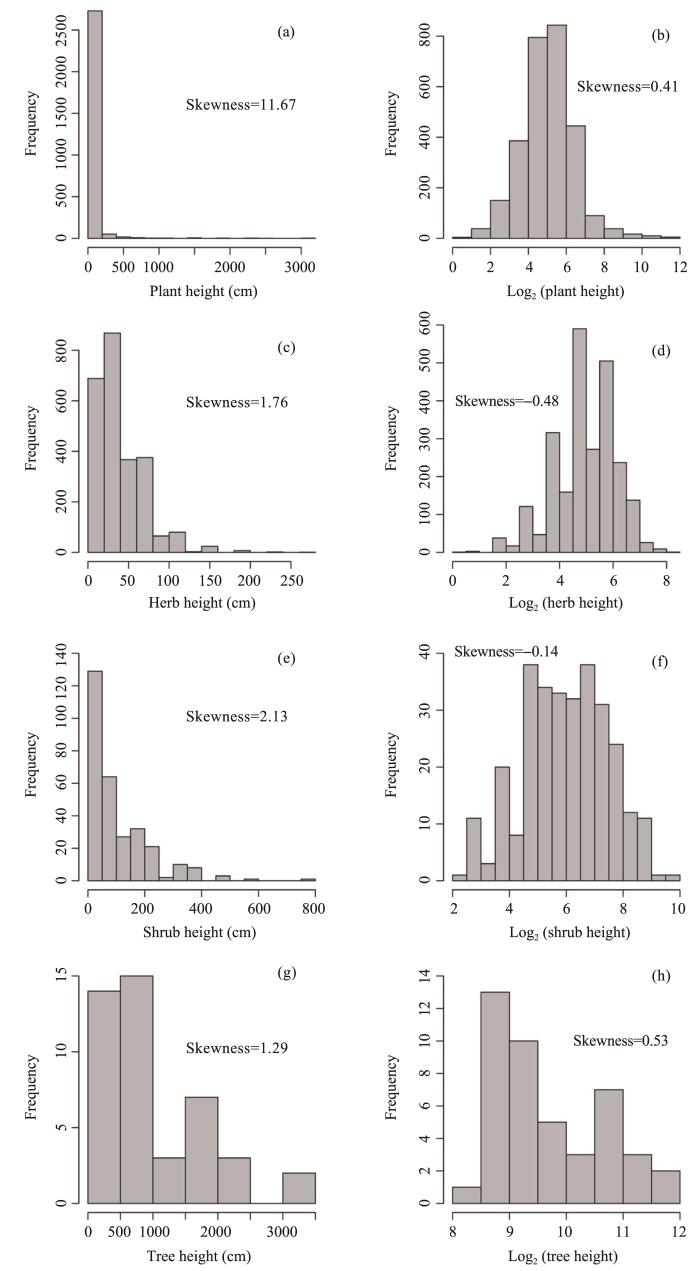
Figure S2
Frequency distributions of plant height
Figure S3
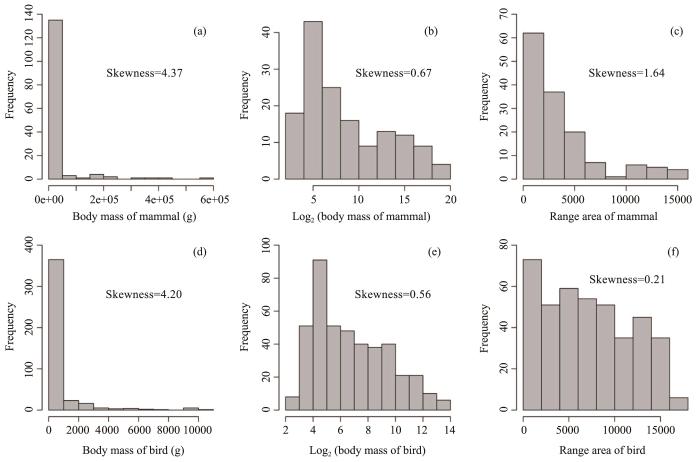
Figure S3
Frequency distributions of animal range area and body mass
Reference
Correlates of extinction risk in squamate reptiles: the relative importance of biology, geography, threat and range size
Causality of the relationship between geographic distribution and species abundance
Climate and vegetation: an ERA-Interim and GIMMS NDVI analysis
A little bit everyday: range size determinants in Arachis (Fabaceae), a dispersal‐limited group
Florae Xinjiangensis
Xinjiang Science & Technology Publishing House, Urumqi.
Within-genus size distributions in angiosperms: small is better
Correlates of range size variation in the Australian seed‐plant flora
Range size-body size relationships: evidence of scale dependence
Effect of geographical range size on plant functional traits and the relationships between plant, soil and climate in Chinese grasslands
Very high resolution interpolated climate surfaces for global land areas
Interspecific geographic range size-body size relationship and the diversification dynamics of Neotropical Furnariid birds
Determinants of local abundance and range size in forest vascular plants
Evolutionary patterns in the geographic range size of Atlantic forest plants
Vascular plant range size patterns and the relationship with climate and plant richness in Xinjiang region, China
Plant body size patterns of mountainous trees and grassland herbs in Xinjiang region, China
Species richness patterns and Water-Energy Dynamics in the drylands of northwest China
Distribution patterns of the species richness of plants and animals in Xinjiang, China
Using "random forest" for classification and regression
Climate and topography explain range sizes of terrestrial vertebrates
Home range, time, and body size in mammals
Geographic patterns of insect diversity across China's nature reserves: The roles of niche conservatism and range overlapping
Comparative biogeography of New Zealand trees: species richness, height, leaf traits and range sizes
Habitat area and climate stability determine geographical variation in plant species range sizes
The use of range size to assess risks to biodiversity from stochastic threats
Biodiversity hotspots for conservation priorities
Constraints on vertebrate range size predict extinction risk
Habitat specialization, distribution range size and body size drive extinction risk in carabid beetles
Geographic ranges of plant species in relation to dispersal morphology, growth form and diaspore weight
Wing morphology and migration status, but not body size, habitat or Rapoport's rule predict range size in North‐American dragonflies (Odonata: Libellulidae)
Biodiversity hotspots are insufficient in capturing range‐restricted species
A Guide to the Mammals of China
Global patterns and determinants of forest canopy height
Body size and extinction risk in terrestrial mammals above the species level
Evolutionary predictors of mammalian home range size: body mass, diet and the environment
EltonTraits 1
.
Plant geographical range size and climate stability in China: Growth form matters
Patterns of maximum height of endemic woody seed plants in relation to environmental factors in China
Regional and historical factors supplement current climate in shaping global forest canopy height
