2. Taiyuan Design Institute, China Railway Engineering Consulting Group Co. Ltd., Taiyuan, Shanxi 030013, China
There is a wealth of land, forests, biodiversity, and mineral deposits in China's vast permafrost regions. The rapid development of the economy, which is in urgent need of resources, makes the construction of roadways in permafrost regions an imminent concern. As far as roadways in permafrost regions are concerned, stability is determined by the subgrade; the stability of subgrade, in turn, is determined by the permafrost; and the key problem with permafrost is thaw settlement (Cheng et al., 2006 ). So we face the challenge of reducing thaw settlement of the roadbed and protecting the underlying frost soils. In recent years, with the serious impact of global warming and engineering projects, permafrost-protection measures were changed from passively preserving heat to positively decreasing temperature (Ma et al., 2002 ; Cheng, 2003). In the construction of the Qinghai–Tibet Railway, the block-rock embankment (BRE) approach was used as a typical method to regulate heat convection and to cool down the roadbed. Due to the advantages of its obvious cooling effects, relatively small construction difficulties, easy sampling, and environmental friendliness, block-rock embankment has been widely used on the Qinghai–Tibet Railway, Qinghai–Tibet Highway, and Ching–Hong Road; and it will be promoted for other roadways in the future.
Many researchers conducted studies on the cooling mechanisms, cooling characteristics, and cooling effects of BRE, through indoor and outdoor experiments, and numerical simulation calculation. Experience with the application of BRE has been accumulated from their broad and deep study and will be summarized in this article. With the development of engineering construction in permafrost regions, engineering protection measures were introduced and widely used in practical projects. The evaluation research on adaptability and stability of these engineering protection measures was conducted qualitatively and quantitatively. Wu et al. (2002) established a comprehensive quantitative evaluation model of the permafrost environment, with indicators of permafrost thermal stability, thermal thawing sensitivity, and landscape stability. The evaluation accurately reflects the changing permafrost characteristics under the influence of engineering disturbance. Niu et al. (2002) based the Beiluhe permafrost engineering geology evaluation on aspects of permafrost types, groundwater conditions, ground temperature, and soil material. Cao et al. (2008) made a quantitative evaluation of the permafrost environment in a Muli coalfield by the method of AHP (analytic hierarchy process) and catastrophe progression. Ma et al. (2009) proposed a fuzzy comprehensive evaluation model of subgrade stability in permafrost regions. At present, though BRE has been widely used in permafrost regions, it is rare to conduct a study on the evaluation of adaptability and stability of BRE in permafrost regions. This article will address this issue systematically.
2 Factors influencing BRE stability and indicators representing BRE effectivenessTo evaluate the adaptability of BRE, one firstly should determine the factors influencing BRE stability and the indicators representing BRE effectiveness.
2.1 Factors influencing BRE stabilityFactors influencing BRE stability in permafrost regions are complex and can be classified into three aspects: external climate conditions, frozen-soils internal factors, and subgrade characteristics (Wang and Dou, 2005).
External climate conditions include temperature, solar radiation, wind speed and direction, rainfall and snowfall, slope-surface evaporation, etc.. Temperature is an integrated indicator that is affected by microclimate, such as precipitation, evaporation, cloud cover, and wind. So temperature is the primary factor in external climate conditions. Solar radiation as an important way for subgrade boundary energy exchange directly affects the temperature of frozen soil, permafrost thickness, and so on. But regarding the fact that the information about for solar radiation is hard to get, the temperature of frozen soil and permafrost thickness are chosen to substitute solar radiation. Wind speed and direction is particularly important to BRE which cools the subgrade by the convection effect. The effect of wind direction is often closely related to the route-trend. When the two intersect, it's easy to form thermal regime symmetry in embankment in permafrost regions. Slope-water evaporation is also an important pathway for subgrade energy exchange and is associated with slope gradient and aspect, along with vegetation coverage. Due to its poor characterization, we use two nonclimate factors (slope gradient and aspect; vegetation coverage) to demonstrate its impact on the stability of BRE. Rainfall impacts the stability of BRE mainly by changing the thermal properties of the subgrade, while snowfall impacts the stability of BRE mainly by preventing heat exchange of the subgrade with the outside world. Because the impact of rainfall and snowfall on subgrade stability can't be evaluated accurately so far, these factors are ignored as influencing BRE stability.
Frozen-soils internal factors include the distribution of natural permafrost, ground ice-content, earthiness, ground temperature, natural upper limit, etc.. The distribution of natural frozen soils impacts the characteristics of frozen soils in the aspects of the macrogeographical, such as altitude and latitude. So we can demonstrate the impact of the distribution of natural frozen soils on subgrade stability by using two microscopic factors: ground temperature and natural upper limit. Ground-ice content is the basis of subgrade design and also is an important factor that impacts greatly the temperature, moisture, and stress field of the subgrade. The difference of soil material (lithology) causes differences in porosity, heat storage, and infiltration capacity, further influencing subgrade stability. The natural upper limit as an important symbol of frozen soil directly affects permafrost resistance to external interference and, consequently, influences subgrade stability. Ground temperature not only represents the local air temperature but also demonstrates the steady state of the frozen soil itself. So, it impacts subgrade stability greatly.
Subgrade characteristics include subgrade height, route, pavement types, particle size of block rock, thickness of the block-rock layer, thickness of the overlying sand layer, boundary conditions, etc.. Subgrade height must be controlled within a certain range. If it's too small, the heat transmitted from the pavement to the underlying permafrost can't be reduced; if it's too large, the melt soil core and thermal regime symmetry in the embankment are easy to form. Therefore, subgrade height is an important factor affecting the stability of the underlying permafrost and subgrade body. Route often leads to temperature difference and nonuniform settlement of the subgrade slope and endangers subgrade stability. Pavement types often mentioned in highway engineering include gravel pavement, asphalt pavement, concrete pavement, etc.. Due to its direct impact on the heat balance of the subgrade surface, the pavement type has a significant impact on subgrade stability. Particle size of the block rock determines the capacity of hot and cold air flow, so it affects the strength of convection and, consequently, impacts the cooling effect of BRE. The thickness of the block-rock layer needs to meet the requirements that cold energy can fully reach the bottom in the freezing period and heat cannot reach the bottom in the thawing period, so the difference in thickness leads to the difference in the cooling effect. The overlying sand layer prevents the direct exchange between the block-rock layer and the atmosphere and seriously affects the cooling of BRE. Because the thickness of the overlying sand layer can be generally reflected by the subgrade height, it repeatedly hasn't been taken into account. In actual engineering subgrade, the boundary is generally single and open, so the impact of boundary conditions on the cooling effect of BRE can be ignored.
Given the preceding, where the degree of influence is concerned, the frozen-soils internal factors have the largest, followed by subgrade characteristics, with external climate conditions the smallest. In addition, frozen-soils internal factors can be sorted by importance as follows: ground-ice content > ground temperature > natural upper limit > earthiness. Subgrade characteristics can be sorted by importance as follows: subgrade height > thickness of the block-rock layer > route-trend > particle size of the block rock. External climate conditions can be sorted by importance as follows: air temperature > slope gradient and aspect > vegetation coverage > wind speed and direction.
2.2 Indicators representing BRE effectivenessThe evaluation of BRE effectiveness can be characterized in two ways: the cooling effect and the settlement feature. The cooling effect can be characterized by the change of permafrost upper limit, temperature change of natural upper limit, change of cold reserve, temperature difference of slope, etc.. In this article, the change of cold reserve is chosen to characterize the cooling effect of BRE and is defined as change of accumulated temperature at a certain depth range, such as 5 m below the natural upper limit. The settlement feature can be characterized by total settlement, differential settlement, settlement rate, etc.. Total settlement is chosen to characterize the settlement feature and is defined as the largest settlement deformation of the subgrade section. The calculation and measurement of cold reserve and total settlement are both conducted in October of each year.
3 Establishment of the evaluation index system 3.1 Evaluation index systemBased on the theory of the evaluation index system, the 12 indexes that impact significantly the adaptability of BRE and function clearly are extracted from the factors affecting the adaptability of BRE. Then, the integrated indicator system of the adaptability of BRE in permafrost regions, which consists of three levels (object layer, rule layer, and index layer), is set up according to definite hierarchical relationships between factors, As shown in Table 1, the adaptability of BRE is the objective layer; frozen-soils internal factors, subgrade characteristics; and external climate conditions are the rule-layer elements; the 12 indexes are indexlayer elements.
|
|
Table 1 The integrated indicator system of BRE adaptability in permafrost regions |
After the determination of indexes that impact the adaptability of BRE, we need to further analyze the indexes and assign evaluation grade scale to the individual indicator. Based on the analysis of specifications and other practical engineering data, adaptability can be divided into five states: better, good, ordinary, bad, and worse. The specific division is shown in Table 2.
|
|
Table 2 Evaluation grade scale of single-indicator illustrating adaptability of BRE |
In this article, the catastrophe method is introduced to evaluate the adaptability of BRE in permafrost regions. The catastrophe method, also known as the catastrophe fuzzy membership function, is derived from catastrophe theory, which was founded by French mathematician Rene Thom in 1972. Catastrophe theory was developed to provide a theoretical framework for studying discontinuous phenomena in otherwise continuous systems (Thom and Fowler, 1975). Catastrophe phenomena are "a class of dynamic processes that exhibit a sudden and large scale change in at least one variable in correspondence with relatively small changes in other variables" (Brown, 1995). Compared to other integrated evaluation methods, the catastrophe method demonstrates obvious advantages, mainly for the two following aspects: on the one hand, it does not assign any weights; one needs only to arrange indicators in an order of importance according to the inherent logical relationship among indicators, which avoids the subjectivity of the artificial weight evaluation to a great extent. On the other hand, as a technological approach that combines qualitative and quantitative analysis, the catastrophe method is not only suitable for judging whether the BRE is adaptable but also for providing models to calculate the concrete number value of BRE adaptability (Cheng et al., 2006 ).
The catastrophe method consists of the following steps. First, the system is divided into several subsystems with different evaluation indicators according to the inner mechanisms of the system being assessed. Then, the initial data from the underlying layers are normalized using catastrophe theory and fuzzy mathematics to give the optimal data. To accomplish this, the catastrophe fuzzy membership functions assign values ranging from 0 to 1 to resolve the incomparability of various initial data induced by differences in the data span and dimensions. The total catastrophe fuzzy membership functions of the system are then determined by the normalized data (Wang et al., 2011 ).
Based on the number of state variables (evaluation objectives at all levels) and control variables (evaluation indicators at the sublayer of the state variable), Thom proposed seven basic catastrophe models (Table 3).
|
|
Table 3 Basic catastrophe models |
In Table 3, the potential function described by state variables (such as x, y) and control variables (such as a, b, c, d) means the ability of the system tending to be at certain state. When using the formula for normalized data, all indicators of catastrophe fuzzy membership functions in one subsystem are dealt with. Follow to calculate the x value:
The cusp catastrophe: xa=a1/2, xb=b1/3
The swallowtail catastrophe: xa=a1/2, xb=b1/3, xc=c1/4
The butterfly catastrophe: xa=a1/2, xb=b1/3, xc=c1/4, xd=d1/5
When performing recursive computations, the principle of minimum values or the principle of mean values is selected after determining whether the indicators are complementary to each other or interchangeable within one subsystem.
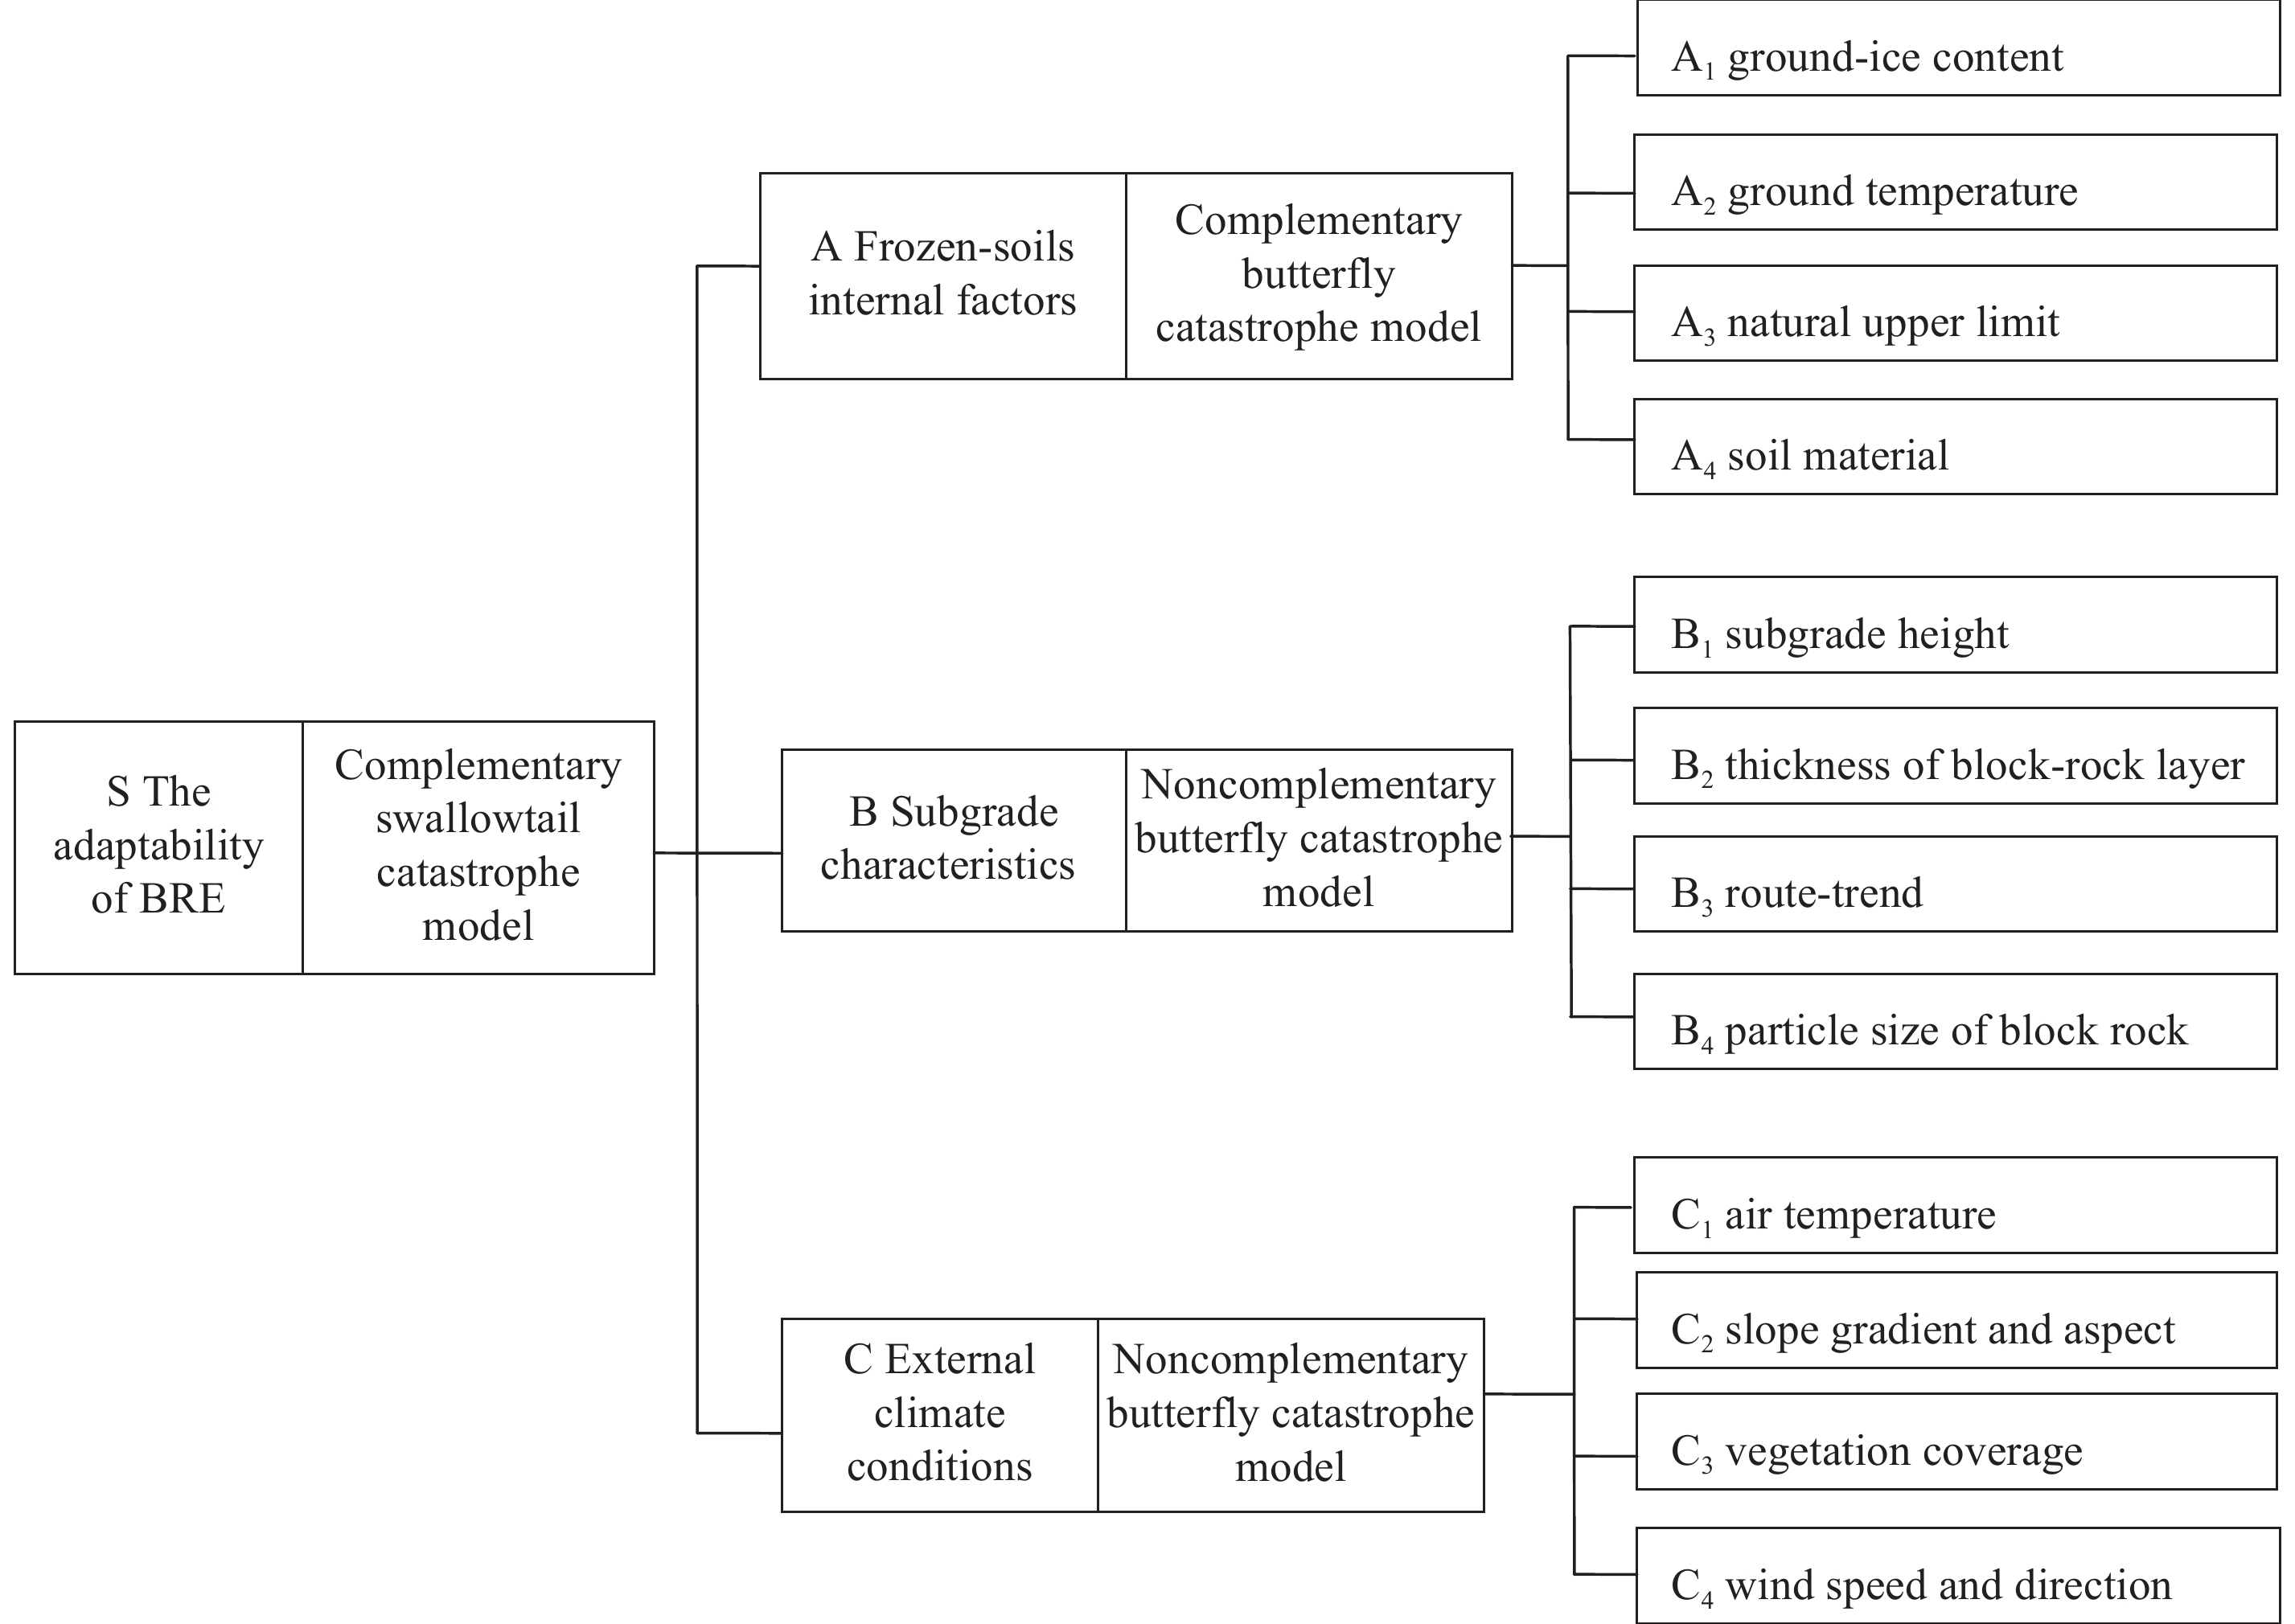
4.2 Evaluation modelBased on the evaluation index system of BRE adaptability and relationships among indicators, the evaluation model of BRE adaptability is constructed by the means of the catastrophe method, as shown in Figure 1.

|
Figure 1 Evaluation catastrophe model of adaptability of BRE in permafrost regions |
Based on the evaluation index system of BRE adaptability, we collected the information about practical engineering subgrade-design parameters and subgrade surrounding conditions (include external climate conditions and internal frozen-soils properties) by means of direct inquiries and scientific estimates. The evaluation index values were then extracted and normalized, given the incomparability of various initial data induced by differences in the data span and dimensions. In this article, the percentage standardized method is used to change the initial data into dimensionless, comparable indicators ranging from 0 to 1. To obtain the positive indicator, X = Si/Ci, T negative indicator, X = 1 − Si/Ci. In the formula, Si is the indicator actual value; Ci is the indicator reference value (Table 4).
|
|
Table 4 Reference value of standardization for assessment indicator of BRE adaptability |
By use of the catastrophe-progression method, the grade standard values for assessment of BRE adaptability in permafrost regions (Table 5) can be obtained through calculation of mutating subjection function values of variables in each layer.
|
|
Table 5 Grade standard for assessment result of BRE adaptability in permafrost regions |
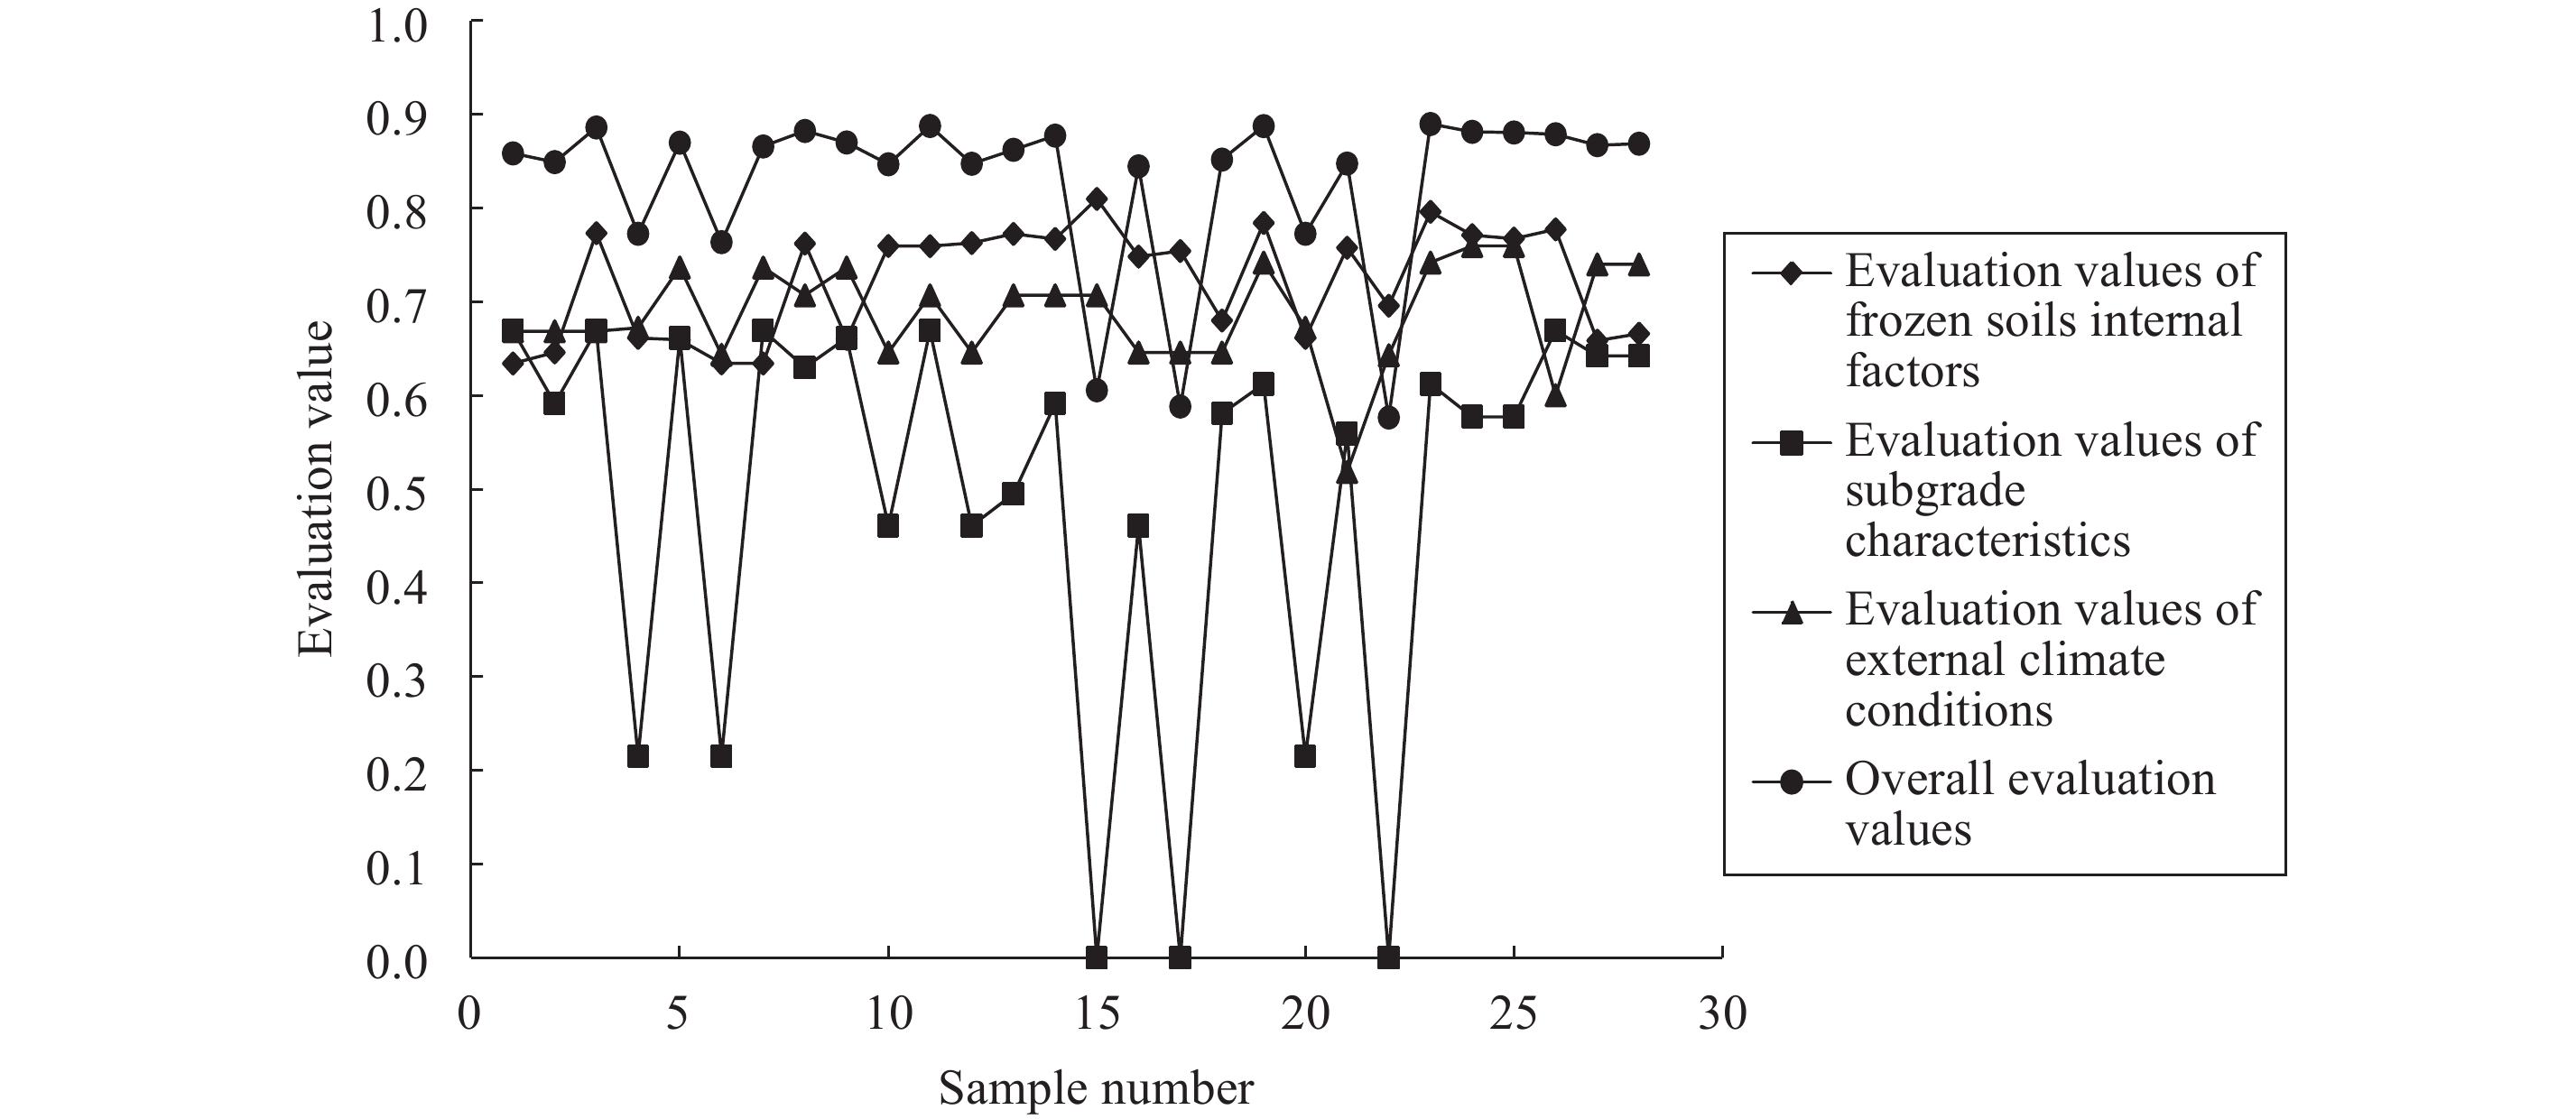
To verify whether the evaluation model established by the catastrophe-progression method in this article can reflect the applicable conditions of BRE in permafrost regions, 28 samples were selected for evaluation analysis of the results. For comparison, changing trends of four evaluation value curves were plotted in one coordinate system, as shown in Figure 2.

|
Figure 2 Evaluation value curve of BRE adaptability |
It can be seen from Figure 2 that 28 overall evaluation values generally fall on four states: good (3), ordinary (17), bad (4), and worse (4). Although the sample number is small, a few of the evaluation values are distributed between the two sides, with most of them in the middle. Of four evaluation value curves, the evaluation value curve of frozen-soils internal factors varies slowly. The evaluation value curve of external climate conditions varies moderately, despite the fact that it changes severely in the 19th~23rd sample sector. The main reason for the exception is that the annual mean temperature of the regions studied are higher, and the subgrade slopes are slightly steeper than in other regions. The evaluation value curve of subgrade characteristics fluctuates violently, especially at sample points 4, 6, 15, 17, 20, and 22; the curve changes to the minimum point abruptly. This drop is mainly because the subgrade height of the samples selected are higher. Overall, the evaluation value curve should be most affected by the evaluation value of frozen-soils internal factors, while in practice, it is most affected by the evaluation curve of subgrade characteristics. The decline of the overall evaluation values are always on the premise of the sharp drop of the subgrade characteristics evaluation values. This drop is mainly caused by the more violent changes of subgrade characteristics evaluation values rather than frozen-soils internal factors evaluation values.

|
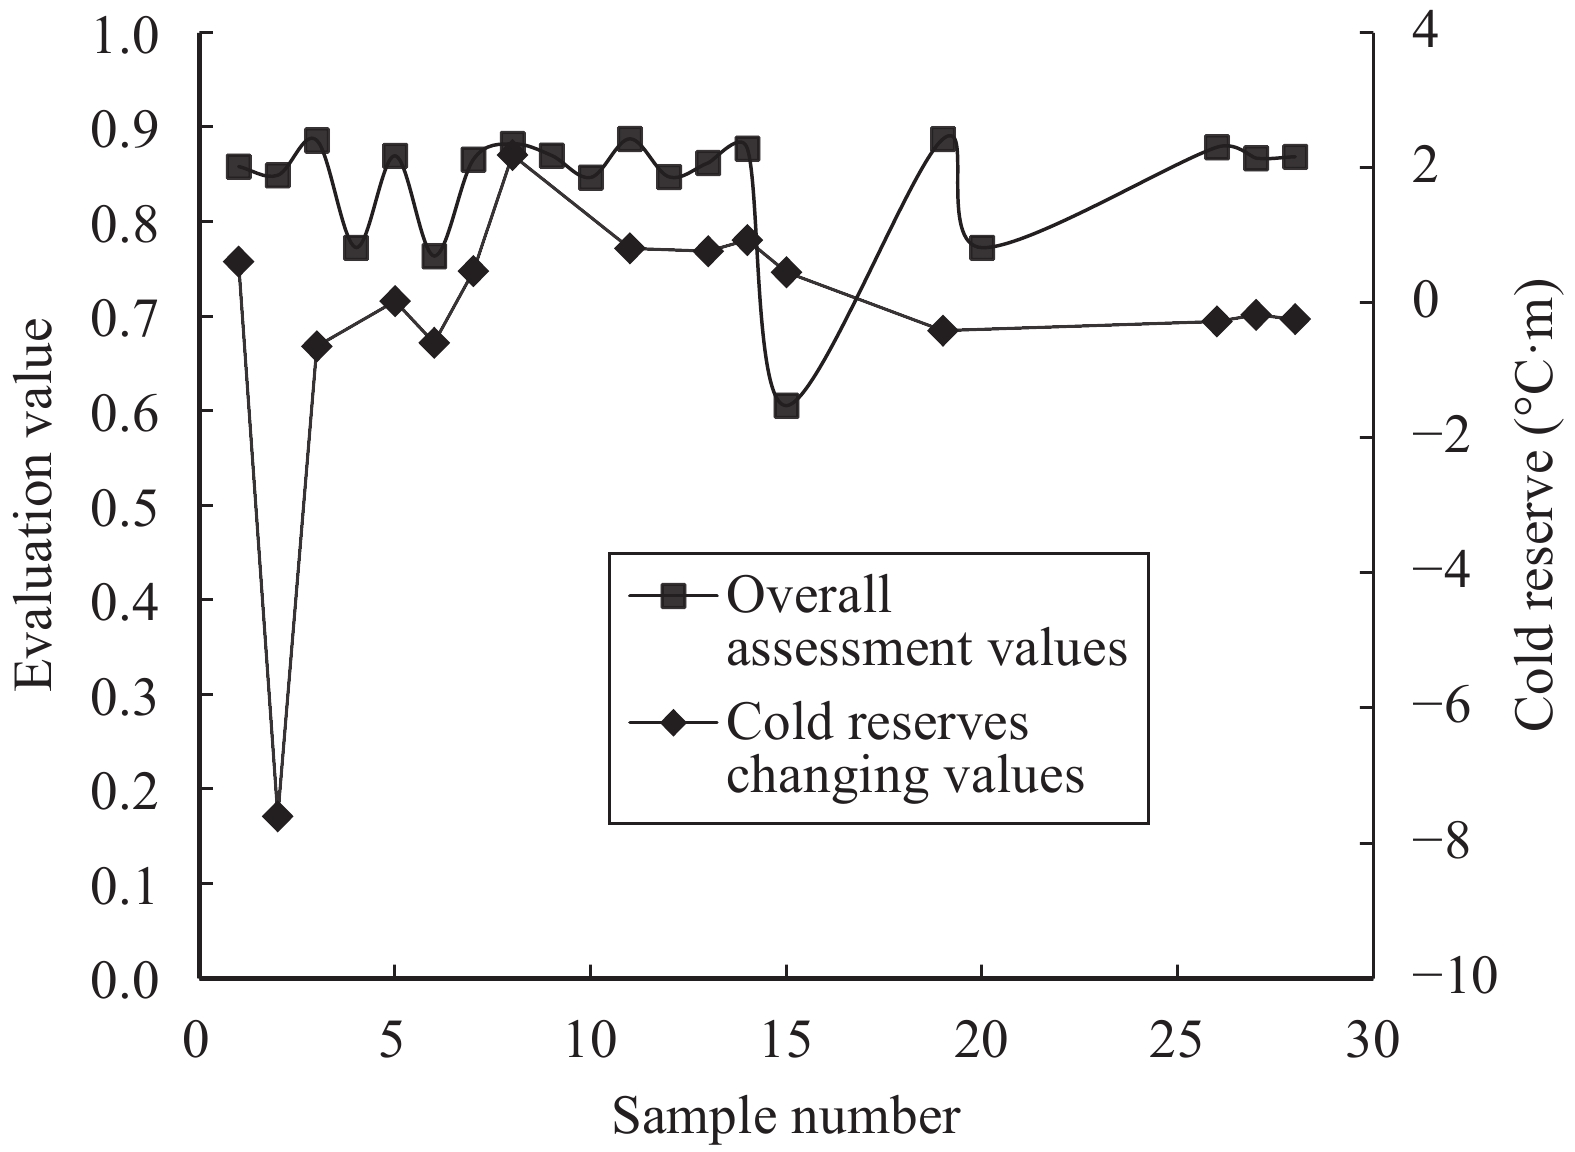
Figure 3 The relationship graph of overall assessment values and cold-reserves changing values in the subgrade base (1 freeze–thaw cycle) |
To verify the fitness between evalaution values and actual effectiveness, 28 samples of measured data are summarized. We can select two indicators (that is, the cold-reserve change value and the total settlement value) for verification because the effectiveness of BRE can be expressed by the cooling effect and settlement deformation.
As shown in Figure 3, the variation tendency of the overall evaluation values and the cold-reserves change values is almost the same, although the cold-reserves values of some sample points are missing. The cold-reserves change values can reflect the variation of temperature of the underlying deep soil, so it is the best indicator by which to judge whether the cooling effect is good or bad. Above all, overall evaluation values can reflect and predict the cooling effect of BRE more accurately.

|
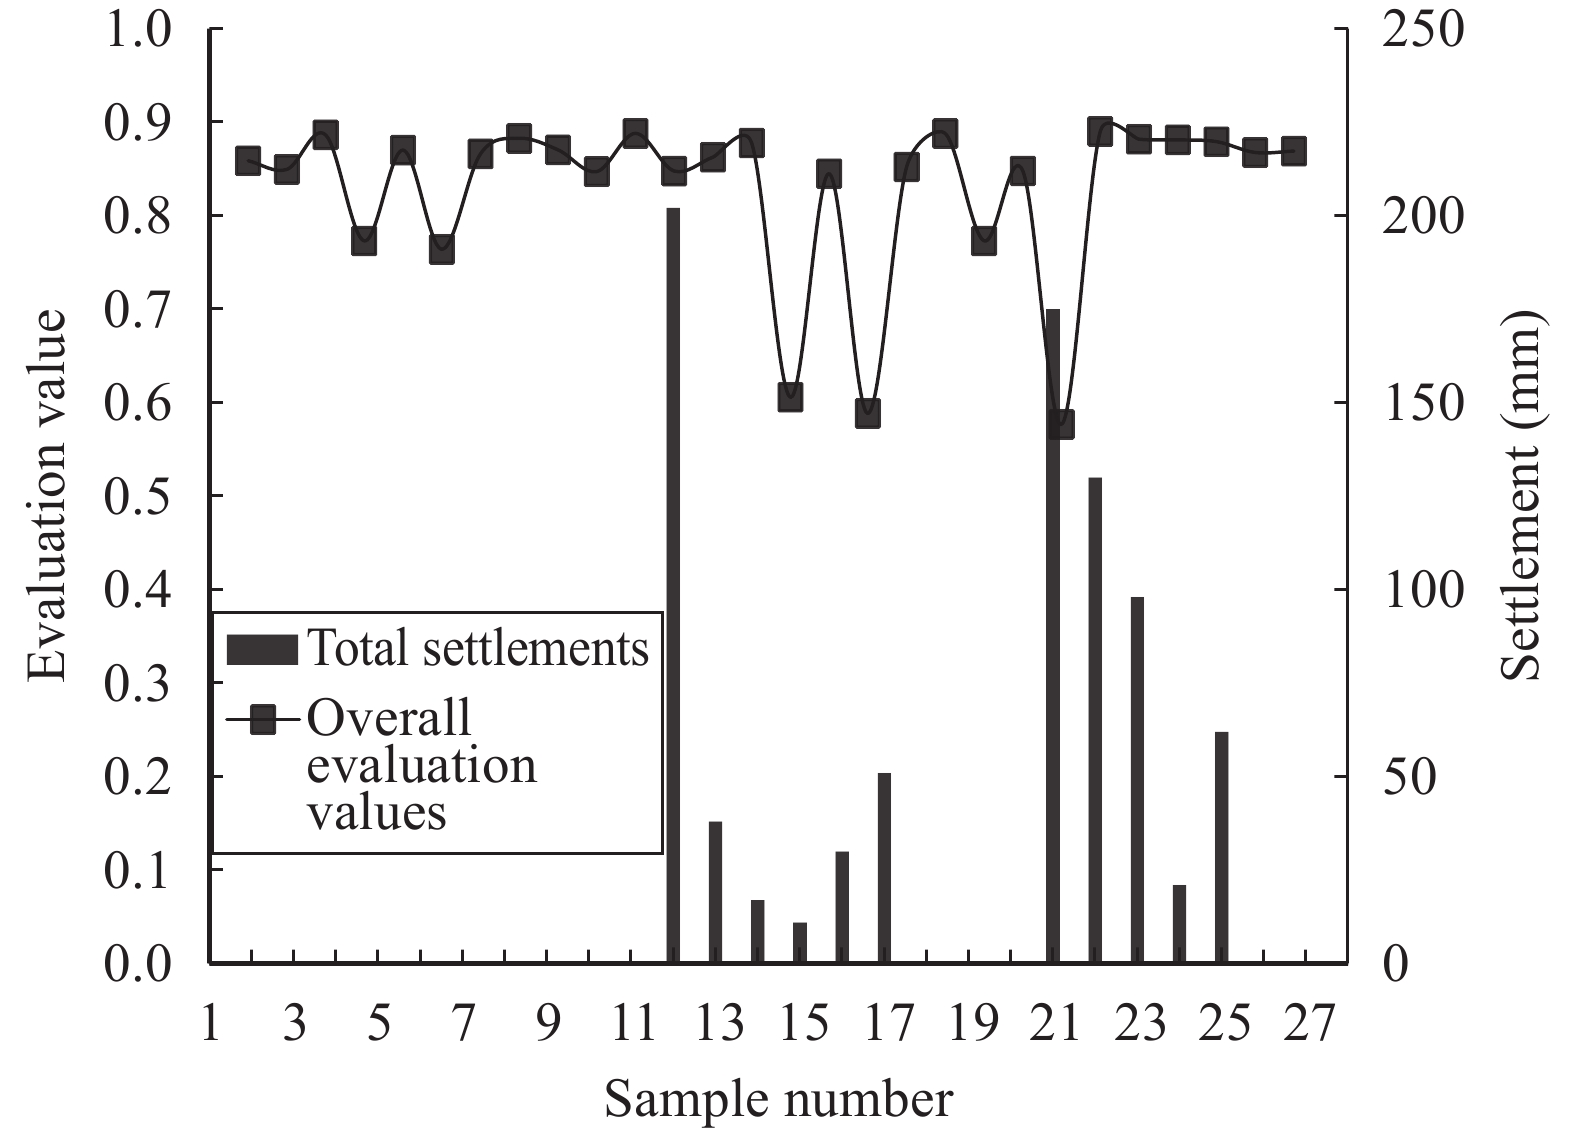
Figure 4 The relationship graph of overall evaluation values and total settlements (2 freeze–thaw cycles) |
As shown in Figure 4, the consistency of overall evaluation values and total settlement is much different from the consistency of overall evaluation values and cold reserves. This difference is mainly because of the time-interval inconsistency between the completion of roadbed construction and implementation of settlement monitoring. The less the time gap, the larger the postconstruction settlement, as well as the acquired deformation. Despite this, we can still roughly tell the relevance of their change curves. On a few of the points that indicate high settlement values—like points 12, 17 and 22—the overall evaluation value is generally small. When the settlement values are lower, the overall evaluation values are larger, such as points 13, 14 and 24.
In conclusion, through validation of 28 engineering samples, the overall evaluation value obtained by the catastrophe-progression method can accurately reflect the effectiveness of BRE in the aspects of BRE's cooling effect and settlement deformation, thus making it a good indicator for evaluating the adaptability of BRE.
5 Conclusions(1) Factors influencing BRE stability in permafrost regions are complex. To sum up, they can be classified into three aspects: external climate conditions, frozen-soils internal factors, and subgrade characteristics. External climate conditions are incentives and motivations to influence the applicable condition of BRE; frozen-soils internal factors are fundamental mechanisms directly affecting the transmission of temperature and moisture fields in roadbeds; and subgrade characteristics are the the only factors that require manual adjustment.
(2) Based on the theory of an evaluation index system, evaluation indexes of 12 factors that impact significantly on the adaptability of BRE and that clearly function are extracted from the factors affecting the adaptability of BRE. Then, the integrated indicator system of the adaptability of BRE in permafrost regions is set up according to definite hierarchical relationships between factors, which consist of three levels: object layer, rule layer, and index layer.
(3) According to the correlations among indicators, the mathematical model of evaluation is established by the catastrophe-progression method. Twenty-eight practical engineering projects were selected to verify the rationality and practicability of the model. It is concluded that the adaptability of BRE can be evaluated and predicted more accurately by the evaluation model.
Brown C. 1995. Chaos and catastrophe theories. London: SAGE Publications, Inc., 34(3): 418. |
Cao W, Sheng Y, Chen J. 2008. Study of the permafrost environmental assessment in Muli coalfield, Qinghai Province. Journal of Glaciology and Geocryology, 30(1): 157-164. |
Cheng GD. 2003. Construction of Qinghai-Tibet railway with cooled roadbed. China Railway Science, 24(3): 1-4. |
Cheng GD, Sun ZZ, Niu FJ. 2006. Application of roadbed cooling methods in the Qinghai-Tibet railway construction. Journal of Glaciology and Geocryology, 28(6): 797-808. |
Cheng YF, Sun DY, Lu GF. 2006. Application of catastrophe progression method in ecological suitability assessment: A case study on Zhenjiang new area. Acta Ecologica Sinica, 26(8): 2587-2593. |
Ma LF, Liu JK, Niu FJ. 2009. Reliability based AHP-fussy synthetic evaluation system for stability of roadbeds in permafrost regions. Journal of Engineering Geology, (4): 522-527. |
Ma W, Cheng GD, Wu QB, et al. 2002. Preliminary study on technology of cooling foundation in permafrost regions. Journal of Glaciology and Geocryology, 24(5): 579-587. |
Niu FJ, Zhang JM, Zhang Z. 2002. Engineering geological characteristics and evaluations of permafrost in Beiluhe testing field of Qinghai-Tibetan Railway. Journal of Glaciolgy and Geocryology, 24(3): 264-269. |
Thom R, Fowler DH. 1975. Structural stability and morphogenesis: An outline of a general theory of models. MA: Benjamin, 6(5): 544. |
Wang HN, Dou MJ. 2005. A study on factors influencing thermal stability of permafrost embankments in Qinghai-Tibet Plateau. Highway, (5): 1-5. |
Wang WJ, Liu SL, Zhang SS, et al. 2011. Assessment of a model of pollution disaster in near-shore coastal waters based on catastrophe theory. Ecological Modelling, 222: 307-312. DOI:10.1016/j.ecolmodel.2010.09.007 |
Wu QB, Zhu YL, Liu YZ. 2002. Evaluation model of permafrost environmental changes under human engineering activities. Science in China (Ser. D), 2: 141-148. DOI:10.1016/S0165-232X(01)00047-7 |
 2017, Vol. 9
