 2017, Vol. 9

2. University of CAS, Beijing 100049, China;
3. CAS Center for Excellence in Tibetan Plateau Earth Sciences, Beijing 100085, China;
4. College of Population, Resources and Environment, Shandong Normal University, Jinan, Shandong 250014, China
The Tibetan Plateau (TP) and surroundings contain the largest number of glaciers outside the polar regions (Yao et al., 2008 ). However, due to global warming, the glaciers on the TP (Kang et al., 2010 ; Yao et al., 2012 ) and in the Himalayas (Scherler et al., 2011 ; Bolch et al., 2012 ) are experiencing widespread shrinking. Glacial retreat and significant mass loss can cause natural hazards such as landslides and glacier-lake outburst floods, whilst also threatening the long-term viability of water resources (Immerzeel et al., 2010 ). Therefore, the behaviors of high-altitude Asian glaciers need urgent attention.
The surface-energy balance (SEB) physically describes the melting process and the relationship between climate change and glacier ablation (Oerlemans, 1991). Some studies (e.g., Li et al., 2011 ; Yang et al., 2011 ; Sun et al., 2012 , 2014; Zhang et al., 2013a ; Azam et al., 2014 ; Zhu et al., 2017 ) on the TP have shown that net shortwave radiation is the primary source of SEB, accounting for more than 80% of the total energy input, while turbulent heat fluxes vary mainly with local climate. Huintjes (2014) compared the SEBs of five glaciers in the center, southwest, and northeast of the TP, respectively, concluding that the three southernmost glaciers were characterized by the lowest overall albedo and therefore strongest net solar-radiation input, while for glaciers in the center and northwest of the TP the overall energy loss by net longwave radiation was larger than the energy gain by net solar radiation.
More and more knowledge has been obtained about climatic mechanisms controlling glacier variations across the TP and Himalayas. The shrinkage of glaciers on the southern TP and in the Himalayas has been explained by the weakening South Asian monsoon (Yang et al., 2011 ; Bolch et al., 2012 ; Mölg et al., 2012 ), while the westerlies have also played a significant role in the glacier-mass changes on the monsoon-dominated southern TP (Mölg et al., 2013 ). Although most glaciers on the TP are losing mass under global warming (Zemp et al., 2009 ; Kääb et al., 2012 ; Yao et al., 2012 ), an anomalous gain in mass has been suggested for the Karakoram glaciers (Gardelle et al., 2012 ; Gardelle et al., 2013 ) due to an increase in winter precipitation since 1961. Our understanding of the climatic mechanisms controlling glacier variations across the TP and Himalayas is still rather limited.
The Qilian Mountains are located on the northeastern TP. The climate in that region is predominantly influenced by westerly winds at the 500-hPa level (Maussion et al., 2014 ), with southwesterly airflow occasionally reaching the area in summer (Long and Li, 1999). The SEB studies on glaciers of the Qilian Mountains (Jiang et al., 2010 ; Sun et al., 2012 , 2014) have all concentrated on the ablation season or at point. In this study, a distributed-energy and mass-balance model was applied to Laohugou No. 12 Glacier, western Qilian Mountains. The model calculated the components of the surface energy and mass balance for every hour and in each grid cell, at a spatial resolution of 30 m. The mass-balance components were analyzed and compared to those of other glaciers on the TP. Furthermore, the relationship between climate and glacier mass balance was established.
2 Study area and field observations 2.1 Study areaLaohugou No. 12 Glacier (39°26.4′N, 96°32.5′E; Figure 1) lies in the western Qilian Mountains and is characterized by a typical continental climate, which is influenced by westerly winds all year-round (Sun et al., 2014 ). The glacier is 9.85-km long and has an area of 20.4 km2. It covers an elevation range of 4,260~5,481 m a.s.l. (Du et al., 2008 ). Previous studies discussed the energy components at point scale on this glacier (Sun et al., 2012 , 2014), demonstrating that the net radiation flux is the primary component of the surface-energy balance and responsible for most glacial melt, followed by sensible-heat flux; glacier melt was the main output of surface energy, followed by latent-heat flux.

|
Figure 1 Location map of Laohugou No. 12 Glacier in the western Qilian Mountains. The red stars indicate the location of automatic weather stations (AWS). Dots on the map mark the approximate positions of ablation stakes |
Two automatic meteorological stations (AWS1 5,040 m a.s.l. and AWS2 4,550 m a.s.l.) were installed in the accumulation and ablation zones of Laohugou No. 12 Glacier to record air temperature, humidity, wind speed, and incoming shortwave and longwave radiation. Precipitation and the vertical precipitation gradient were calculated in mm w.e. using two Geonor T-200B gauges, which were accumulative-weighing, bucket-type precipitation gauges without heating. One gauge was located on the eastern margin of the glacier at the same elevation as AWS2; another was located at an elevation of 4,900 m a.s.l.. The precipitation amount was corrected following Yang et al. (1999) , to account for the undercatch caused by wind-induced error, wetting loss, and evaporation. Sensors were connected to a data logger, which recorded half-hourly means of measurements taken every 10 seconds. Details of the AWS and rain-gauge instruments are listed in Table 1.
Two-year datasets were collected by AWS2. During the morning and evening, when the solar angle is low, the incoming shortwave radiation (S↓) was occasionally lower than the upward shortwave radiation. Those data with S↓ lower than 10 W/m2 were discarded. The air-temperature sensor was installed inside a ventilated radiation shield.
|
|
Table 1 Technical parameters of sensors on AWS1 and AWS2 |
Successive mass-balance measurements were carried out on Laohugou No. 12 Glacier during 2010~2012. Thirty plastic ablation stakes were installed on the glacier (Figure 1). The ice-height changes at each stake were measured in September of every year to derive the annual mass balances; and in addition, during the ablation period (May~September), ablation was measured at some stakes at weekly to monthly intervals. Snow depth and density were also measured when the stakes were covered by snow. Nine ablation stakes were installed near AWS2; and their surface-height changes, snow depth, and density were recorded from May 1 to September 30, 2011, at intervals of 1~7 days. These measurements were converted to surface mass balance following standard glaciological methods and used to calibrate model parameters and validate model results.
3 Method 3.1 Energy-and-mass-balance modelThe mass balance model can be described by the following equation:
| $B = \int {\left( {\frac{{\mathop Q\nolimits_{\rm M} }}{{\mathop L\nolimits_{\rm m} }} + \frac{{LE}}{{\mathop L\nolimits_v }} + \mathop C\nolimits_{\rm {en}} + \mathop P\nolimits_{\rm {snow}} } \right){\rm{d}}t} $ | (1) |
where B is the mass balance (mm w.e.); QM is melt energy; LE is turbulent latent-heat flux; Lm is the latent heat of ice melt (3.34×10⁵ J/kg); Lv is the heat of evaporation/sublimation (2.51×10⁶ J/kg or 2.85×10⁶ J/kg), which is determined by glacier surface temperature; Cen is the refreezing of meltwater (not considered in the model); Psnow is the accumulation of solid precipitation; and QM is calculated from the surface-energy-balance model equation:
| ${Q_{\rm M}} = {S_ \downarrow }(1 - \alpha ) + {L^ \downarrow } + {L^ \uparrow } + H + LE + {Q_G}$ | (2) |
where S↓ is the incoming solar radiation; α is the surface albedo; L↓ and L↑ are the incoming and outgoing longwave radiation, respectively; H and LE are the sensible- and latent-heat fluxes; and QG is the subsurface heat flux. On the right-hand side of Equation (2), all energy components are defined as positive when they are directed into the surface and negative when they are directed away from the surface.
3.2 Incoming shortwave radiationAssuming that the incoming shortwave radiation measured by the AWS (Sflat) is the radiation on a flat surface, the effects of slope (β) and aspect (φslope) of a rugged surface on incoming solar radiation are calculated using the following equation (Garnier and Ohmura, 1968).
| $\begin{split}{{S_ \downarrow } = {I_0}{{\left(\frac{{{R_{\rm{m}}}}}{R}\right)}^2}{\psi _{\rm{a}}}^{\frac{P}{{{P_0}\cos {Z}}}} \times [\cos \beta \cos Z + \sin \beta \sin Z({\varphi _{{\rm{sun}}}} - {\varphi _{{\rm{slope}}}})]}\\ { = {S_{\rm {flat}}} \times \frac{{[\cos \beta \cos Z + \sin \beta \sin Z({\varphi _{{\rm{sun}}}} - {\varphi _{{\rm{slope}}}})]}}{{\cos Z}}}\qquad\qquad\end{split}$ | (3) |
where I0=1,368 W/m2 is the solar constant, R is the radius of the earth, Rm is the mean radius, ψa is the atmospheric clear-sky transmissivity, P is the atmospheric pressure, P0 is the mean atmospheric pressure at sea level, Z is the solar-zenith angle, and φsun is the solar-azimuth angle.
3.3 Surface albedoSurface albedo is a critical factor in the energy balance of a glacier surface. According to surface conditions, glacier-surface albedo could be divided into snow albedo and ice albedo. Snow albedo is affected by snow grain size, water content, impurities, clouds' solar zenith angle, and solar zenith angle. In the present study, the parameterization of snow albedo is expressed in terms of snow age and air temperature (Hock and Holmgren, 2005), as follows:
| $\mathop \alpha \nolimits_{\rm {snow}} = \left\{ \begin{array}{l}\mathop \alpha \nolimits_{\mathop t\nolimits_1 } - \mathop a\nolimits_1 \left[ {\ln (T + 1)\mathop {\rm{e}}\nolimits^{(\mathop a\nolimits_2 \sqrt {\mathop n\nolimits_d } )} } \right], \,\, \mathop n\nolimits_d > 0\quad {\rm {and}}\quad T > 0\\[8pt]\mathop \alpha \nolimits_{\mathop t\nolimits_1 } - \mathop {\mathop a\nolimits_3 {\rm{e}}}\nolimits^{(\mathop a\nolimits_2 \sqrt {\mathop n\nolimits_d } )} \quad \quad {\kern 1pt} \quad \quad \,\,,\,\,\mathop n\nolimits_d > 0\quad {\rm {and}}\quad T < 0\\[8pt]\mathop \alpha \nolimits_{\mathop t\nolimits_1 } + \mathop a\nolimits_4 \mathop P\nolimits_s \quad \quad \quad \quad \quad \quad \,\,,\,\,\mathop n\nolimits_d = 0\end{array} \right.$ | (4) |
where αsnow is the snow albedo, αt1 is the albedo of the previous timestep, Ps is the rainfall amount (mm/d), nd is the number of days since the last snowfall, and a1~a4 are constants. An albedo of b in ice albedo was assumed at AWS2, using an average based on observations. T is the air temperature. account for the tendency of debris and light-absorbing particles to accumulate toward the glacier tongue (e.g., Qu et al., 2014 ; Li et al., 2016 ; Niu et al., 2017 ), b is extrapolated using an assumed increase with elevation of 3% per 100 m (Hock and Holmgren, 2005).
3.4 Outgoing long-wave radiation (L↑)L↑ was calculated using the Stefan–Boltzmann law from modeled surface temperature and surface emissivity,
| ${\mathop L\nolimits^ \uparrow = \varepsilon \sigma \mathop {(\mathop T\nolimits_s + 273.15)}\nolimits^4 }$ | (5) |
where ε is the emissivity of the surface (assumed to be 1), σ is the Stefan–Boltzmann constant, and Ts is the surface temperature.
3.5 Turbulent heat fluxes (H and LE)Turbulent heat fluxes were calculated using the bulk method, as follows:
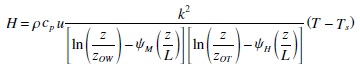
|
(6) |
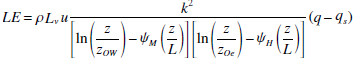
|
(7) |
where ρ is the air density; cp is the specific heat capacity of air; T, q and u are the air temperature (K), specific humidity and wind speed (m/s) at the height of z; qs is the specific humidity at surface; k is von Kármáń's constant (0.4); L is the Monin-Obukhov length; ZOW, ZOT, and ZOe are the roughness lengths for logarithmic profiles of wind speed, temperature, and water vapor, respectively; ψM, ψH and ψE are the stability functions.
The constants ZOT and ZOe of 0.9 mm and ZOW of 1.43 mm were adopted as recommended by Sun et al. (2014), based on mean values during June–September, 2011;ZOW was determined from the eddy-covariance system; and ZOT and ZOe were parameterized following Yang et al. (2002) at AWS2. The stability functions ψM, ψH, and ψE were calculated following Hock and Holmgren (2005), who considered the stable case and unstable case following Forrer and Rotach (1997); the Monin-Obukhov length L was computed iteratively.
3.6 Subsurface heat flux (QG) and snow accumulationThe energy flux in the subsurface was estimated from the temperature-depth profile. The temperature at 15-m depth was taken as −4.2 °C (Sun et al., 2014 ), and the surface temperature was calculated following Fujita and Ageta (2000).
In this area, precipitation can occur as solid, liquid, and mixed phases. The proportion of snowfall versus rain has important implications for the glacier mass-balance modeling because of the snowfall–albedo association. We used a parameterization scheme to determine precipitation types (snow, rain, and sleet), using inputs of wet-bulb temperature, relative humidity, and surface elevation (Ding et al., 2014 ).
4 Results 4.1 Model calibrationWe used the dataset of measured albedo and mass balance at AWS1 in the summer of 2011 to optimize the control parameters (Table 2) and calibrate the model results (Figure 2). The simulated albedo agreed well with the observed values, with a correlation coefficient (R) of 0.75 and root mean square error of 0.12 between measured and simulated albedo. The mass balance model results also agreed well with observed stake values. The modeled accumulated mass balance during this period was −1,730 mm w.e., and the observed value was −1,612 mm w.e.; the root mean square error (RMSE) was 48 mm w.e., which accounted for 3% of the observed value.
|
|
Table 2 The optimized values of parameters in albedo parameterization |

|
Figure 2 Observed versus modeled (a) albedo and (b) mass balance at the site of AWS2 from May 1 to September 30, 2011 |
After local calibration of the primary physical parameters, the energy/mass-balance model was then applied to simulate the glacier mass balance during 2010~2012. The model calculated the components of the surface energy and mass balance. Air temperature was extrapolated by assuming a constant temperature-lapse rate (6.1 °C/km), according to measurements between AWS1 and AWS2 during the summer season, 2011. By comparison of the two T-200B records (Figure 1), the constant precipitation gradient was found to be +9%/100 m.
Figure 3 compares modeled and observed daily mean albedo during the simulation period at AWS2. Generally, the simulated albedo was acceptable on a daily scale, with an RMSE of 0.15. The inset diagram (Figure 3b) shows the performance of simulated daily albedo during May 1 to September 30, 2012, which captures well the increases of albedo due to snowfall events, and subsequent decreases of snow albedo.

|
Figure 3 Observed versus modeled albedo at the site of AWS2 from October 1, 2011, to September 30, 2012 (a). Inserted diagram (b) focuses on daily albedo from May 1 to September 30, 2012. |
To evaluate the performance of the mass-balance model, we compared the surface mass balance at individual ablation stakes with the model results for corresponding grid cells during ablation periods (Figure 4). The R2 and RMSE between measured and simulated surface mass balance were 0.77 and 159 mm w.e.. The least square estimation of the slope of the regression equation between measured and simulated ablation data yielded a slope of 1.06.

|
Figure 4 Simulated and measured point surface mass balance of the individual ablation stakes (mm w.e.) during the ablation period. The heavy black line is 1:1 |
Figure 5 shows the modeled and measured annual net mass balance for each elevation zone over the mass balance years of 2010/2011 and 2011/2012. The model simulated the mass balance very well, except for the area at the terminus. The glacier-wide mass balances were −385 and −232 mm w.e. over the two mass-balance years, respectively; and the mass-balance gradient was 3.66 mm/m.

|
Figure 5 Comparison between modeled and measured annual net mass balance and the distribution of surface area, with altitude |
Figure 6 shows the area-averaged mass-balance components of each mass-balance year. Both ablation and accumulation mainly occurred in the summer. Total ablation was −798 and −724 mm w.e. over the two years, respectively, of which meltwater contributed −694 and −622 mm w.e.; and the remainder was in the form of evaporation and sublimation. Comparing air temperature and precipitation between the two years (Table 3) revealed the same magnitudes in the two winters; while in the summer, the air temperature was higher (0.4 °C) and the precipitation amount was less (59 mm w.e.) during 2010/2011 than in 2011/2012. Figure 7 shows the spatial distribution of annual cumulated mass balance during 2010/2011 and 2011/2012; as expected, the distribution of mass balance was influenced by elevation, as well as terrain slope and aspect.
|
|
Table 3 The averaged air temperature and accumulated precipitation amount in winter and summer at AWS1 during 2010~2012 |

|
Figure 6 The area-averaged components of mass balance of each season in the two observation years (mm w.e.) |

|
Figure 7 Annual cumulated mass balance of Laohugou No. 12 Glacier during 2010~2011 and 2011~2012 |
The equilibrium-line altitude (ELA) is the average elevation at which accumulation exactly balances ablation, over a period of one year. The calculated mean ELA was 5,015 m a.s.l. during the two years on Laohugou No. 12 Glacier. For comparison with other glaciers on the TP, the ELA of Qiyi Glacier (east of No. 12 Glacier) was 4,935 m a.s.l. during the mass-balance periods of 2001/02~2007/08 (Wang et al., 2010 ); Xiao Dongkemadi Glacier (south of No. 12 Glacier) had variable ELAs from 5,480 to 5,850 m a.s.l during 1989~2002 (Pu et al., 2008 ). The ELAs of Laohugou No. 12 Glacier during 1958~1961 and 1974~1976 are shown in Table 4 (Kang and Ding, 1981); the averaged ELA was 4,830 m a.s.l. over those periods and had therefore increased in height by 215 m by 2010~2012. The averaged accumulation-area ratio (AAR) of this glacier was 39% during 2010~2012.
|
|
Table 4 The equilibrium-line altitude (ELA) of Laohugou No. 12 Glacier |
Yao et al. (2012) classified the glaciers on the TP as three transects. Laohugou No. 12 Glacier belongs to transect 1, oriented southwest–northeast, with the Indian monsoon influence weakening northwards. In this transect, we chose eight glaciers with mass-balance records, listed (from south to north) in Table 5. In general, the glacier-wide mass balance became less negative northwards, the Mera Glacier was an exception, when compared to Pokalder Glacier (−720 mm w.e.) about 25 km to the north; over the same years (2009~2012), Mera Glacier had a very small, negative annual glacier-wide mass balance (−230 mm w.e.) (Wagnon et al., 2013 ). Interestingly, ablation was more intense during 2011 than 2012 on Laohugou No. 12 Glacier, in contrast to Mera Glacier, Polalder Glacier (Wagnon et al., 2013 ), Xiao Dongkemadi Glacier (Zhang et al., 2013b ), and Zhadang Glacier (Zhang et al., 2016 ). The anomaly could be explained by temperature and precipitation patterns because temperature was higher and the precipitation amount smaller during 2011 than their respective values during 2012 at this glacier, while the patterns of temperature and precipitation in the other four glaciers were different. The annual glacier-wide mass balance, summer temperature, and precipitation during 2011/2012 at Urumqi No. 1 Glacier, Tienshan Mountains, were the same as those of Laohugou No. 12 Glacier (Wang et al., 2016 ). The southern Asian monsoon dominates the climate of glaciers on the southern TP (Mölg et al., 2013 ; Wagnon et al., 2013 ; Yang et al., 2015 ), while the westerlies dominate the climate of the Qilian Mountains throughout the year (Maussion et al., 2014 ). The southern Asian monsoon rarely reaches the Qilian Mountains; and during the two years, this general absence might contribute to the difference in magnitude in annual mass balance between glaciers on the southern TP and Laohugou No. 12 Glacier.
|
|
Table 5 Annual glacier-wide mass balances on the Tibetan Plateau |
We carried out mass-balance sensitivity experiments to parameters and measurements used in this study (Figure 8). Table 6 shows the parameters and sources of parameter uncertainties. On Laohugou No. 12 Glacier, incoming shortwave radiation is the greatest component of the surface-energy balance (Sun et al., 2012 , 2014), and net shortwave radiation accounted for up to 95% of energy sources at AWS2 during the ablation period. The glacier-wide mass balance was highly sensitive to ±10% variation in S↓ (Figure 7), with the mass balance changing by about ±180 mm w.e. Although L↓ was offset by L↑ (Sun et al., 2012 , 2014), it remained at a high value all year round, especially during the ablation period. The sensitivity experiment in L↓ showed that a ±10% variation of L↓ could result in more than 100 mm w.e. change of glacier-wide mass balance, which is similar to the 30% glacier-wide mass-balance change during 2010/2011. The assumed change in the vertical precipitation gradient could result in greater uncertainty than that of the vertical temperature gradient in glacier-wide mass balance. Due to the effect of terrain factors such as slope and aspect on S↓ (described in section 3.2), the simulation indicated changes of +58 mm w.e. in glacier-wide mass balance before and after considering the effect of terrain factors on S↓. The mass balances were not sensitive to ±10% variations in parameters a1 and a3 relative to albedo. The parameters ZOw, ZOT, and ZOe had a small effect on glacier melting; and ±0.5-mm variations of these caused a change of approximately ±20 mm w.e. in glacier-wide mass balance.
|
|
Table 6 The sensitivity of input parameters and measurements to glacier-wide mass balance from October 1, 2010 to September 30, 2011. The base value (V) and range (R) were taken from the stated references |

|
Figure 8 The sensitivity of specific mass-balance components examined by perturbation of each parameter value within the defined range (Table 6) |
We also carried out simulations of seven precipitation-change scenarios by changing the annual total precipitation in 10% steps, from −30% to +30%. The temperature was increased by 1.5 °C in every simulation (Figure 9). The results showed that the 1.5 °C temperature increase under climate change could result in a further 400 mm w.e. of glacier melting, but that a 30% increase in total precipitation could roughly offset this change. The glacier mass balance varied linearly with change of precipitation, at a rate of 130 mm w.e. per 10% change in total precipitation. In general, maritime glaciers with high precipitation are more sensitive to variations in temperature; but as the climate becomes more continental, the sensitivity to precipitation became more obvious. For instance, a 50% change in precipitation could offset the mass-balance change resulting from a 1 °C temperature change at Brewster Glacier, New Zealand (Anderson et al., 2010 ); the mass balance was roughly two to three times more sensitive to 1 °C air-temperature change than to a 30% precipitation change at Parlung No. 94 Glacier, a maritime glacier on the southeastern TP. Zhu et al. (2017) discussed sensitivities of temperature and precipitation of three glaciers on the TP; they found that glaciers with high temperature and a high amount of precipitation were more sensitive to change of temperature; conversely, glaciers with low temperature and a low amount of precipitation were more sensitive to change in precipitation. However, sensitivity experiments on Zhadang Glacier, central TP, showed that the mass balance was more sensitive to changes in precipitation than temperature (Zhang et al., 2013a ); at Qiyi Glacier, the glacier ELA could ascend (descend) 172 m when warm-season air temperature increases (decreases) by 1 °C, while it could ascend (descend) 62 m when cold-season precipitation decreases (increases) by 10% (Wang et al., 2010 ).

|
Figure 9 Sensitivity of mass balance of Laohugou No. 12 Glacier under a temperature increase of +1.5 °C to annual total precipitation changes at percentage intervals of 10% |
Glaciometeorological measurements and mass-balance stake records were collected at Laohugou No. 12 Glacier for the two-year period of 2010~2012. With those datasets as inputs, a physically based, distributed-energy/mass-balance model was used to examine the state of the glacier. The model was calibrated and validated by measured albedo and mass balance. The averaged glacier-wide mass balance over the two years was −309 mm w.e., with a mean ELA of 5,015 m a.s.l.. Compared to other glaciers on the TP, the pattern of mass balance on No. 12 Glacier was different from those to the south of the TP but the same as that of Urumqi No. 1 Glacier, Tienshan Mountains. Combining variations of temperature and precipitation, we inferred that the Southern Asian monsoon seldom arrives in the region of Laohugou No. 12 Glacier; and the westerlies dominate the climate of this region.
Climatic sensitivity experiments indicate that the glacier mass balance is more sensitive to uncertainties from S↓ and L↓ than to a change of ±5%/100m vertical precipitation. We assumed that the air temperature would increase by 1.5 °C in a future climate, and that more glacier ablation could be offset by a change of 30% in precipitation amount. The glacier mass balance varied linearly with precipitation, with a ratio of 130 mm w.e. for every 10% change of total precipitation.
Acknowledgments:The work was supported by the Chinese Academy of Sciences (KJZD-EW-G03-04) and the National Natural Science Foundation of China (41721091, 41671071), and Open Foundation of State Key Laboratory of Hydrology-Water Resources and Hydraulic Engineering (No. 2017490711). Many thanks are also extended to colleagues working at the Qilian Station of Glaciology and Ecological Environment.
Anderson B, Mackintosh A, Stumm D, et al. 2010. Climate sensitivity of a high-precipitation glacier in New Zealand. Journal of Glaciology, 56(195): 114-128. DOI:10.3189/002214310791190929 |
Azam MF, Wagnon P, Vincent C, et al. 2014. Processes governing the mass balance of Chhota Shigri Glacier (western Himalaya, India) assessed by point-scale surface energy balance measurements. The Cryosphere, 8(6): 2195-2217. DOI:10.5194/tc-8-2195-2014 |
Bolch T, Kulkarni A, Kääb A, et al. 2012. The state and fate of Himalayan glaciers. Science, 336(6079): 310-314. DOI:10.1126/science.1215828 |
Ding BH, Yang K, Qin J, et al. 2014. The dependence of precipitation types on surface elevation and meteorological conditions and its parameterization. Journal of Hydrology, 513: 154-163. DOI:10.1016/j.jhydrol.2014.03.038 |
Du WT, Qin X, Liu YS, et al. 2008. Variation of the Laohugou Glacier No. 12 in the Qilian Mountains. Journal of Glaciology and Geocryology, 30(3): 373-379. |
Forrer J, Rotach MW. 1997. On the turbulence structure in the stable boundary layer over the greenland ice sheet. Boundary-Layer Meteorology, 85(1): 111-136. DOI:10.1023/A:1000466827210 |
Fujita K, Ageta Y. 2000. Effect of summer accumulation on glacier mass balance on the Tibetan Plateau revealed by mass-balance model. Journal of Glaciology, 46(153): 244-252. DOI:10.3189/172756500781832945 |
Gardelle J, Berthier E, Arnaud Y. 2012. Slight mass gain of Karakoram glaciers in the early twenty-first century. Nature Geoscience, 5(5): 322-325. DOI:10.1038/ngeo1450 |
Gardelle J, Berthier E, Arnaud Y, et al. 2013. Region-wide glacier mass balances over the Pamir-Karakoram-Himalaya during 1999–2011. The Cryosphere, 7(4): 1263-1286. DOI:10.5194/tc-7-1263-2013 |
Garnier BJ, Ohmura A. 1968. A method of calculating the direct shortwave radiation income of slopes. Journal of Applied Meteorology, 7(5): 796-800. DOI:10.1175/1520-0450(1968)007<0796:AMOCTD>2.0.CO;2 |
Gurgiser W, Mölg T, Nicholson L, et al. 2013. Mass-balance model parameter transferability on a tropical glacier. Journal of Glaciology, 59(217): 845-858. DOI:10.3189/2013JoG12J226 |
Hock R, Holmgren B. 2005. A distributed surface energy-balance model for complex topography and its application to storglaciären, Sweden. Journal of Glaciology, 51(172): 25-36. DOI:10.3189/172756505781829566 |
Huintjes E, 2014. Energy and mass balance modelling for glaciers on the Tibetan Plateau: extension, validation and application of a coupled snow and energy balance model. Rwth Aachen: Aachen University.
|
Immerzeel WW, van Beek LPH, Bierkens MFP. 2010. Climate change will affect the Asian water towers. Science, 328(5984): 1382-1385. DOI:10.1126/science.1183188 |
Jiang X, Wang NL, He JQ, et al. 2010. A distributed surface energy and mass balance model and its application to a mountain glacier in China. Chinese Science Bulletin, 55(20): 2079-2087. DOI:10.1007/s11434-010-3068-9 |
Kääb A, Berthier E, Nuth C, et al. 2012. Contrasting patterns of early twenty-first-century glacier mass change in the Himalayas. Nature, 488(7412): 495-498. DOI:10.1038/nature11324 |
Kang SC, Chen F, Gao T, et al. 2009. Early onset of rainy season suppresses glacier melt: a case study on Zhadang glacier, Tibetan Plateau. Journal of Glaciology, 55(192): 755-758. |
Kang SC, Xu YW, You QL, et al. 2010. Review of climate and cryospheric change in the Tibetan Plateau. Environmental Research Letters, 5(1): 015101. DOI:10.1088/1748-9326/5/1/015101 |
Kang XC, Ding LF. 1981. Tianshan and Qilian Mountain glacier mass balance, snow line position and the relationship between weather and climat. Journal of Glaciology and Geocryology, 3(1): 53-56. |
Li CL, Bosch C, Kang SC, et al. 2016. Sources of black carbon to the Himalayan-Tibetan Plateau glaciers. Nature Communications, 7: 12574. DOI:10.1038/ncomms12574 |
Li J, Liu SY, Zhang Y, et al. 2011. Surface energy balance of Keqicar Glacier, Tianshan Mountains, China, during ablation period. Sciences in Cold and Arid Regions, 3(3): 197-205. DOI:10.3724/SP.J.1226.2011.00197 |
Long ZX, Li CY. 1999. Numerical simulation of the ENSO influences on East- Asian monsoon activities afterwards. Acta Meteorologica Sinica, 57(6): 651-661. DOI:10.11676/qxxb1999.063 |
Maussion F, Scherer D, Mölg T, et al. 2014. Precipitation seasonality and variability over the Tibetan Plateau as resolved by the high Asia reanalysis. Journal of Climate, 27(5): 1910-1927. DOI:10.1175/JCLI-D-13-00282.1 |
Mölg T, Maussion F, Yang W, et al. 2012. The footprint of Asian monsoon dynamics in the mass and energy balance of a Tibetan glacier. The Cryosphere Discussions, 6(4): 3243-3286. DOI:10.5194/tc-6-1445-2012 |
Mölg T, Maussion F, Scherer D. 2013. Mid-latitude westerlies as a driver of glacier variability in monsoonal High Asia. Nature Climate Change, 4(1): 68-73. DOI:10.1038/nclimate2055 |
Niu HW, Kang SC, Shi XF, et al. 2017. In-situ measurements of light-absorbing impurities in snow of glacier on Mt. Yulong and implications for radiative forcing estimates. Science of The Total Environment, 581–582: 848-856. DOI:10.1016/j.scitotenv.2017.01.032 |
Oerlemans J. 1991. The mass balance of the Greenland ice sheet: sensitivity to climate change as revealed by energy-balance modelling. The Holocene, 1(1): 40-48. DOI:10.1177/095968369100100106 |
Pu JC, Yao TD, Yang MX, et al. 2008. Rapid decrease of mass balance observed in the Xiao (Lesser) Dongkemadi Glacier, in the central Tibetan Plateau. Hydrological Processes, 22(16): 2953-2958. DOI:10.1002/hyp.6865 |
Qu B, Ming J, Kang SC, et al. 2014. The decreasing albedo of the Zhadang glacier on western Nyainqentanglha and the role of light-absorbing impurities. Atmospheric Chemistry and Physics, 14(20): 11117-11128. DOI:10.5194/acp-14-11117-2014 |
Scherler D, Bookhagen B, Strecker MR. 2011. Spatially variable response of Himalayan glaciers to climate change affected by debris cover. Nature Geoscience, 4(3): 156-159. DOI:10.1038/ngeo1068 |
Sun WJ, Qin X, Ren JR, et al. 2012. The surface energy budget in the accumulation zone of the Laohugou Glacier No. 12 in the western Qilian Mountains, China, in summer 2009. Arctic, Antarctic, and Alpine Research, 44(3): 296-305. DOI:10.1657/1938-4246-44.3.296 |
Sun WJ, Qin X, Du WT, et al. 2014. Ablation modeling and surface energy budget in the ablation zone of Laohugou glacier No. 12, western Qilian Mountains, China. Annals of Glaciology, 55(66): 111-120. DOI:10.3189/2014AoG66A902 |
Wagnon P, Vincent C, Arnaud Y, et al. 2013. Seasonal and annual mass balances of Mera and Pokalde glaciers (Nepal Himalaya) since 2007. The Cryosphere, 7(6): 1769-1786. DOI:10.5194/tc-7-1769-2013 |
Wang NL, He JQ, Pu JC, et al. 2010. Variations in equilibrium line altitude of the Qiyi Glacier, Qilian Mountains, over the past 50 years. Chinese Science Bulletin, 55(33): 3810-3817. DOI:10.1007/s11434-010-4167-3 |
Wang PY, Li ZQ, Li HL, et al. 2016. Analyses of recent observations of Urumqi Glacier No. 1, Chinese Tianshan Mountains. Environmental Earth Sciences, 75(8): 720. DOI:10.1007/s12665-016-5551-3 |
Yang DQ, Ishida S, Goodison BE, et al. 1999. Bias correction of daily precipitation measurements for Greenland. Journal of Geophysical Research, 104(D6): 6171-6181. DOI:10.1029/1998JD200110 |
Yang K, Koike T, Fujita K, et al. 2002. Improvement of surface flux parametrizations with a turbulence-related length. Quarterly Journal of the Royal Meteorological Society, 128(584): 2073-2087. DOI:10.1256/003590002320603548 |
Yang W, Guo XF, Yao TD, et al. 2011. Summertime surface energy budget and ablation modeling in the ablation zone of a maritime Tibetan glacier. Journal of Geophysical Research, 116(D14): D14116. DOI:10.1029/2010JD015183 |
Yang W, Guo XF, Yao TD, et al. 2015. Recent accelerating mass loss of southeast Tibetan glaciers and the relationship with changes in macroscale atmospheric circulations. Climate Dynamics, 47(3–4): 805-815. DOI:10.1007/s00382-015-2872-y |
Yao TD, Ren JR, Xu BQ, 2008. Map of Glaciers and Lakes on the Tibetan Plateau and the Surroundings. Xi'an: Xi'an Cartographic Publishing House.
|
Yao TD, Thompson L, Yang W, et al. 2012. Different glacier status with atmospheric circulations in Tibetan Plateau and surroundings. Nature Climate Change, 2(9): 663-667. DOI:10.1038/nclimate1580 |
Zemp M, Hoelzle M, Haeberli W. 2009. Six decades of glacier mass-balance observations: a review of the worldwide monitoring network. Annals of Glaciology, 50(50): 101-111. DOI:10.3189/172756409787769591 |
Zhang GS, Kang SC, Fujita K, et al. 2013a. Energy and mass balance of Zhadang glacier surface, central Tibetan Plateau. Journal of Glaciology, 59(213): 137-148. DOI:10.3189/2013JoG12J152 |
Zhang GS, Kang SC, Cuo L, et al. 2016. Modeling hydrological process in a glacier basin on the central Tibetan Plateau with a distributed hydrology soil vegetation model. Journal of Geophysical Research, 121(16): 9521-9539. DOI:10.1002/2016JD025434 |
Zhang J, He XB, Ye BS, et al. 2013b. Recent variation of mass balance of the Xiao Dongkemadi Glacier in the Tanggula range and its influencing factors. Journal of Glaciology and Geocryology, 35(2): 263-271. DOI:10.7522/j.issn.1000-0240.2013.0032 |
Zhu ML, Yao TD, Yang W, et al., 2017. Differences in mass balance behavior for three glaciers from different climatic regions on the Tibetan Plateau. Climate Dynamics. DOI: 10.1007/s00382-017-3817-4. (in Press)
|