Observations based on direct measurements and remote-sensing data from satellites and other platforms demonstrate unequivocal climate warming, which will both affect natural environments and human societies (IPCC, 2014). Although climate warming is a global phenomenon, high-latitude regions such as the arctic zone have experienced greater temperature increases compared with other regions (Serreze et al., 2009 ; Screen, 2014); and growing evidence indicates that the warming rate is also amplified by elevation, i.e., high-mountain environments (Mountain Research Initiative EDW Working Group, 2015; Wang et al., 2016 ). Large rivers often originate from high mountainous regions (Viviroli et al., 2011 ). For example, many major rivers in China and Asia originate in the Tibetan Plateau, which is sometimes referred to as "the world's water tower" (Xu et al., 2008 ). The headwaters of this region supply water to nearly one-sixth of the global population (Dong et al., 2016 ). An assessment of the effects of global warming on the hydrological cycle is important not only in terms of water-resources exploitation but also for ecosystems management (Beniston and Stoffel, 2014). However, the effect of climate change on hydrologic process and water balance in high mountainous regions remains uncertain and unclear (Immerzeel et al., 2010 ; Su et al., 2016 ).
High mountainous regions are characterized by harsh natural environmental conditions, which limit the availability of observations used in hydrological studies of these areas (Cuo et al., 2014 ). Furthermore, these regions comprise many different land-cover types with varied hydrological effects. Many field-observations of hydrological processes and water balances in a single underlying surface have been conducted in high mountainous regions, such as forests (He et al., 2012 ), steppes (Negm et al., 2013 ), meadows (He and Richards, 2015), moraines (Langston et al., 2011 ), wetlands (Wang et al., 2012 ), glaciers (Salzmann et al., 2012 ), and shrubs (Li et al., 2008 ). However, although synchronous observations of water balances in different alpine land-cover types could enhance the available knowledge about hydrological processes and runoff contributions in alpine mountainous basins, only a few studies have compared two or more land-use types by elevation and temperature gradients in such regions (Reinfelds et al., 2014 ).
Global warming has expanded the vegetation ranges in cold regions, such as the pan-Arctic (Pearson et al., 2013 ) and Tibetan Plateau (Pang et al., 2016 ), and caused a significantly upward shift in the optimum elevation for plant species in alpine regions (Lenoir et al., 2008 ; Feehan et al., 2009 ; Dolezal et al., 2016 ). These changes in climates and land-cover types are expected to affect runoff generation, water balance, and river discharge. Therefore, in this study, water balance in five different alpine land-cover types along an elevation gradient in a small alpine watershed (Hulu watershed, Qilian Mountains, northeastern Tibetan Plateau) were observed and simulated from October 2008 to September 2014. The main objective of this study was to investigate differences in water balance on five different alpine land-cover types and discuss the possible effects of climate warming on water balance in high mountainous regions.
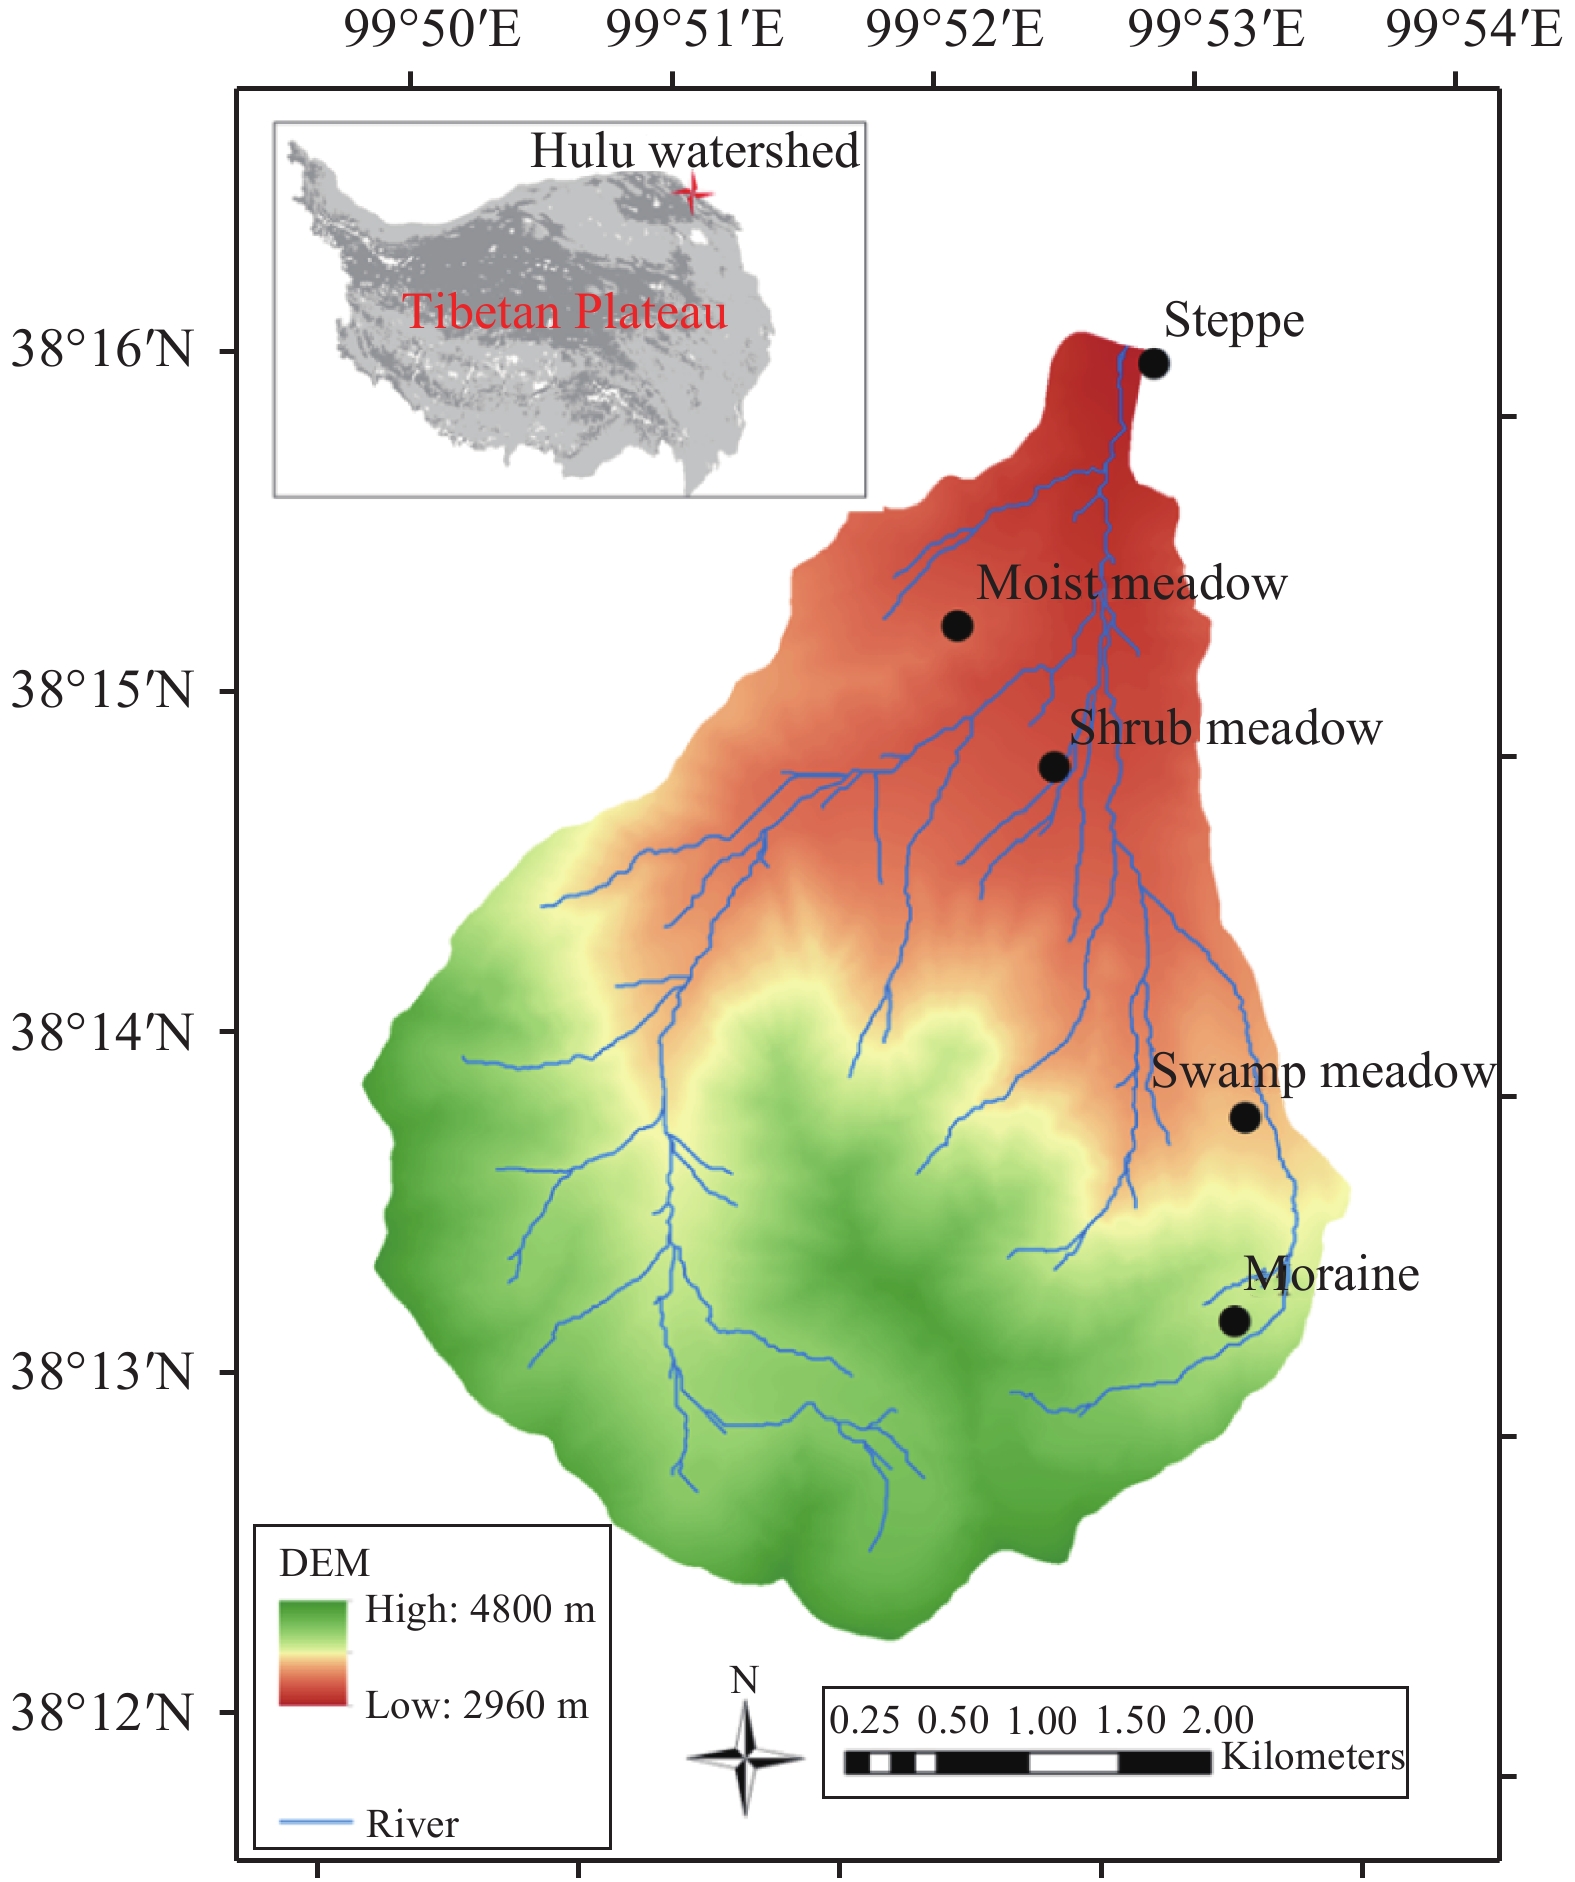
2 Materials and methods 2.1 Field site and dataField observations were made in the Hulu watershed of the Qilian Mountains, northeastern Tibetan Plateau. This watershed ranges from 99°49′E to 99°54′E in longitude and from 38°12′N to 38°17′N in latitude, with an elevation range from 2,960 m to 4,800 m a.s.l. and a drainage area of 23.1 km2 (Figure 1). The watershed area covers about 92% of the altitude range in the upstream section of the Heihe mainstream basin (1,674~5,110 m); and nearly all typical underlying surfaces in high cold regions can be found there, such as glacier, snow, permafrost, seasonal frozen soil, alpine desert, marshy meadow, alpine meadow, alpine shrubs, forest, and alpine grasslands. The alpine desert and alpine meadow are the two largest underlying types in the Hulu watershed (Chen et al., 2014 ). The catchment has a continental semiarid climate characterized by warm, rainy summers and cold, dry winters. From the plain to the high mountains, the mean annual precipitation ranges from 400 to 600 mm, approximately 70% of which occurs from July to September (Ma et al., 2017 ). The annual air temperatures at the different elevation sites are shown in Table 1. A cryosphere–hydrology observation system was established in this small alpine watershed in 2008 (Chen et al., 2014 ).
|
|
Table 1 Information for five research sites |
|
Figure 1 Field sites in the Hulu watershed, Qilian Mountains, northeastern Tibetan Plateau |
To understand the hydrological processes and water balances on the land-cover types, five automatic meteorological towers were installed on five horizontal surfaces, ranging in elevation from about 2,980 m to 4,166 m in the Hulu watershed in August 2008 (Table 1). The lands were covered by steppe, shrub meadow, moist meadow, swamp meadow, and moraine (Figure 1, Table 1). Each tower measures precipitation (P), evapotranspiration (ET, automatic mini-lysimeters), and other meteorological factors, including radiation, two-layer or four-layer air temperature, relative humidity, wind speed/direction, atmospheric pressure, multiple layers of soil-water content and temperature, land-surface temperature, soil-heat fluxes, snow depth, and so on. These towers were not installed during the same year. More information about meteorological tower measurement and meteorological gradients can be found in Chen et al. (2014) . The automatic weighting mini-lysimeters used to measure ET at each tower were installed in September 2013. An eddy-correlation system was also installed at the shrub meadow observation site in September 2011. These automatic data were saved every 30 minutes. In addition, two manual mini-lysimeters were used to measure ET at the steppe site beginning in June 2009. The frozen soil depth was also measured manually at the steppe site beginning in June 2009. Daily data collected during a hydrological year (from October to September) were used for comparisons and simulations in this study. The vegetation height, leaf-area index, and coverage were measured every 15 days. Layered soil properties including soil depth, porosity, dry density, grain size, saturated hydraulic conductivity, field-moisture capacity, wilting coefficient, soil-moisture characteristic curve, and dry-soil thermal conductivity were measured in both the field and laboratory at the time of and after installation of the towers.
2.2 MethodsIn this study, only P and ET were used to compare the water balances of different land-cover types. As the measured ET dataset was small, ET was calculated by simulating the water- and heat-transfer processes in the five different land-cover types using the CoupModel, a one-dimensional numerical model that couples soil, water, and atmosphere processes (Jansson and Moon, 2001; Jansson, 2012) and has been widely applied to research in mountains or other regions worldwide (Okkonen and Kløve, 2011; Scherler et al., 2013 ; Zhou et al., 2013 ; Kalantari et al., 2015 ). A more extensive description and additional information about CoupModel can be found in published papers (Jansson and Moon, 2001; Jansson, 2012). The meteorological force inputs of the model were collected by automatic meteorological towers, and plant and soil inputs were collected from field and laboratory surveys. The model outputs were ET, frozen depth, multi-layered soil temperature (ST), and liquid-water content (SWC), which were used to validate the model and analyse the hydrological processes and water balance at the research site.
The revised Nash–Sutcliffe efficiency coefficient (NSE) (Chen et al., 2008 ) was used to evaluate the validation results:
| $NSE = 1 - \frac{{\sum\nolimits_{i = 1}^n {{{({Q_{io}} - {Q_{ic}})}^2}} }}{{\sum\nolimits_{i = 1}^n {{{({Q_{io}} - {Q_{iom}})}^2}} }}$ | (1) |
where Qio and Qic represent the observed and calculated variables, respectively; and Qiom is the mean observed variables. n is the length of the series. NSE varies from 0 to 1, with a value of 1 indicating perfect agreement and 0 indicating poor agreement.
3 Results 3.1 Model validationAt the steppe site, the measured and simulated daily average multi-layered ST and SWC corresponded very well (120-cm SWC sensor was broken, resulting in missing data, Figure 2). Similar results were obtained for the other four land-cover types (Tables 2 and 3). At all five sites, however, the correlations between the simulated and measured daily SWC values were as strong as those obtained for ST (Tables 2 and 3). The soil-water and heat-coupled processes in frozen soils are very complex; and the soil water in a high mountainous region could be thawed and frozen (Weismüller et al., 2011 ; Zhao et al., 2014 ). Currently, it is difficult to simulate accurately the SWC in frozen soil, partly because the water-flow mechanisms in frozen soil remain unclear and controversial (Drotz et al., 2009 ; Rempel, 2012) and partly because of the high vertical heterogeneity of soil properties (Li et al., 2010 ; Garrigues et al., 2015 ). As shown in Figure 2, as well as in Tables 2 and 3, the NSE value was lower at the swamp-meadow site than at the other sites. Although this observation site is horizontal, the surrounding terrain is gently sloped. Therefore, water often flows around this site, which imports some lateral flows of water and heat, and influences the fitting of measured and simulated ST and SWC values.

|
Figure 2 Measured and simulated daily average soil temperature (ST) and soil liquid-water content (SWC) at the steppe site |
|
|
Table 2 NSE of the measured and simulated daily mean ST of five research sites |
|
|
Table 3 NSE of the measured and simulated daily mean SWC of five research sites |
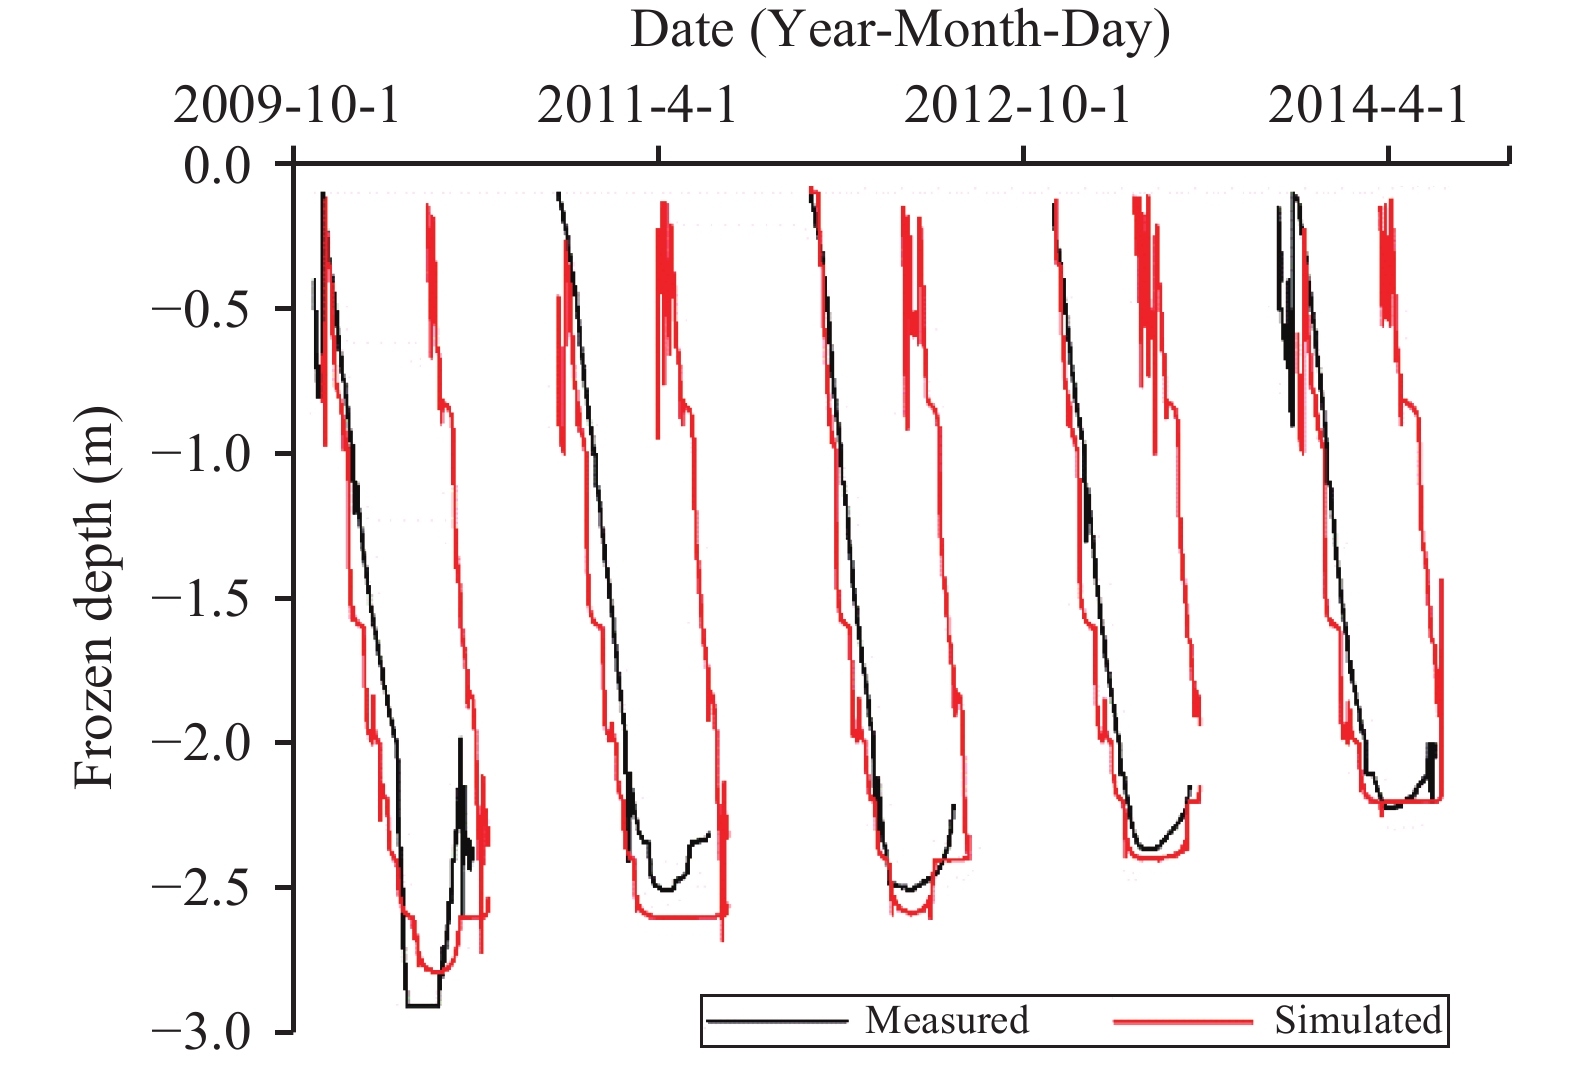
The frozen depth was measured daily and manually at the steppe site from June 2009 but was not measured at the four other sites, which were located in extremely harsh environments of the high mountainous region. The soil frozen-depth measurements were also used to validate the CoupModel at the steppe site, and the results indicated that the model provided a good simulation of frozen depth (NSE = 0.89, Figure 3).
|
Figure 3 Measured and simulated frozen-soil depths at the steppe site |
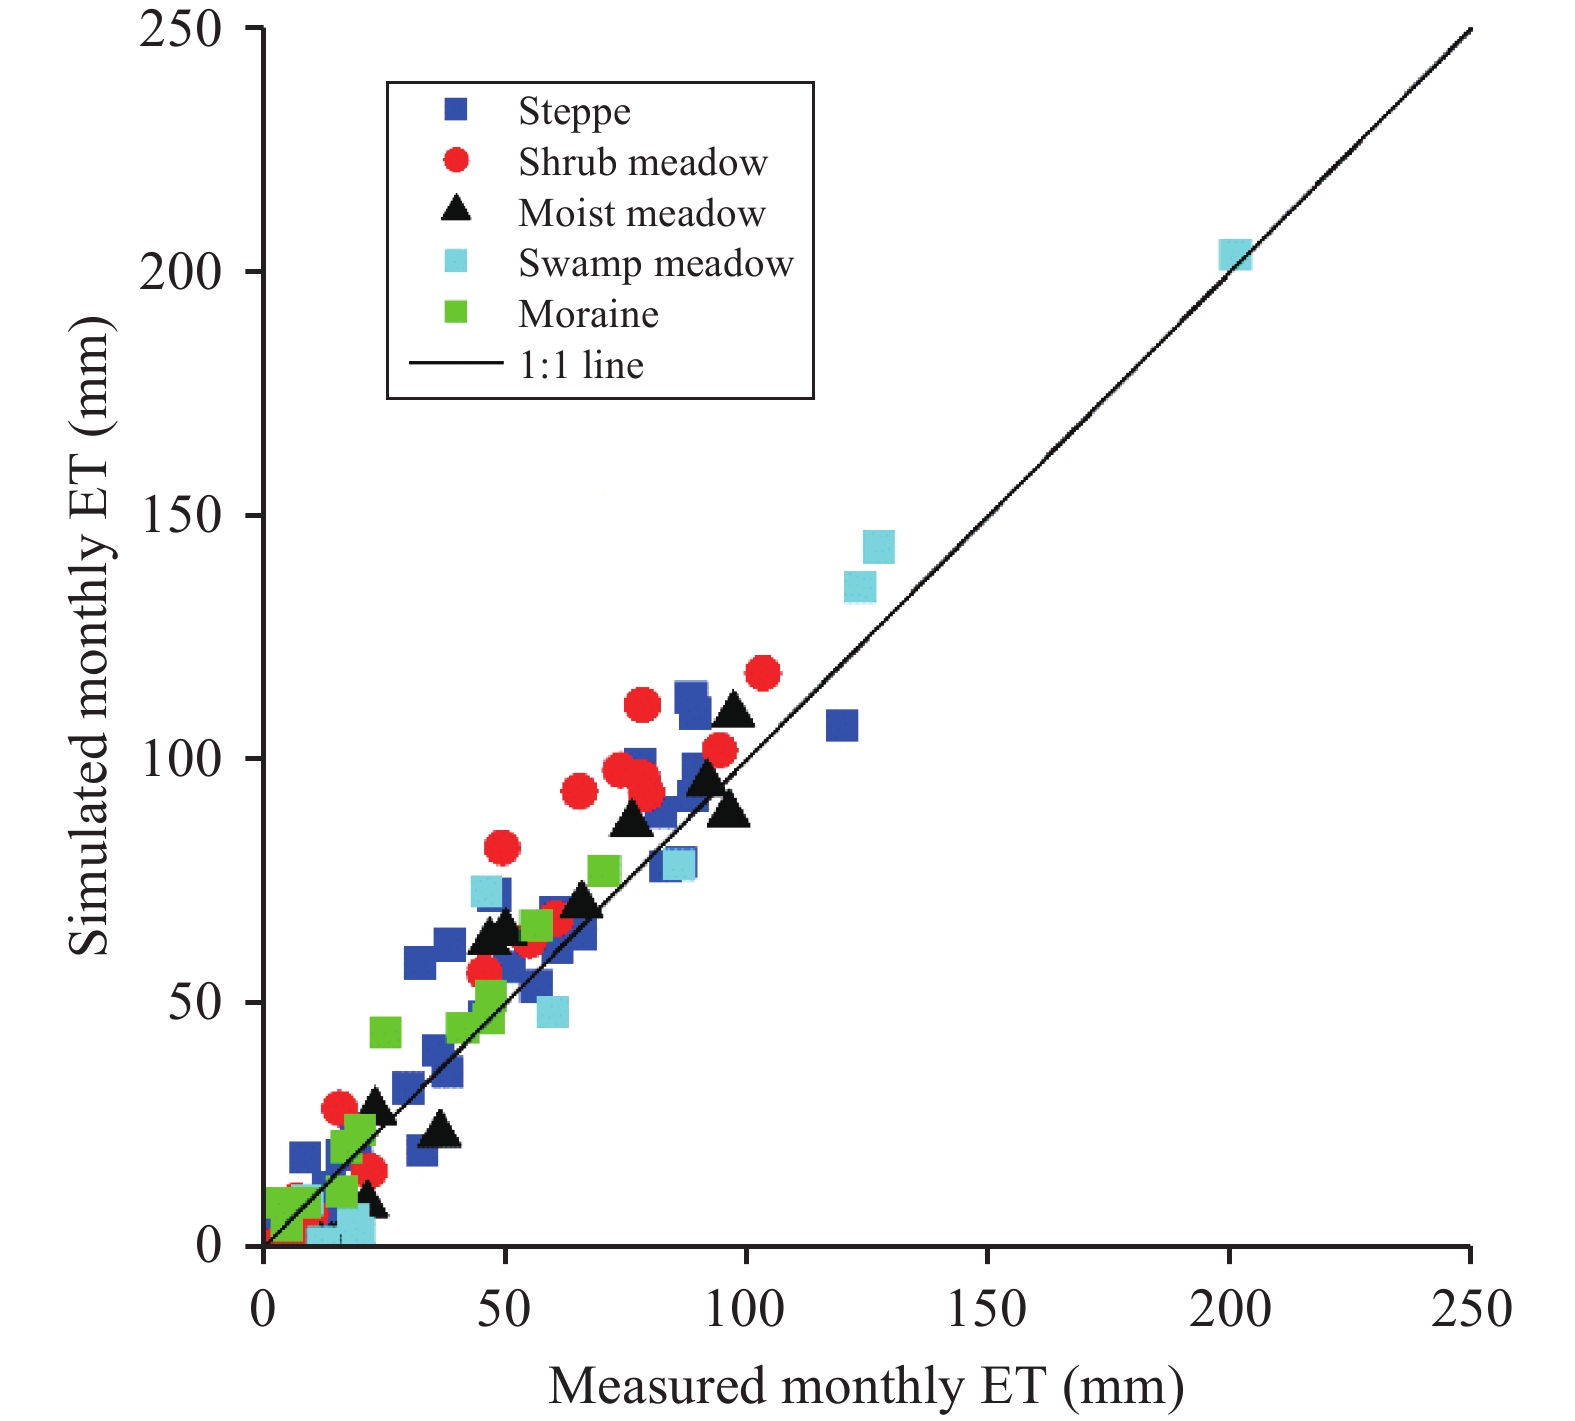
ET, an integral part of the water cycle in a cold high mountain environment, is one of the most uncertain terms in the land-surface model simulations of surface-water balance (Garrigues et al., 2015 ). However, variations in the simulated daily ET values were similar to those of the actual measured values (Figure 4). Besides validation using mini-lysimeter data, data from the eddy-correlation system at the shrub meadow site exhibited relatively good fitting relationships with the simulated ET values in 2013 (Figure 4). The monthly measured and simulated ET values were similar (Figure 5), with NSE values of 0.94, 0.88, 0.91, 0.95, and 0.91 for the steppe, shrub meadow, moist meadow, swamp meadow and moraine sites, respectively. Validation of multi-layered SWC and ST, frozen depth, and ET values indicated that the CoupModel outputs were somewhat reliable and suggested that the use of model outputs to analyse the water balance at research sites would be reasonable.

|
Figure 4 Measured and simulated daily evapotranspiration (ET) at the five research sites |
|
Figure 5 Measured and simulated monthly evapotranspiration (ET) at the five research sites |
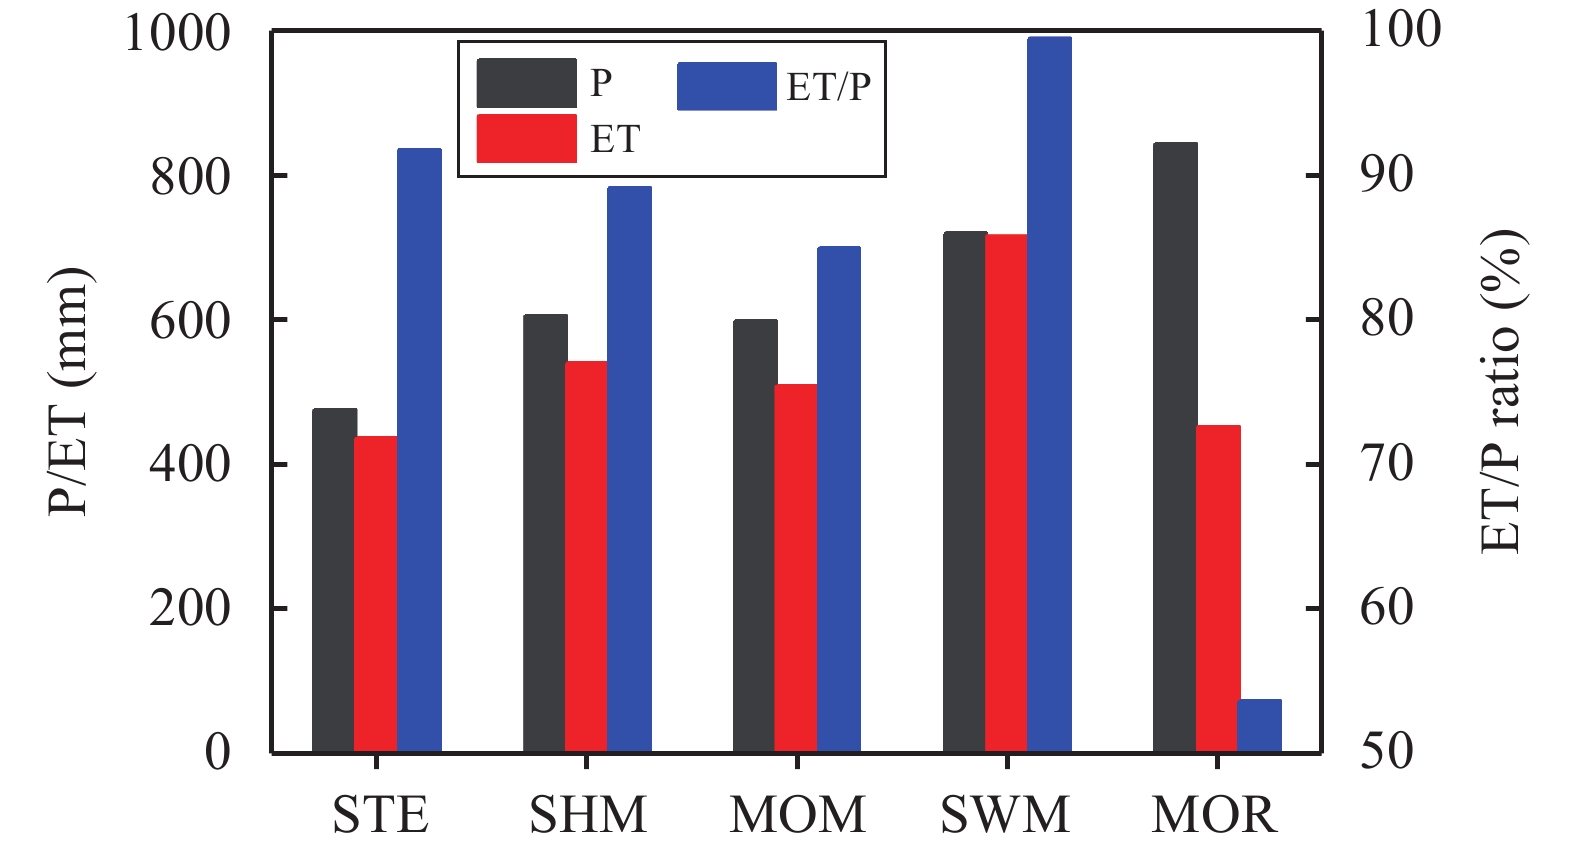
The annual average P of the five land-cover types ranged from 475.9 mm to 843.3 mm during the hydrological years of 2012 to 2014 (Figure 6). Generally, the annual P increased as elevation increased, with small exceptions for the shrub and moist meadow sites, due to the complex topography of alpine regions (Chen et al., 2014 ).
|
Figure 6 Annual precipitation (P) and evapotranspiration (ET) at the five research sites (STE: steppe; SHM: shrub meadow; MOM: moist meadow; SWM: swamp meadow; MOR: moraine) |
Because only small amounts of measured ET data were obtained during different observation periods, CoupModel outputs were used to analyse the differences in ET values of the five land-cover types. Notably, the elevation-gradient effect on ET differed from the effect on P. The annual average ET values were 437.1 mm, 540.8 mm, 509.7 mm, 717.1 mm, and 452.6 mm at the steppe, shrub meadow, moist meadow, swamp meadow and moraine land sites, respectively, during the hydrological years of 2012 to 2014 (Figure 6). Excluding the steppe site, the ETs from the remaining three land-cover types with plant coverage were obviously greater than that from the moraine land-cover type, which had the highest elevation and no plants.
As ET is a dominant component of the water cycle (Shi et al., 2013 ), the ratio of ET to P (ET/P) is an important parameter used to describe the water budget (Li et al., 2013 ). In this study, the ET/P ratio varied among the land-cover types (Figure 6), with annual values of 91.8%, 89.2%, 85.0%, 99.5%, and 53.7% at the steppe, shrub meadow, moist meadow, swamp meadow and moraine land sites, respectively. The ET/P ratio at the moraine land surface was distinctly smaller than those at the four surfaces with plant coverage, among which the ratios did not differ noticeably.
4 Discussion 4.1 Difference in water balance of the five land-cover typesAt the steppe site, most P is consumed by ET, with an annual ET/P ratio of 91.8%. Here, the annual evaporation capacity (measured using a Chinese standard evaporation pan with a 20-cm diameter) during the hydrological years of 2012~2014 was approximately 1,093.2 mm. This result indicates that ET is limited by the water supply, and little runoff is generated on this type of land surface.
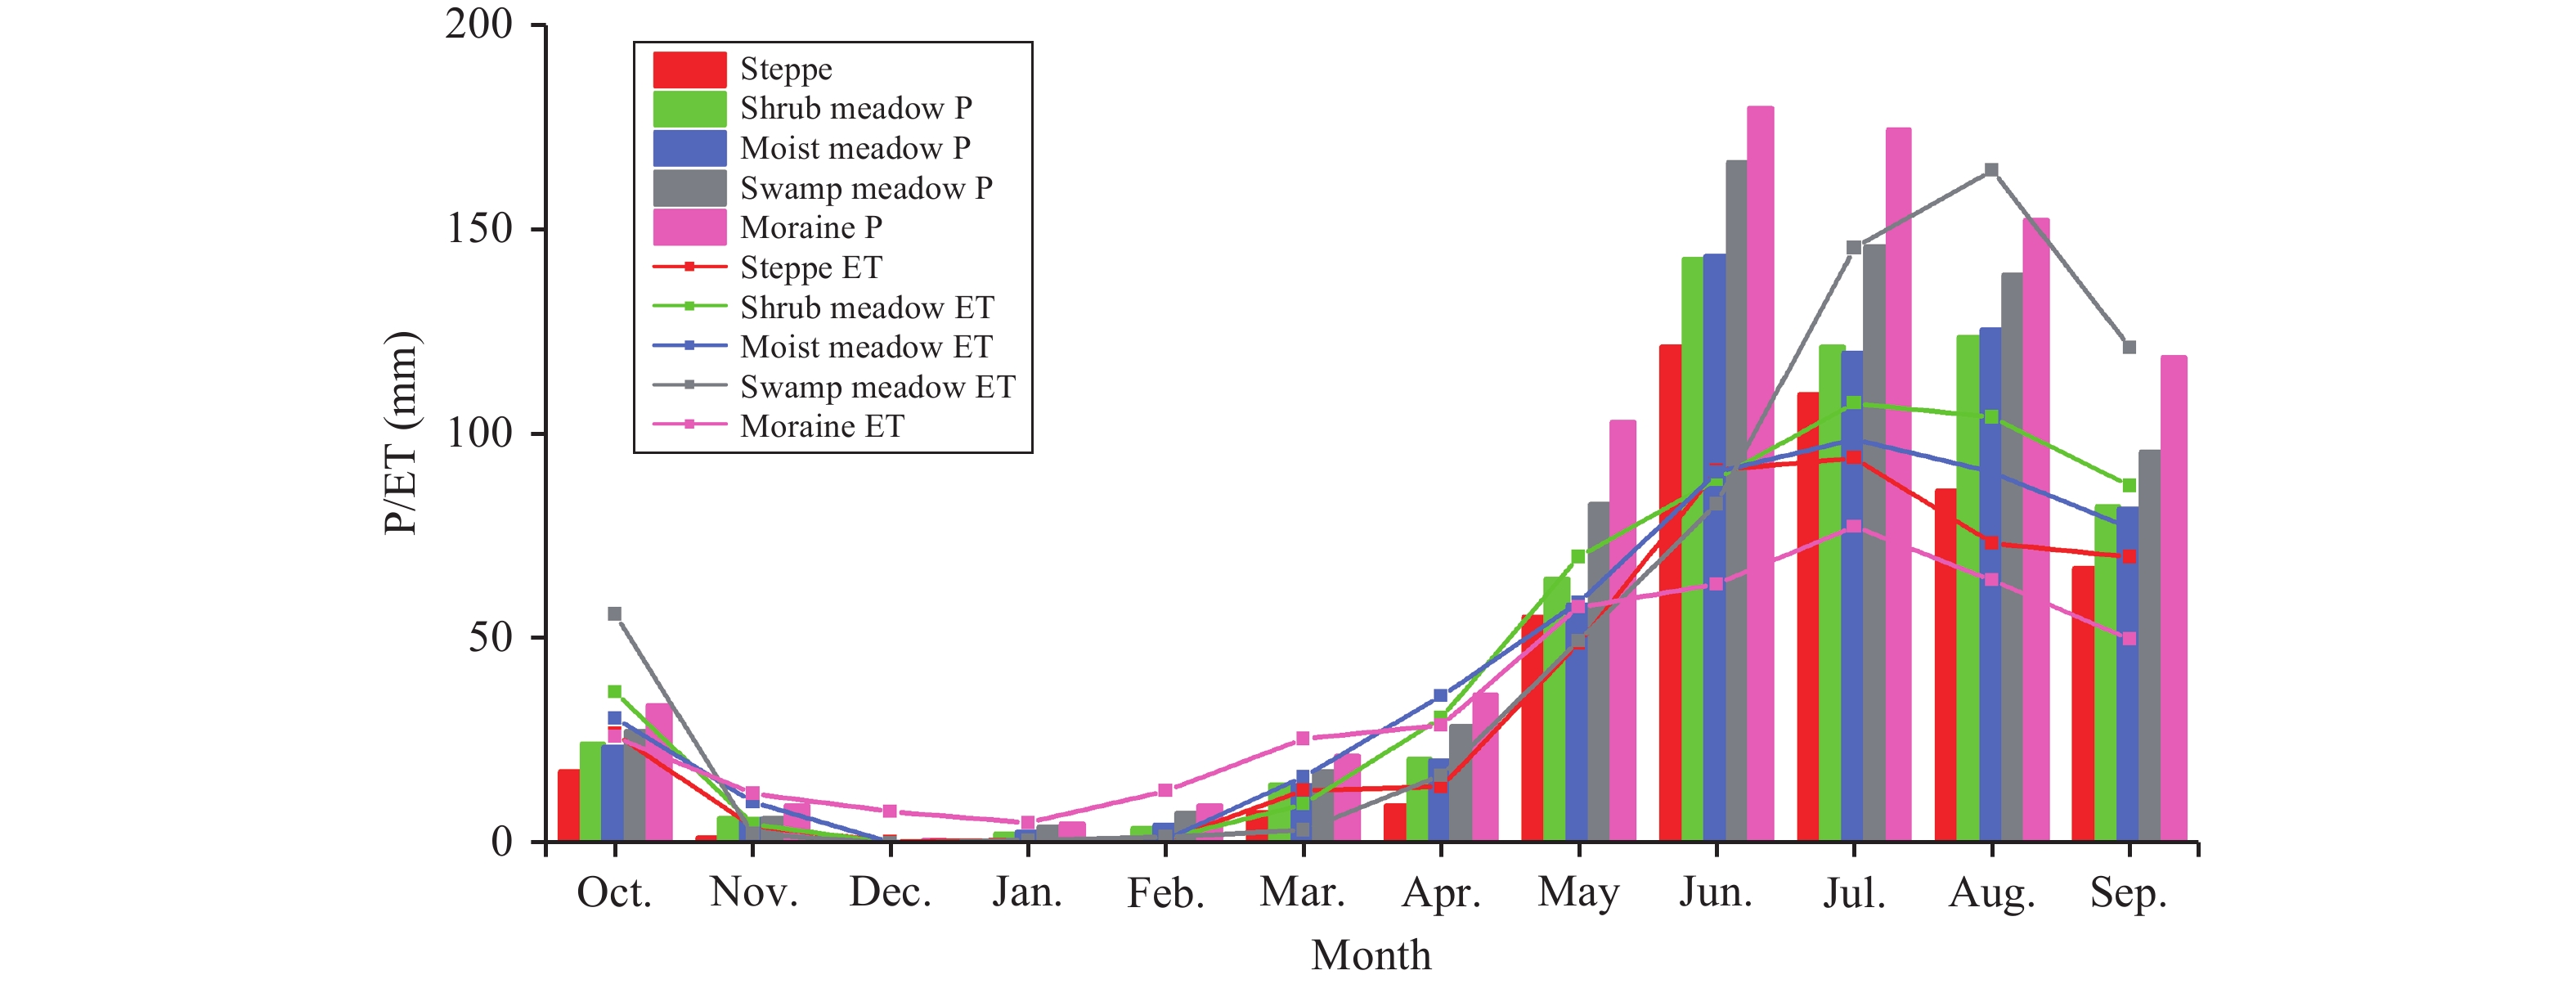
Li et al. (2013) also reported high ET/P ratios of 98% for a typical steppe and 104% for an alpine steppe on the Tibetan Plateau. In contrast, at the moraine site, approximately half of P is consumed by ET because of the high soil-infiltration ability, sparse vegetation coverage, and relatively low evaporation capacity of this surface type. Accordingly, the widely covered moraine generates the largest amount of runoff in the high mountainous region. Reinfelds et al. (2014) reported that catchment elevation served as a primary controller of the annual P, runoff depth, runoff coefficients, and ET in the Snowy Mountains of Australia. In the current study, the swamp meadow site served as an exception, with a large ET that was similar to P because of sufficient water supply for the former (Figure 6). During several months (e.g., August, September and October), ET at the swamp meadow site was even much larger than P, a phenomenon that was rarely observed at other sites. As described above, this site received some water from uphill regions. Li et al. (2013) reported an annual ET/P ratio of approximately 127% for an alpine wetland meadow on the Tibetan Plateau with nearly continuous ponding conditions. At the swamp meadow site, however, stagnant water may disappear during several months (e.g., May, June and September).
4.2 Influences of climate change on water balances in mountainous regionsP, ET, and runoff are the major water-cycle components located at or near land-cover types. Using a traditional water-balance approach, runoff in long-term, large-scale regions can be estimated as P minus ET (Senay et al., 2011 ; Yin et al., 2013 ). Under the influence of global warming, however, changes in P on the Tibetan Plateau, which are mainly controlled by the Indian monsoon, East Asian monsoon, and the westerlies (Mölg et al., 2013 ; Kuang and Jiao, 2016), are far less uniform than changes in temperature; and seasonal and spatial variability in P, as well as contributions to discharge, remain highly uncertain and poorly understood (Bolch et al., 2012 ; Dong et al., 2016 ). Global warming was associated with a significant upward shift in the optimum elevation for plant species in alpine regions during the 20th century (Lenoir et al., 2008 ; Feehan et al., 2009 ; Dolezal et al., 2016 ). The expansion of alpine steppes and shrubs, and the decrease in alpine meadows on the Tibetan Plateau have been accompanied by an increase in plant coverage toward the high-elevation moraine region (Wang et al., 2010 ; Zhao et al., 2011 ; Shen et al., 2015 ; Gao et al., 2016 ). In this study, the ET/P ratios of the alpine steppes and shrubs were larger than that of the alpine meadow; and those of the plant-covered regions were much larger than that of the moraine region (Figure 7). Although climate warming has led to complex and uncertain changes in P on the Tibetan Plateau, the plant-coverage shift in the high mountainous region would increase the ET value and ET/P ratio, indicating a decrease in the runoff coefficient in an alpine basin.
|
Figure 7 Mean monthly precipitation (P) and evapotranspiration (ET) at the five research sites from October 2012 to September 2014 |
In this study, five land-cover types (steppe, shrub meadow, moist meadow, swamp meadow, and moraine) in the Qilian Mountains, northeastern Tibetan Plateau, were selected for an analysis of water balances in different land-cover types. Continuous field measurements showed that the annual P normally increased as the elevation increased, whereas the ET/P ratio varied with the underlying surface. In plant-covered areas, most of the P was consumed by ET. In contrast, the moraine area had a high P and low ET/P ratio and thus served as the main runoff-generating area in the high mountainous region.
Global warming would change the plant coverage and water balance in high mountainous regions. The upward shift in the optimum elevation of plant species at high elevation suggests that climate warming may increase not only ET but also the ET/P ratio. These factors are likely to lead to decreases in the runoff coefficients in alpine basins.
Acknowledgments:This work was carried out with financial support from the National Natural Sciences Foundation of China (41401041) and the National Basic Research Program of China (2013CBA01806).
Beniston M, Stoffel M. 2014. Assessing the impacts of climatic change on mountain water resources. Sci Total Environ, 493: 1129-1137. DOI:10.1016/j.scitotenv.2013.11.122 |
Bolch T, Kulkarni A, Kääb A, et al. 2012. The state and fate of Himalayan Glaciers. Science, 336(6079): 310-314. DOI:10.1126/science.1215828 |
Chen R, Kang E, Lu S, et al. 2008. A distributed water-heat coupled model for mountainous watershed of an inland river basin in Northwest China (II) using meteorological and hydrological data. Environmental Geology, 55(1): 17-28. DOI:10.1007/s00254-007-0960-y |
Chen RS, Song YX, Kang ES, et al. 2014. A cryosphere-hydrology observation system in a small Alpine Watershed in the Qilian Mountains of China and its meteorological gradient. Arctic, Antarctic, and Alpine Research, 46(2): 505-523. DOI:10.1657/1938-4246-46.2.505 |
Cuo L, Zhang Y, Zhu F, et al. 2014. Characteristics and changes of streamflow on the Tibetan Plateau: A review. Journal of Hydrology: Regional Studies, 2: 49-68. DOI:10.1016/j.ejrh.2014.08.004 |
Dolezal J, Dvorsky M, Kopecky M, et al. 2016. Vegetation dynamics at the upper elevational limit of vascular plants in Himalaya. Scientific Report, 6: 24881. DOI:10.1038/srep24881 |
Dong W, Lin Y, Wright JS, et al. 2016. Summer rainfall over the southwestern Tibetan Plateau controlled by deep convection over the Indian subcontinent. Nat Commun, 7: 10925. DOI:10.1038/ncomms10925 |
Drotz SH, Tilston EL, Sparrman T, et al. 2009. Contributions of matric and osmotic potentials to the unfrozen water content of frozen soils. Geoderma, 148(3–4): 392-398. DOI:10.1016/j.geoderma.2008.11.007 |
Feehan J, Harley M, Minnen J. 2009. Climate change in Europe. 1. Impact on terrestrial ecosystems and biodiversity. A review. Agronomy for Sustainable Development, 29: 409-421. DOI:10.1051/agro:2008066 |
Gao Q, Guo Y, Xu H, et al. 2016. Climate change and its impacts on vegetation distribution and net primary productivity of the alpine ecosystem in the Qinghai-Tibetan Plateau. Sci Total Environ, 554-555: 34-41. DOI:10.1016/j.scitotenv.2016.02.131 |
Garrigues S, Olioso A, Calvet JC, et al. 2015. Evaluation of land surface model simulations of evapotranspiration over a 12-year crop succession: impact of soil hydraulic and vegetation properties. Hydrology and Earth System Sciences, 19(7): 3109-3131. DOI:10.5194/hess-19-3109-2015 |
He S, Richards K. 2015. Impact of Meadow Degradation on Soil Water Status and Pasture Management–A Case Study in Tibet. Land Degradation & Development, 26(5): 468-479. DOI:10.1002/ldr.2358 |
He Z, Zhao W, Liu H, et al. 2012. Effect of forest on annual water yield in the mountains of an arid inland river basin: a case study in the Pailugou catchment on northwestern China's Qilian Mountains. Hydrological Processes, 26(4): 613-621. DOI:10.1002/hyp.8162 |
Immerzeel WW, Beek LPH, Bierkens MFP. 2010. Climate change will affect the Asian Water Towers. Science, 328(5984): 1382-1385. DOI:10.1126/science.1183188 |
IPCC, 2014. Climate Change 2014: Impacts, Adaptation, and Vulnerability. Part A: Global and Sectoral Aspects. Contribution of Working Group II to the Fifth Assessment Report of the Intergovernmental Panel on Climate Change. In: Field CB, Barros VR, Dokken DJ, et al. (eds.). Cambridge University Press, Cambridge, United Kingdom and New York, NY, USA, pp.1132.
|
Jansson PE. 2012. Coupmodel: model use, calibration, and validation. Transactions of the ASABE, 55(4): 1335-1344. |
Jansson PE, Moon DS. 2001. A coupled model of water, heat and mass transfer using object orientation to improve flexibility and functionality. Environmental Modelling & Software, 16: 37-46. |
Kalantari Z, Lyon SW, Jansson PE, et al. 2015. Modeller subjectivity and calibration impacts on hydrological model applications: an event-based comparison for a road-adjacent catchment in south-east Norway. Science of the Total Environment, 502: 315-329. DOI:10.1016/j.scitotenv.2014.09.030 |
Kuang X, Jiao JJ. 2016. Review on climate change on the Tibetan Plateau during the last half century. Journal of Geophysical Research: Atmospheres, 121: 3979-4007. DOI:10.1002/2015JD024728 |
Langston G, Bentley LR, Hayashi M, et al. 2011. Internal structure and hydrological functions of an alpine proglacial moraine. Hydrological Processes, 25: 2967-2982. DOI:10.1002/hyp.8144 |
Lenoir J, Gégout JC, Marquet PA, et al. 2008. A significant upward shift in plant species optimum elevation during the 20th century. Science, 320(5884): 1768-1771. DOI:10.1126/science.1156831 |
Li J, Jiang S, Wang B, et al. 2013. Evapotranspiration and its energy exchange in Alpine meadow ecosystem on the Qinghai-Tibetan Plateau. Journal of Integrative Agriculture, 12(8): 1396-1401. DOI:10.1016/s2095-3119(13)60546-8 |
Li Q, Sun S, Xue Y. 2010. Analyses and development of a hierarchy of frozen soil models for cold region study. Journal of Geophysical Research, 115: D03107. DOI:10.1029/2009jd012530 |
Li XY, Liu LY, Gao SY, et al. 2008. Stemflow in three shrubs and its effect on soil water enhancement in semiarid loess region of China. Agricultural and Forest Meteorology, 148(10): 1501-1507. DOI:10.1016/j.agrformet.2008.05.003 |
Ma R, Sun Z, Hu Y, et al. 2017. Hydrological connectivity from glaciers to rivers in the Qinghai-Tibet Plateau: roles of suprapermafrost and subpermafrost groundwater. Hydrology and Earth System Sciences, 21: 4803-4823. DOI:10.5194/hess-21-4803-2017 |
Mountain Research Initiative EDW Working Group. 2015. Elevation-dependent warming in mountain regions of the world. Nature Climate Change, 5(5): 424-430. DOI:10.1038/nclimate2563 |
Mölg T, Maussion F, Scherer D. 2013. Mid-latitude westerlies as a driver of glacier variability in monsoonal High Asia. Nature Climate Change, 4(1): 68-73. DOI:10.1038/nclimate2055 |
Negm A, Falocchi M, Barontini S, et al. 2013. Assessment of the water balance in an Alpine climate: Setup of a micrometeorological station and preliminary results. Procedia Environmental Sciences, 19: 275-284. DOI:10.1016/j.proenv.2013.06.032 |
Okkonen J, Kløve B. 2011. A sequential modelling approach to assess groundwater-surface water resources in a snow dominated region of Finland. Journal of Hydrology, 411(1–2): 91-107. DOI:10.1016/j.jhydrol.2011.09.038 |
Pang G, Wang X, Yang M. 2016. Using the NDVI to identify variations in, and responses of, vegetation to climate change on the Tibetan Plateau from 1982 to 2012. Quaternary International, 444: 87-96. DOI:10.1016/j.quaint.2016.08.038 |
Pearson RG, Phillips SJ, Loranty MM, et al. 2013. Shifts in Arctic vegetation and associated feedbacks under climate change. Nature Climate Change, 3(7): 673-677. DOI:10.1038/nclimate1858 |
Reinfelds I, Swanson E, Cohen T, et al. 2014. Hydrospatial assessment of streamflow yields and effects of climate change: Snowy Mountains, Australia. Journal of Hydrology, 512: 206-220. DOI:10.1016/j.jhydrol.2014.02.038 |
Rempel AW. 2012. Hydromechanical processes in freezing soils. Vadose Zone Journal, 11: 4. DOI:10.2136/vzj2012.0045 |
Salzmann N, Machguth H, Linsbauer A. 2012. The Swiss Alpine glaciers' response to the global '2?°C air temperature target'.. Environmental Research Letters, 7(4): 044001. DOI:10.1088/1748-9326/7/4/044001 |
Scherler M, Hauck C, Hoelzle M, et al. 2013. Modeled sensitivity of two alpine permafrost sites to RCM-based climate scenarios. Journal of Geophysical Research: Earth Surface, 118(2): 780-794. DOI:10.1002/jgrf.20069 |
Screen JA. 2014. Arctic amplification decreases temperature variance in northern mid- to high-latitudes. Nature Climate Change, 4(7): 577-582. DOI:10.1038/nclimate2268 |
Senay GB, Leake S, Nagler PL, et al. 2011. Estimating basin scale evapotranspiration (ET) by water balance and remote sensing methods. Hydrological Processes, 25(26): 4037-4049. DOI:10.1002/hyp.8379 |
Serreze MC, Barrett AP, Stroeve JC, et al. 2009. The emergence of surface-based Arctic amplification. The Cryosphere, 3: 11-19. DOI:10.5194/tc-3-11-2009 |
Shen W, Zou C, Liu D, et al. 2015. Climate-forced ecological changes over the Tibetan Plateau. Cold Regions Science and Technology, 114: 27-35. DOI:10.1016/j.coldregions.2015.02.011 |
Shi X, Mao J, Thornton PE, et al. 2013. Spatiotemporal patterns of evapotranspiration in response to multiple environmental factors simulated by the Community Land Model. Environmental Research Letters, 8(2): 024012. DOI:10.1088/1748-9326/8/2/024012 |
Su F, Zhang L, Ou T, et al. 2016. Hydrological response to future climate changes for the major upstream river basins in the Tibetan Plateau. Global and Planetary Change, 136: 82-95. DOI:10.1016/j.gloplacha.2015.10.012 |
Viviroli D, Archer D, Buytaert W, et al. 2011. Climate change and mountain water resources: overview and recommendations for research, management and policy. Hydrology and Earth System Sciences, 15(2): 471-504. DOI:10.5194/hess-15-471-2011 |
Wang G, Bai W, Li N, et al. 2010. Climate changes and its impact on tundra ecosystem in Qinghai-Tibet Plateau, China. Climatic Change, 106(3): 463-482. DOI:10.1007/s10584-010-9952-0 |
Wang Q, Fan X, Wang M. 2016. Evidence of high-elevation amplification versus Arctic amplification. Scientific Reports, 6: 19219. DOI:10.1038/srep19219 |
Wang YL, Wang X, Zheng QY, et al. 2012. A comparative study on hourly real evapotranspiration and potential evapotranspiration during different vegetation growth stages in the Zoige Wetland. Procedia Environmental Sciences, 13: 1585-1594. DOI:10.1016/j.proenv.2012.01.150 |
Weismüller J, Wollschläger U, Boike J, et al. 2011. Modeling the thermal dynamics of the active layer at two contrasting permafrost sites on Svalbard and on the Tibetan Plateau. The Cryosphere, 5(3): 741-757. DOI:10.5194/tc-5-741-2011 |
Xu X, Lu C, Shi X, et al. 2008. World water tower: An atmospheric perspective. Geophysical Research Letters, 35(20): L20815. DOI:10.1029/2008gl035867 |
Yin Y, Wu S, Zhao D. 2013. Past and future spatiotemporal changes in evapotranspiration and effective moisture on the Tibetan Plateau. Journal of Geophysical Research: Atmospheres, 118(19): 10850-10860. DOI:10.1002/jgrd.50858 |
Zhao D, Wu S, Yin Y, et al. 2011. Vegetation distribution on Tibetan Plateau under climate change scenario. Regional Environmental Change, 11(4): 905-915. DOI:10.1007/s10113-011-0228-7 |
Zhao Y, Yu B, Yu G, et al. 2014. Study on the water-heat coupled phenomena in thawing frozen soil around a buried oil pipeline. Applied Thermal Engineering, 73(2): 1477-1488. DOI:10.1016/j.applthermaleng.2014.06.017 |
Zhou J, Kinzelbach W, Cheng G, et al. 2013. Monitoring and modeling the influence of snow pack and organic soil on a permafrost active layer, Qinghai-Tibetan Plateau of China. Cold Regions Science and Technology, 90–91: 38-52. DOI:10.1016/j.coldregions.2013.03.003 |
 2017, Vol. 9
