2. Xuzhou Urban Rail Transit Co. Ltd., Xuzhou, Jiangsu 221000, China
More than 20% of the land in China contains permafrost, and 70% of this permafrost with a mean annual ground temperature ranging from −3.5 °C to 0 °C is located on the Qinghai–Tibet Plateau (Jin et al., 2000 ). In addition, the potential warming associated with climate change and disturbances from ongoing infrastructure construction, such as the Qinghai–Tibet Railway, the Qinghai–Kangding Highway, and the oil-product pipeline from Golmud to Lhasa, have further contributed to the increase in the temperature of this permafrost, causing its present temperature to be closer to 0 °C (Ma et al., 2011 ; Zhang et al., 2012 ; Zhao et al., 2017 ). The frozen soils with a temperature close to 0 °C present a low strength and a large deformation; and they easily form thawed soils when the temperature increase continues, thus producing the unavoidable engineering or geological disasters, as shown in Figure 1.

|
Figure 1 Reported engineering disasters on the Qinghai–Tibet Plateau |
The accurate recognition of the shear strength and its behaviors is essentially significant for the reasonable design and safety assessment of foundations in the permafrost region, and it therefore attracted extensive attention of researchers and technicians. Chang et al. (1995) performed a series of tests on the reconstituted and undisturbed frozen sands, and they found the strength of undisturbed and reconstituted frozen sand was almost identical when the temperature was lower than −4 °C. Further, with the increasing of strain rate, the strength was enhanced and the brittle failure behaviors became relatively noticeable. Lai et al. (2009) carried out triaxial tests for frozen sand with a moisture content ranging from 30% to 80% under a temperature of −0.5 °C, −1 °C, and −2 °C, respectively. The results indicated that the deviator stress increased with the increasing of moisture content under a temperature of −0.5 °C, and it showed an increasing followed by a decreasing trend under a temperature of −1 °C. Besides, the confining pressure affected the strength little when the temperature was higher than −2 °C.
The test result on saline-frozen sand from Hu and Lai (2014) showed that strength increased with the increasing of the confining pressure, and it decreased with the increasing of the confining pressures, due to the ice-melting phenomenon. Ma (2006) performed the testing on frozen clay with a temperature ranging from −0.3 °C to −1.5 °C under a water content of 40%, 60%, 90%, and 120%. It was observed that the stress–strain curve presented strain-hardening characteristics, and the failure behavior exhibited plastic characteristics. Also, the strength increased as the temperature decreased to −0.9 °C. When the temperature was higher than −0.6 °C, the strength increased with the increase of water content. Huo et al. (2010) observed from the triaxial test results for frozen clay under a temperature of −0.5 °C, −1 °C, and −2 °C, with a respective water content of 30%, 50%, and 80%, that strength was independent of the confining pressure but significantly dependent on the water content. Specially, when the temperature was lower than −1 °C, the strength decreased as the initial water content increased, whereas it increased as the water content increased when the temperature was warmer than −1 °C. The test results from Cao (2015) showed that the strength declined as the water content increased. Du et al. (2014) performed tests on frozen silty sand under a temperature of −0.5 °C, −1 °C, −1.5 °C, and −2 °C with a strain rate ranging from 0.625 mm/min to 8.0 mm/min. The initial ice content ranged from 30% to 300%. The results showed that the uniaxial strength increased nonlinearly with the increasing of strain rate and initial ice content. Li and Zhang (2014) studied the effects of temperature and confining pressure to the deformation behaviors of expansive clay. The stress–strain of frozen expansive clay presented strain-hardening properties; both yield stress and failure stress were dependent on the negative temperatures. However, most existing studies were based on reconstituted, artificially frozen soil samples, which do not necessarily represent field conditions (Watson et al., 1973 ; Radd and Wolfe, 1979; Yang et al., 2015 ).
To quantitatively evaluate the strength of undisturbed, naturally frozen soils for design of foundations embedded in frozen soils, specimens—including reconstituted frozen and permafrost soils—were tested at temperatures near 0 °C. The strength and the affecting factors are discussed.
2 Testing apparatus and test method 2.1 Testing apparatusThe testing apparatus (Figure 1) designed exclusively for warm frozen soils was introduced in a previous publication (Zhao et al., 2017 ), so the details are not documented in the present study. It should be pointed out that the tests performed by Zhao et al. (2017) were under uniaxial compression, but the present study used triaxial compression. For reducing the heat exchange between the frozen-soil specimen and the surrounding environment, the air was used to apply the confinement because of its low thermal conductivity. The air pressure was controlled by an air pump and a pressure controller. The maximum confining pressure was 300 kPa, with a fluctuation of less than ±1 kPa.
The temperature in and around the frozen-soil specimen was achieved through two separate baths and an incubator, respectively. The top and bottom refrigeration plates were connected with two baths. For monitoring the temperatures during testing, three thermistors (1, 2, 3) were placed at a specimen-section height of 2 cm, 6 cm, and 10.5 cm, respectively, the embedded depth was 3.09 cm. In addition, for checking of temperature uniformity along the specimen radius, three thermistors (4, 5, 6) were placed on the surface of specimen at a specimen-section height of 2 cm, 6 cm, and 10.5 cm.

|
Figure 2 Testing apparatus (Zhao et al., 2017 ) and air-pressure equipment |
|
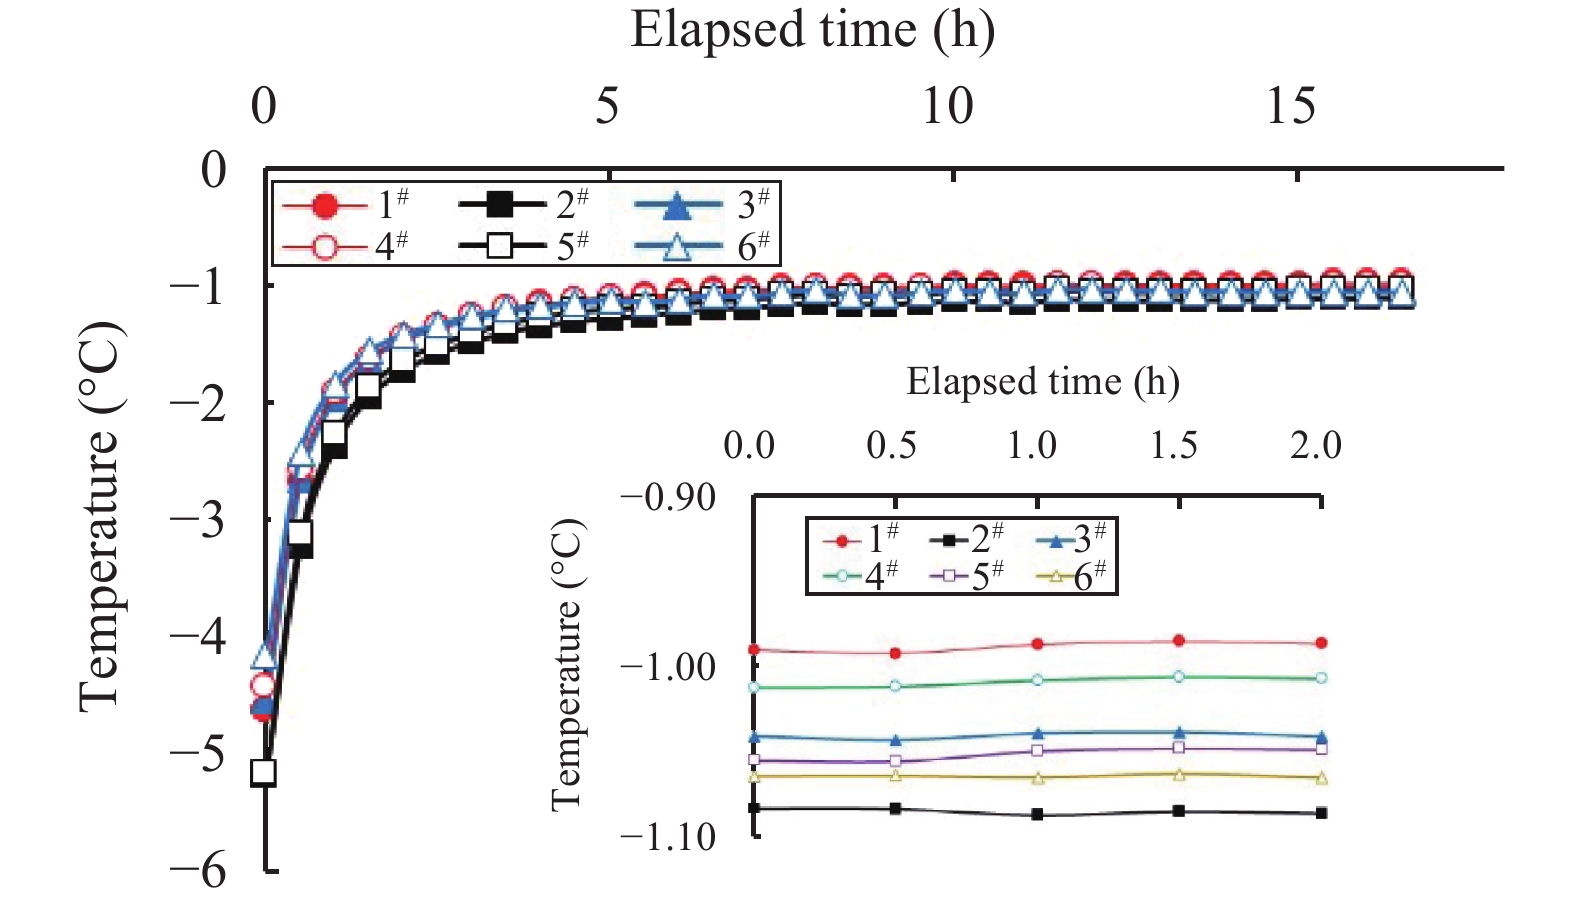
Figure 3 Measured temperatures |
Figure 3 shows the measured temperature during the test. It can be seen from Figure 3 that the temperatures rose rapidly and then increased gradually. The temperatures at different specimen-section heights were nearly identical. And the temperature precision, based on the thermistor measurement, was less than ±0.1 °C. Considering the measurement errors and system precision, the precision for temperatures agreed well with the anticipated results and met the requirements for frozen soil at temperatures close to 0 °C.
2.2 Specimen-preparation methodThe frozen soils were collected from the Kaixinling (KXL) section located on the Qinghai–Tibet Plateau. The soil core was sampled by a drilling machine and then carefully trimmed with small knifes (Figure 4). The bore hole had to be kept upright to get samples with an apparent regular appearance, and the recorded maximum sampling depth was 11.8 m. Then, these frozen samples were labeled, stored in a pre-prepared refrigerator, and sealed with adhesive tape to avoid moisture evaporation. Afterward, these samples, together with the refrigerator, were shipped from the Qinghai–Tibet Plateau to the laboratory.

|
Figure 4 Undisturbed samples |
To eliminate the scatter of test results arising from randomly distributed micro-cracks or fissures, a multi-stage loading on a single-specimen method was used in this study. The confining pressure was 50 kPa, 100 kPa, 200 kPa, and 300 kPa, respectively. Based on the in-situ temperature measurement, the temperature for the test was −1 °C. The test procedure was as follows:
(1) Specimen installment. When the temperatures in the incubator reached the set level, the frozen-soil specimen was wrapped with rubber membrane and then placed on the pedestal of the pressure chamber. The two end surfaces of the frozen specimen were in contact with the top and bottom refrigeration plates, respectively.
(2) Freezing. The temperature was decreased by the top and bottom refrigeration plates connecting with baths, and the environmental temperature around the specimen was maintained by the incubator. The duration of freezing was greater than 12 h.
(3) Confinement application. An air pump was activated to supply the confining pressure, and a pressure of 50 kPa was initially applied on the frozen-soil specimen through the pressure controller. Before testing, the pressure was maintained for approximately 5 min.
(4) Triaxial shearing. A strain rate of 1.25 mm/min was used in the test. And the shearing was continued until the axial stress reached peak value, with the strain data collected automatically. The above-mentioned process was repeated under a confining pressure of 100 kPa, 200 kPa, and 300 kPa, and the relationship between strength and confining pressures was then obtained.
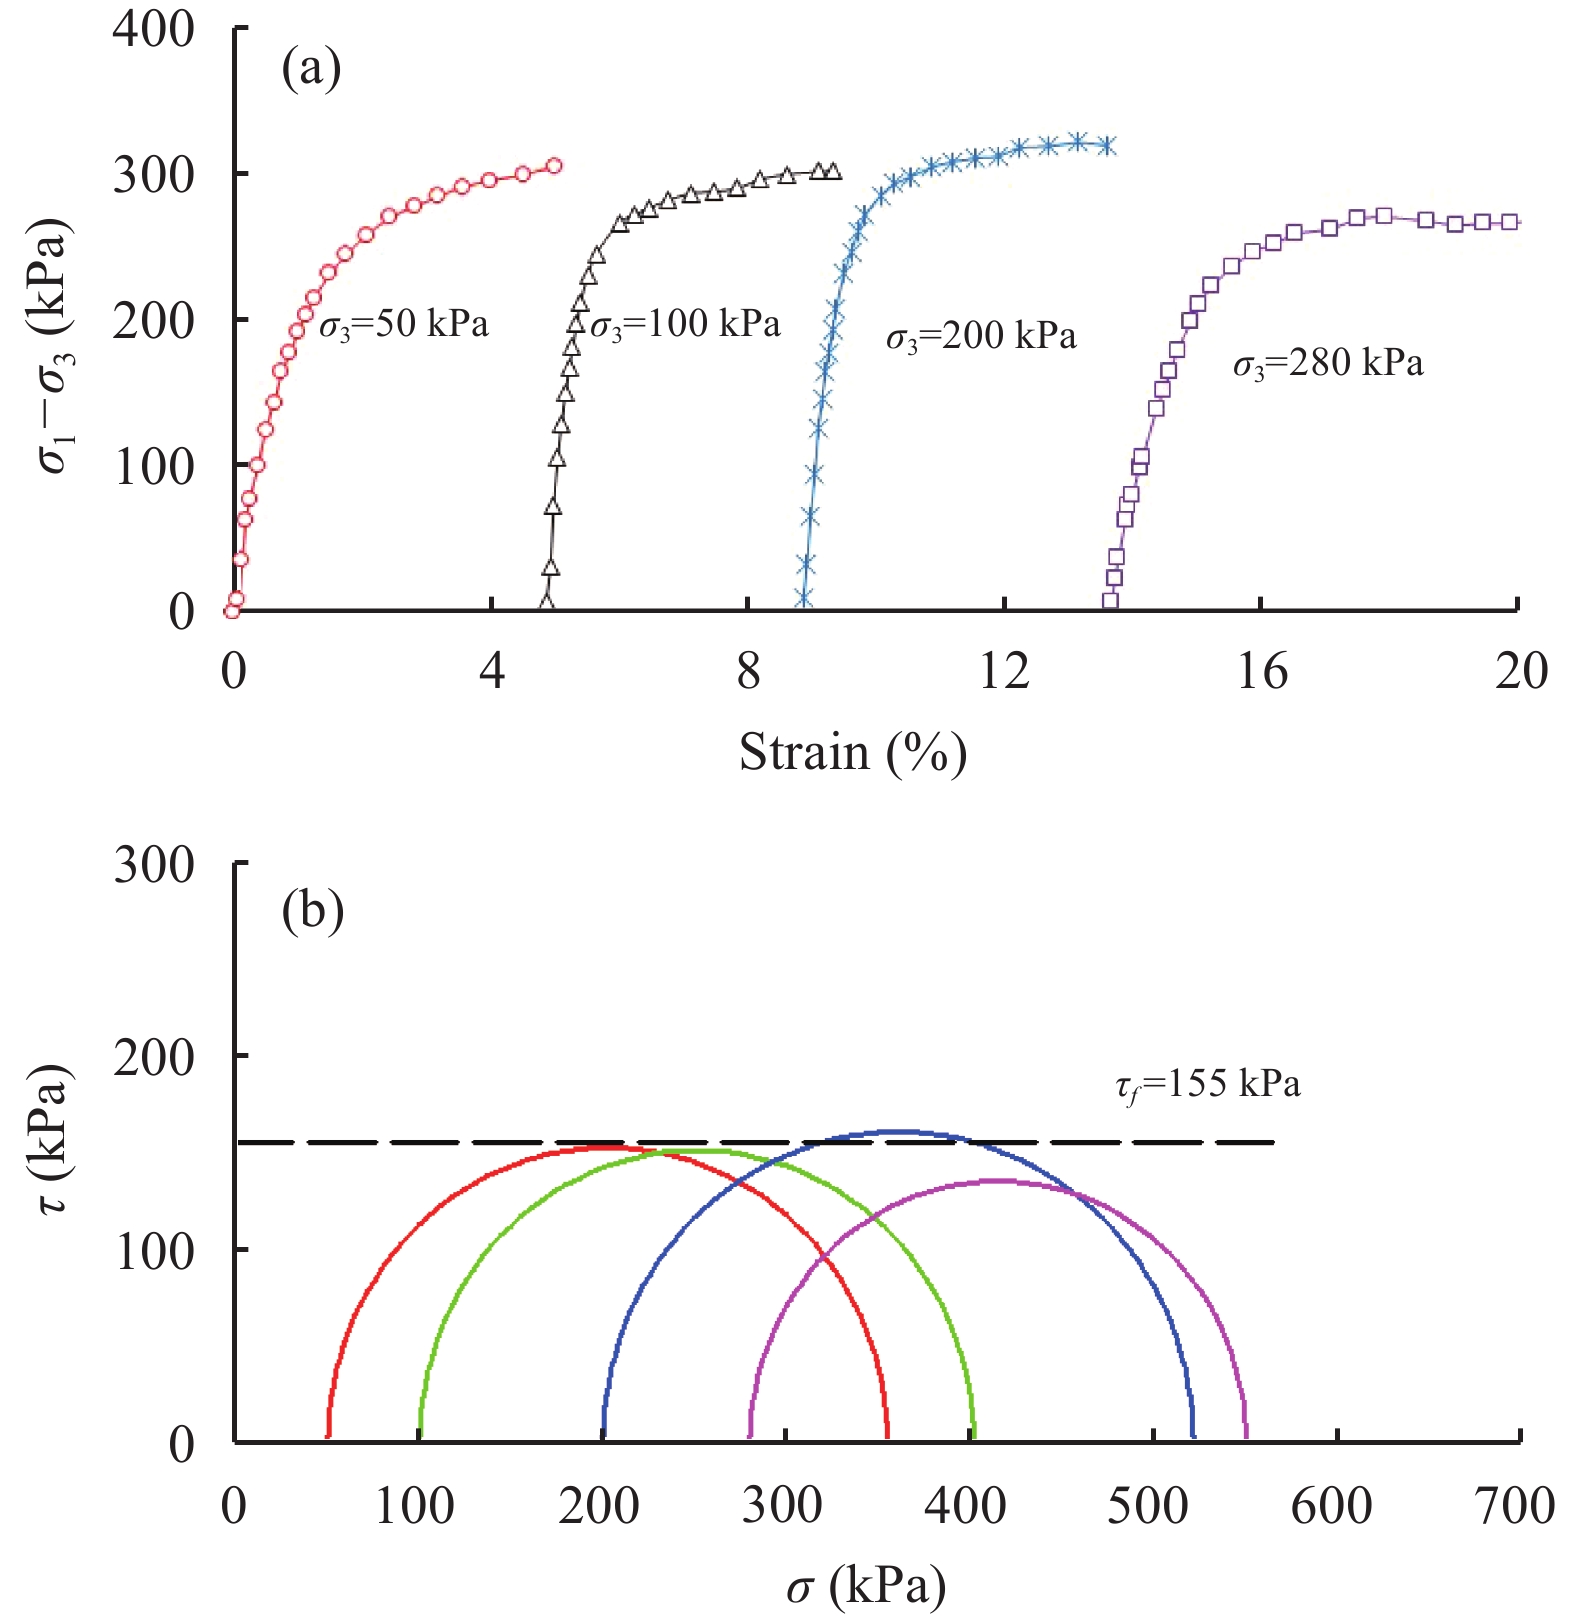
3 Test results and analysis 3.1 Reconstituted frozen soilsThe test of reconstituted frozen soils was initially carried out to validate the reliability of the apparatus. The results are plotted in Figures 5~7.
From Figure 5, the strength under a confining pressure of 50 kPa, 100 kPa, 200 kPa, and 280 kPa is 305.1 kPa, 302.4 kPa, 321.8 kPa, and 267.5 kPa, respectively. And the corresponding strain under peak strength is 5.0%, 9.3%, 13.1%, and 20.1%, respectively. Obviously, peak strength is independent of the confining pressures. According to the strength data, the Mohr-Coulomb strength curve was plotted in Figure 5b. From Figure 5b, the Mohr circle under various confining pressures is close to an identical level, and the calculated shear strength of the reconstituted frozen soils is about 155 kPa.
|
Figure 5 Test result for reconstituted frozen soils (#1): (a) stress-strain curve; (b) Mohr-Coulomb curve (−1 °C) |
|
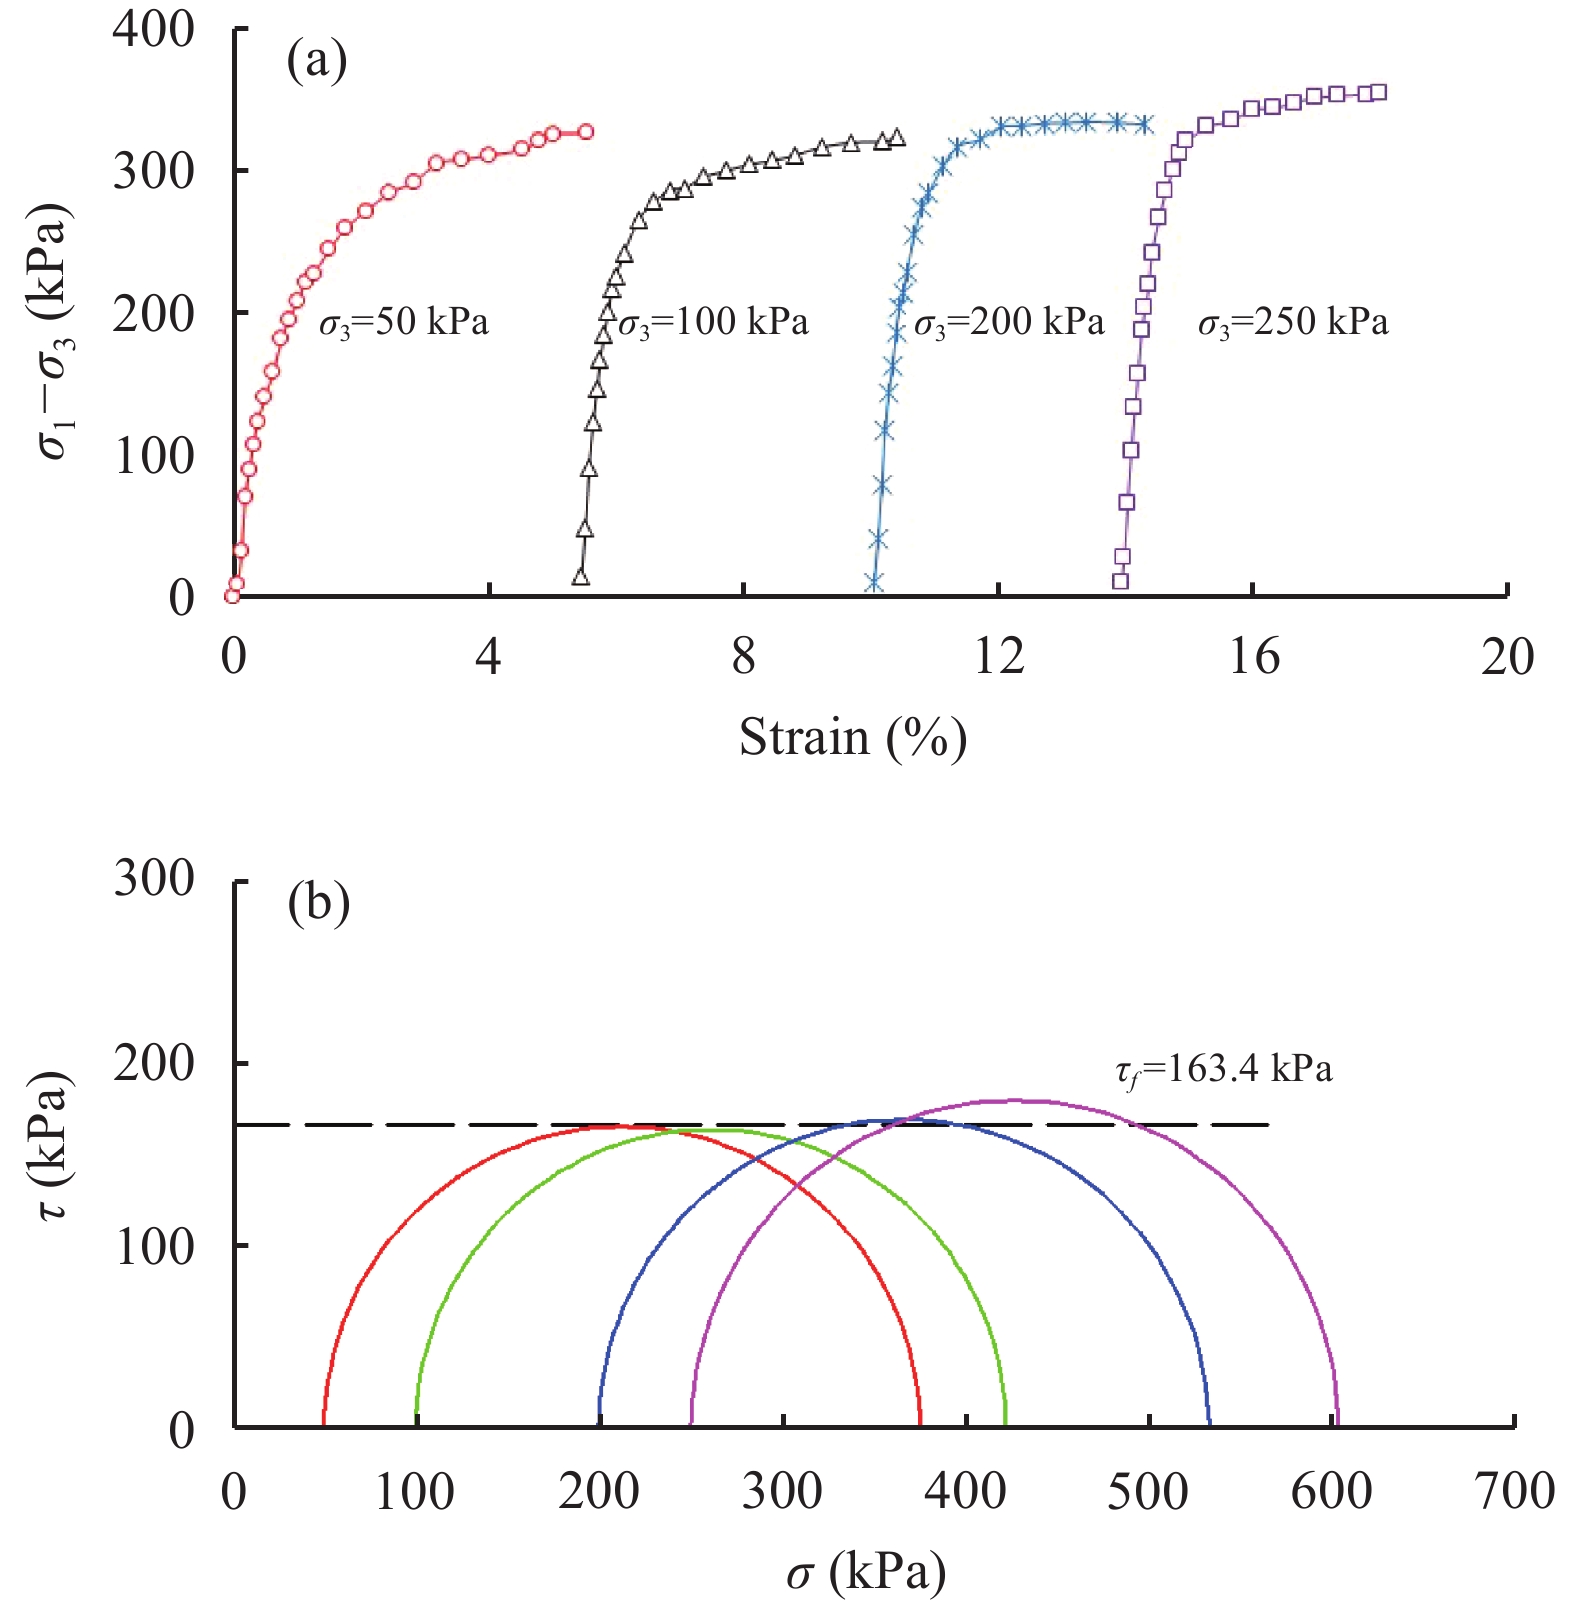
Figure 6 Test result for reconstituted frozen soils (#2): (a) stress-strain curve; (b) Mohr-Coulomb curve (−1 °C) |
Figure 6 is the comparative experiment for reconstituted frozen soils under −1 °C. From Figure 6, peak strength under a confining pressure of 50 kPa, 100 kPa, 200 kPa, and 250 kPa is 325.2 kPa, 322.2 kPa, 331.5 kPa, and 353.3 kPa, respectively. The axial strain under peak strength is 5.5%, 10.3%, 14.2%, and 17.9%, respectively. This observation again verified the phenomenon that peak strength is independent of the confining pressures for frozen soils with a temperature close to 0 °C. Similarly, the Mohr-Coulomb strength curve was plotted in Figure 6b. From Figure 6b, the Mohr circle under various confining pressures is almost identical; and the calculated shear strength of the reconstituted frozen soils is about 163.4 kPa. These results are very close to those of the first test.
|
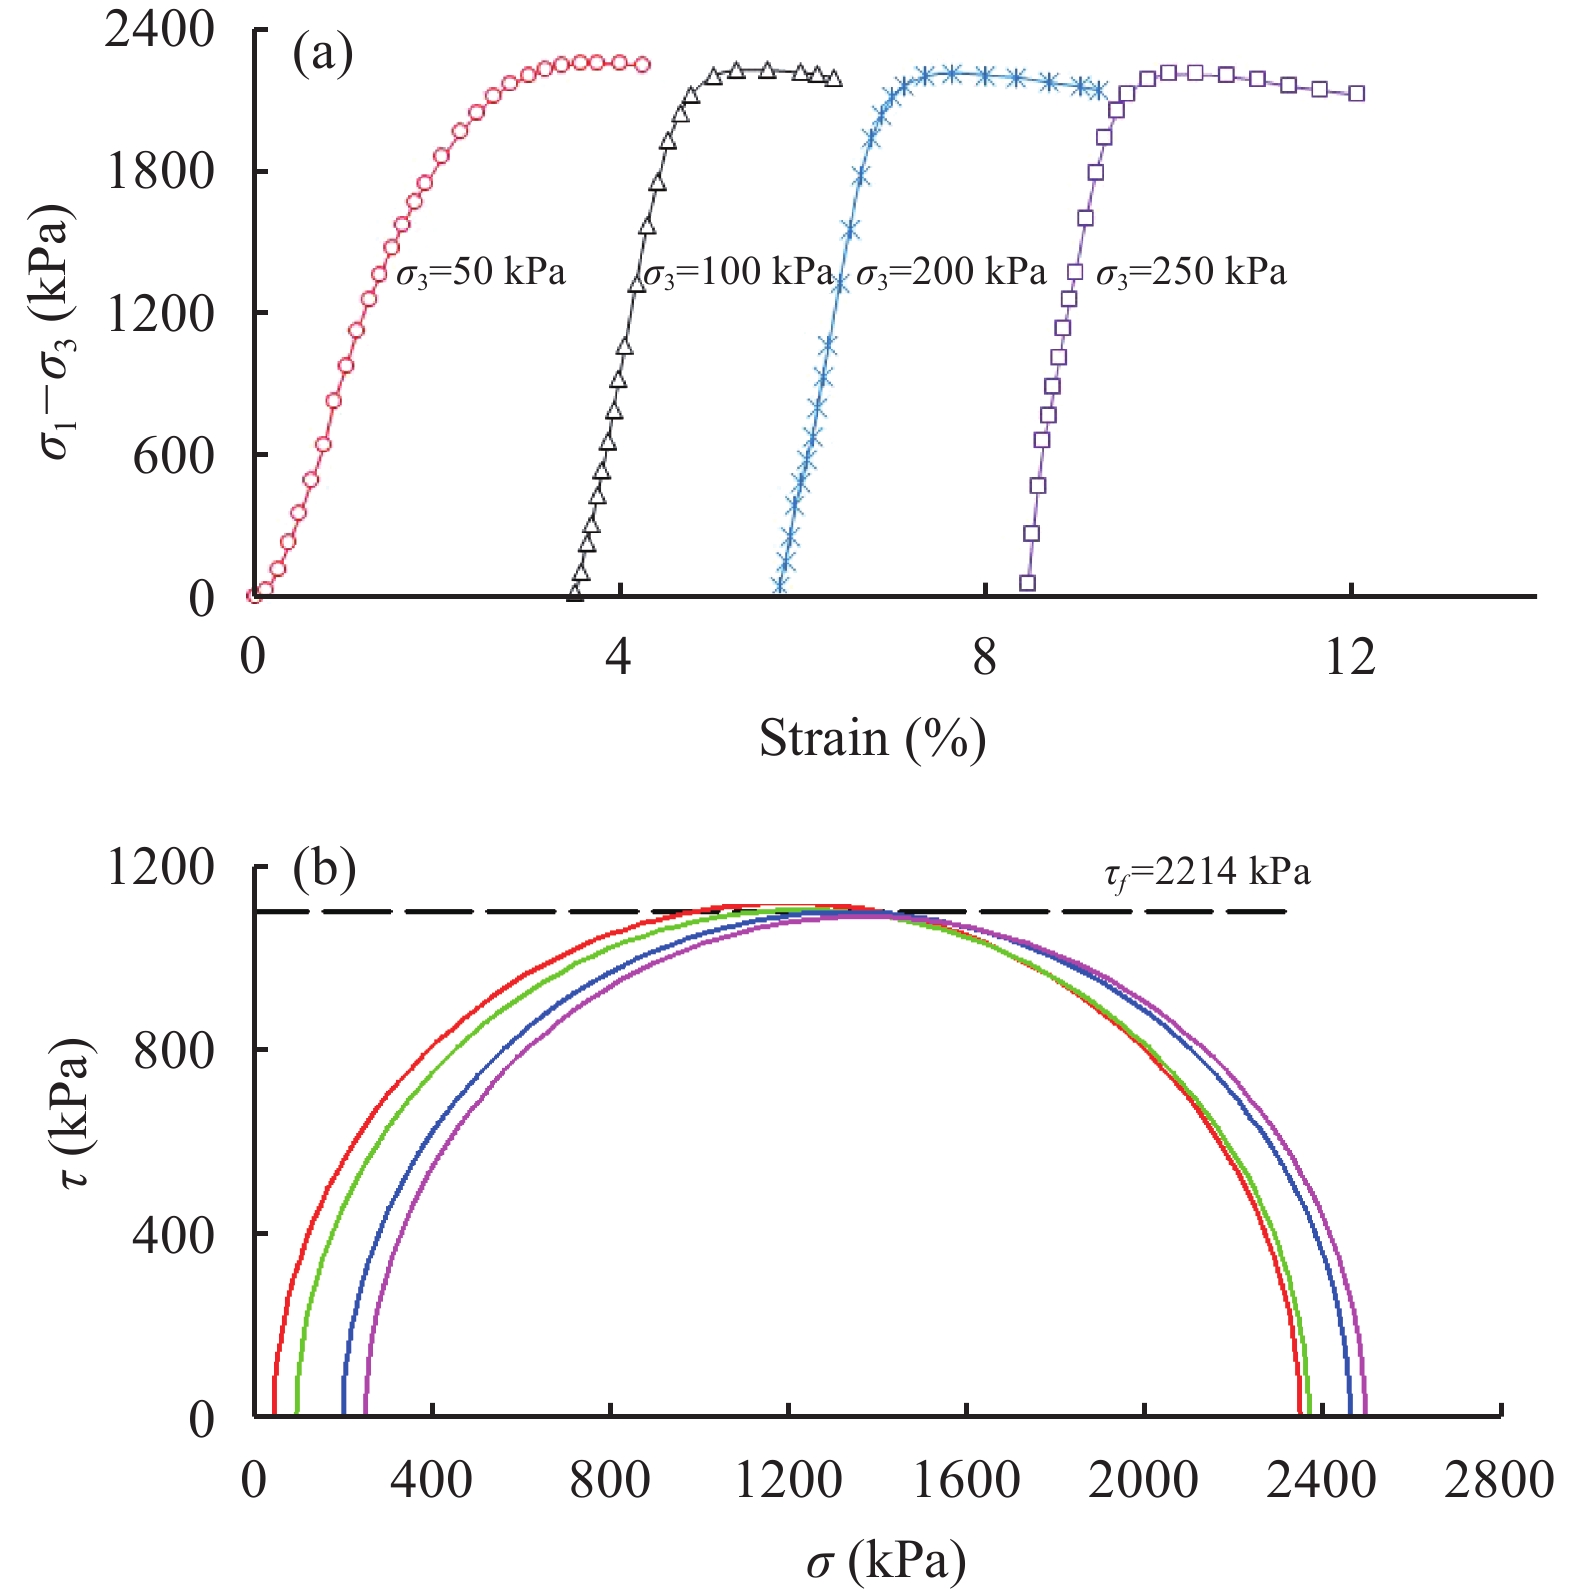
Figure 7 Test result for reconstituted frozen soils (#3): (a) stress-strain curve; (b) Mohr-Coulomb curve (−5 °C) |
Figure 7 indicated that the peak strength for frozen soils with a temperature of −5 °C under a confining pressure of 50 kPa, 100 kPa, 200 kPa, and 250 kPa is 2,246.8 kPa, 2,217.7 kPa, 2,205.3 kPa, and 2,198.9 kPa, respectively. And the strain under peak strength is 3.7%, 5.6%, 7.6%, and 10.3%, respectively. The axial strain under peak strength is smaller than the results under a temperature of −1 °C. This phenomena implies that the decrease of temperatures enhances the brittle behaviors of frozen soil specimens. The radius of the Mohr circle under different confining pressures in Figure 7b is almost identical, and the calculated shear strength of the reconstituted frozen soils is about 2,214 kPa.
The mean shear strength under a temperature of −1 °C is approximately 159.2 kPa, whereas the shear strength under a temperature of −5 °C is 2,241 kPa. In other words, a temperature decrement of 4 °C causes a fourteen fold increment of strength. However, compared with the influences from temperatures, the influence of confining pressures to the strength can be neglected.
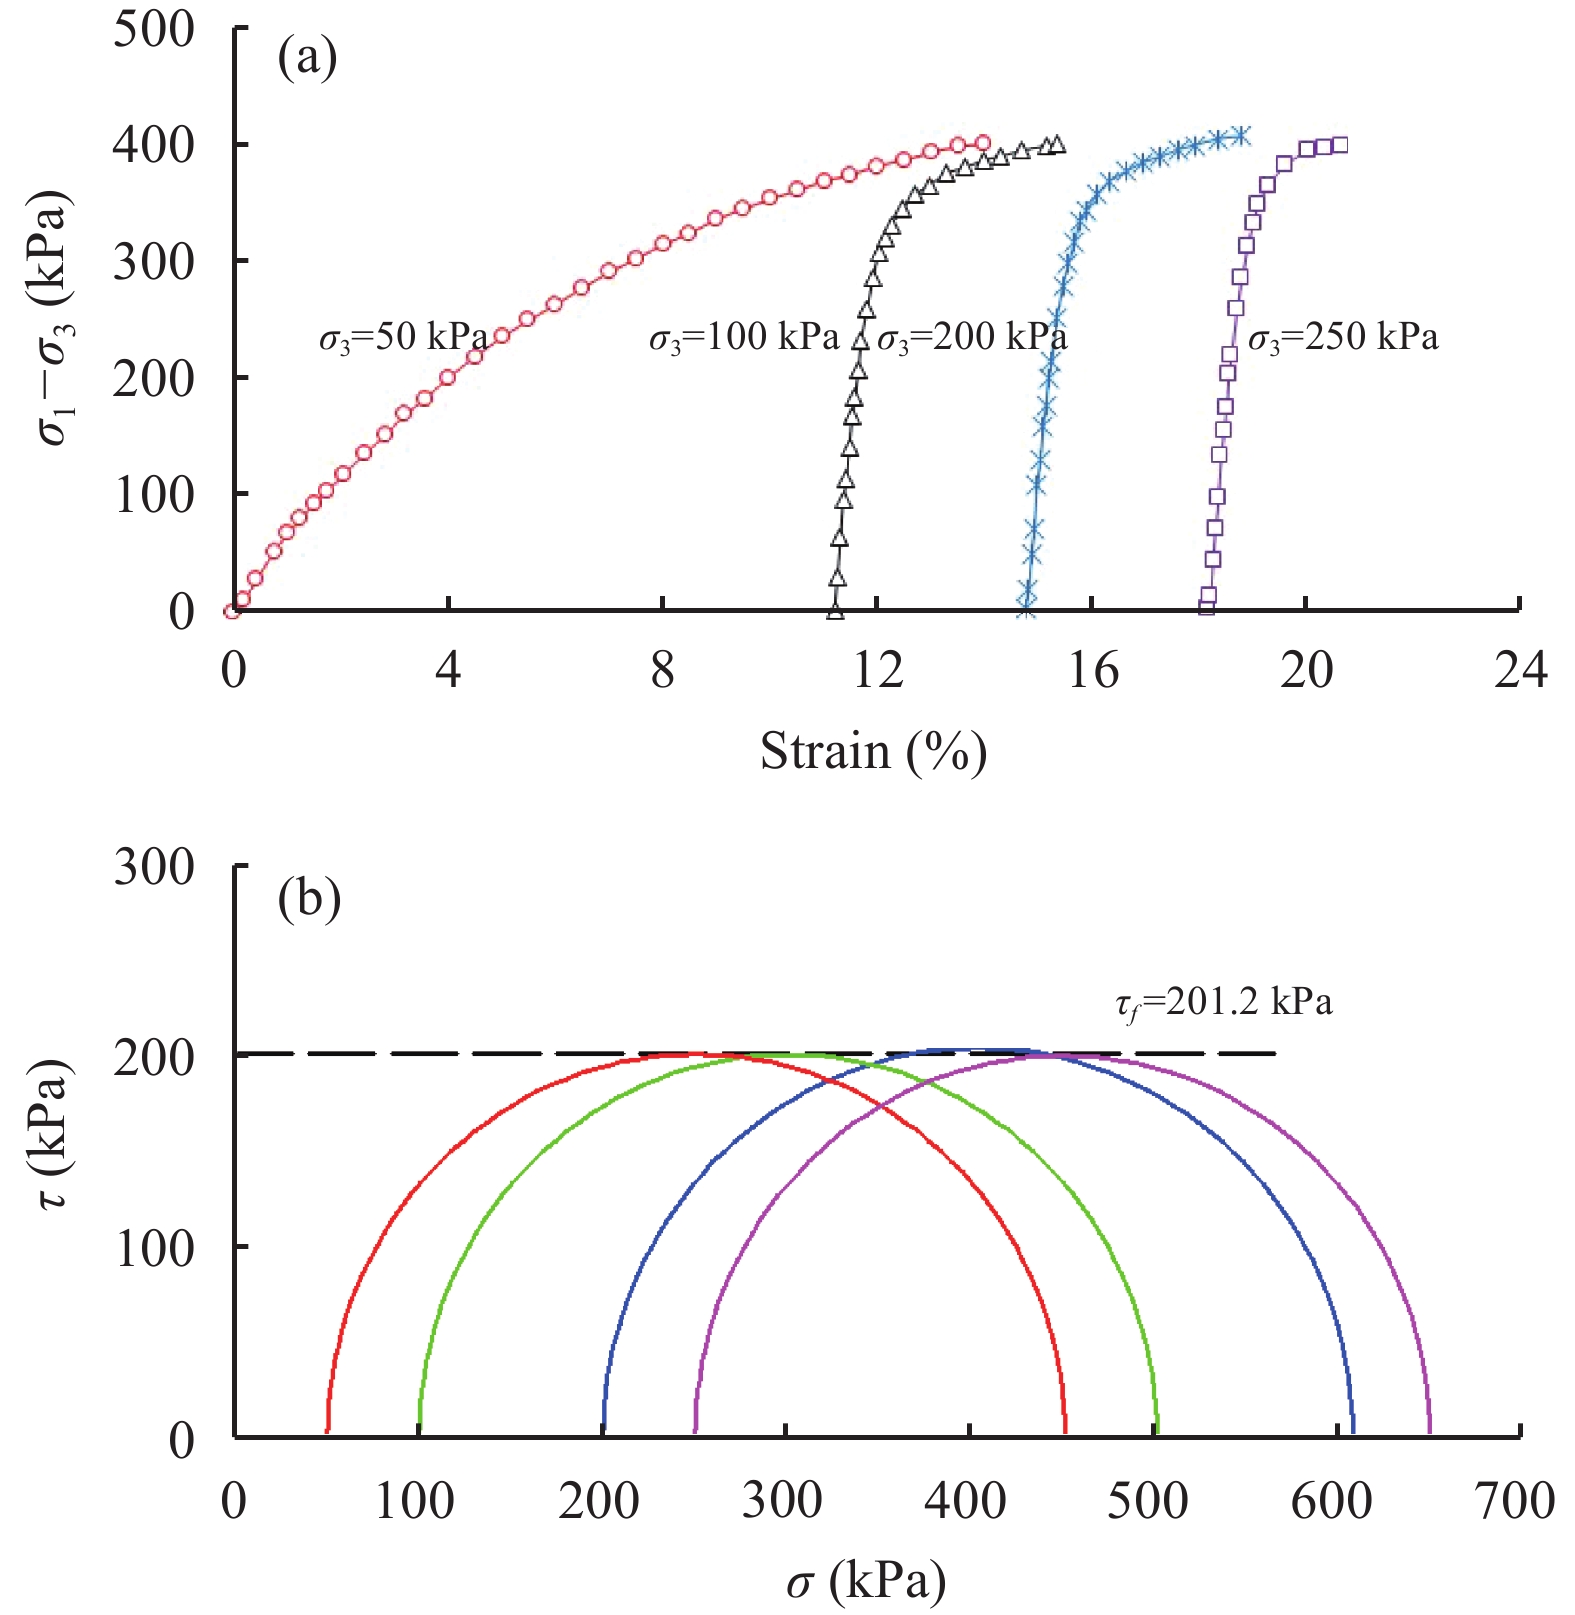
3.2 Undisturbed frozen soilsThe test results for undisturbed frozen-soil specimens are listed in Figures 8~10.
|
Figure 8 Test result for undisturbed frozen soils (#1): (a) stress-strain curve; (b) Mohr-Coulomb curve (−1 °C) |
Figure 8 depicts the typical results of an undisturbed frozen-soil specimen; the sampling depth in Figure 8 was 5.1 to 5.2 m. Figure 8 showed that the peak strength under a confining pressure of 50 kPa, 100 kPa, 200 kPa, and 250 kPa is 401.2 kPa, 401.1 kPa, 407.8 kPa, and 399.8 kPa, respectively. And the strain under peak strength is 14.0%, 15.4%, 18.8%, and 20.7%, respectively. It is found that the peak strength of the undisturbed frozen soils is also independent of the confining pressures. The Mohr-Coulomb strength curve was plotted in Figure 8b. From Figure 8b, the radius of the Mohr circle under different confining pressures is identical; and the shear strength for undisturbed frozen soils is then calculated as 201.2 kPa.
|
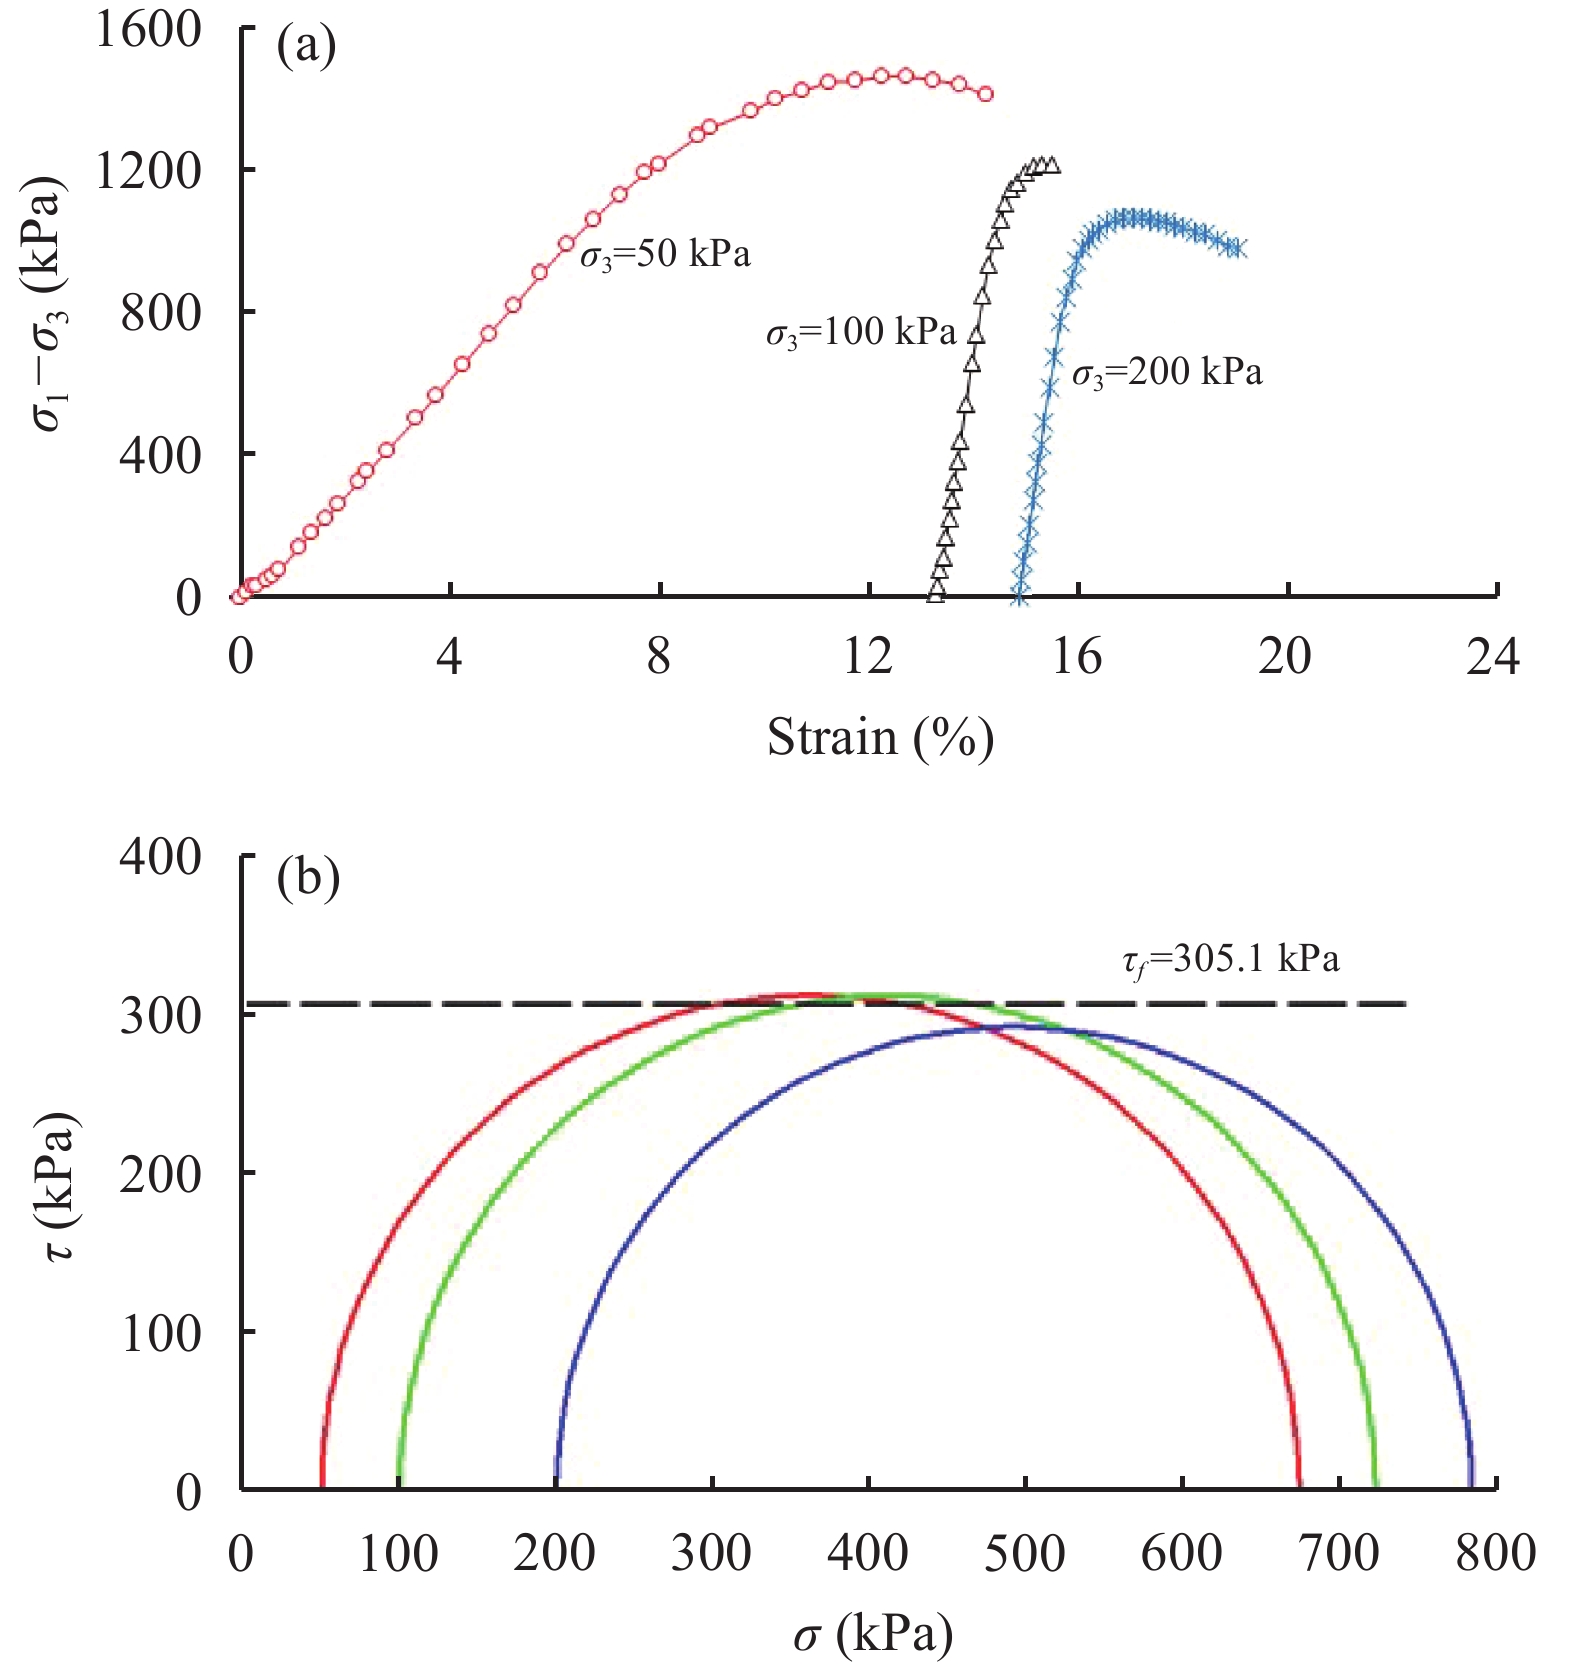
Figure 9 Test result for undisturbed frozen soils (#2): (a) stress-strain curve; (b) Mohr-Coulomb curve (−1 °C) |
The sampling depth of frozen-soil specimens in Figure 9 was 6.1 to 6.2 m. Figure 9 indicates that the peak strength under a confining pressure of 50 kPa, 100 kPa, and 200 kPa, is 623.9 kPa, 622.7 kPa, and 583.9 kPa, respectively. And the strain under peak strength is 12.7%, 15.5%, and 17.2%, respectively. The Mohr-Coulomb strength curve was plotted in Figure 9b. From Figure 9b, the calculated shear strength of the undisturbed frozen soils is about 305.1 kPa; and that was mainly from the cohesion.
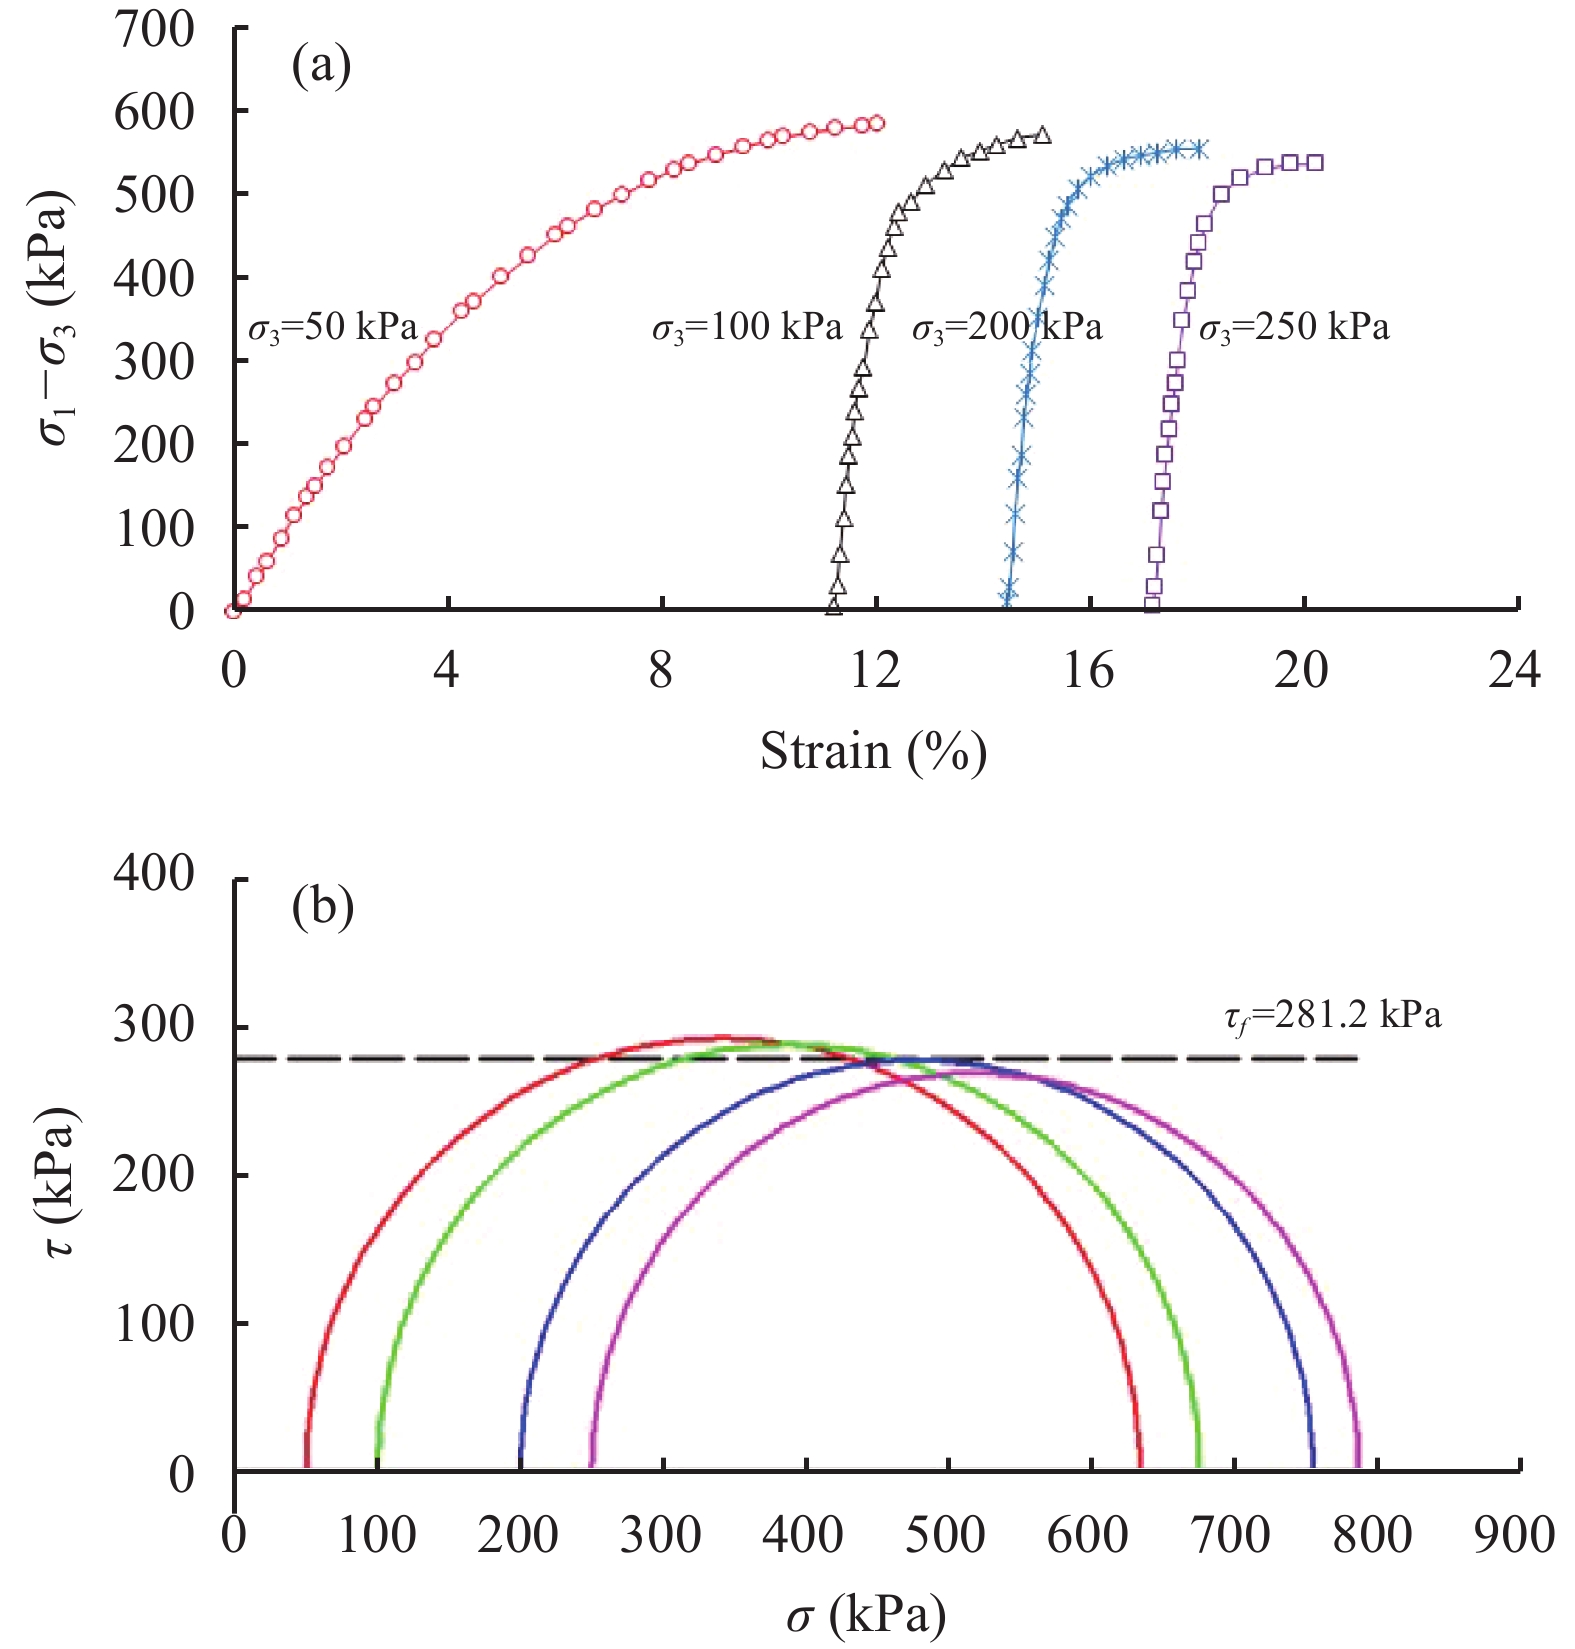
The sampling depth of the frozen-soil specimens in Figure 10 was 6.6 to 6.7 m. It can be seen from Figure 10 that the peak strength under a confining pressure of 50 kPa, 100 kPa, 200 kPa, and 250 kPa is 583.6 kPa, 575 kPa, 554.5 kPa, and 536.4 kPa, respectively. And the strain under peak strength is 12.0%, 15.1%, 18.0%, and 20.2%, respectively. The Mohr-Coulomb strength curve was plotted in Figure 10b. From Figure 10b, the calculated shear strength of the undisturbed frozen-soil specimen is about 281.2 kPa. The calculated strength is smaller than the result in Figure 9, but larger than the result in Figure 8.
|
Figure 10 Test result for undisturbed frozen soils (#3): (a) stress-strain curve; (b) Mohr-Coulomb curve (−1 °C) |
The dry density and water content of samples from the KXL section of the Qinghai–Tibet Plateau with a sampling depth of 6.6 to 6.7 m was 1.3 g/cm3 and 30% respectively, approaching the values for reconstituted frozen reconstituted soils (dry density, 1.4 g/cm3; water content, 30%). But the mean strength of reconstituted frozen soils is 159.2 kPa, and it is lower than that of the undisturbed frozen soils, 281.2 kPa. Furthermore, the mean shear strength of an undisturbed frozen-soil specimen is about 262.5 kPa, 1.65 times more than the strength of a reconstituted frozen-soil specimen. These findings accord with the previous observations on the strength relationship between reconstituted frozen soils and undisturbed frozen soils. Additionally, the water content plays a more significant effect than the dry density. Because the water content of specimens from KXL (6.1 to 6.2 m) exhibits the maximum value of 43.4% and thus produces the maximum shear strength. The gravels and pore-ice with a diameter larger than 2 mm were observed in the undisturbed frozen-soil specimen, and this contributes to the increase of shear strength. However, the reported weakening effects from fissures and cracks to the shear strength were less evident in the present investigation.

|
Figure 11 Schematic of structures existing between soil particles, pore-ice, pore-water, and pore-air |
The temperature variation leads to a change for the ice quantity and the unfrozen water quantity, as well as the phase change of unfrozen water and the structure existing between pore-ice and unfrozen water, thus contributing to a nonlinear increase of the strength for warm frozen soils. Generally, the unfrozen water quantity varied dramatically under a slight temperature decrement for frozen soils with a temperature near 0 °C, and the corresponding pore-ice quantity increased sharply. The ice in frozen soils exists with a needlelike, stratified-like, or granulate shape, and that fills the most pores between soil particles and unfrozen water. The skeleton formed between pore-ice and soil particles together bears the applied shear stress. The previous studies implied that the contribution of pore-ice and the quantity increasing to the tensile strength of frozen soils with a temperature near 0 °C was over 85%, while the contribution of pre-ice strength to the strength of frozen soils accounted for about 10% (Zhou et al., 2015 ). Therefore, the pore-ice plays an important role in warm frozen soils, and the temperature-dependent strength behavior is associated with the pore-ice quantity and pore-ice/unfrozen water interaction.
Particularly, there are a solid phase consisting of soil particles and pore-ice and a liquid phase (unfrozen water) under the condition of a saturated state. The fact that there is a substantial quantity of unfrozen water for frozen soils with a temperature close to 0 °C makes triaxial compression for warm frozen soils similar to the undrained traixial compression for unfrozen saturated soils, because the pore-ice was encompassed by the unfrozen water under warm temperatures as shown in Figure 11. Naturally, the undrained shear strength based on the total stress method means that the shear strength is independent of the confining pressures. However, this observation is inapplicable under apparent high confining pressures due to the pressure–melting phenomenon.
4 ConclusionsA series of triaxial compression tests on frozen-soil specimens at temperatures close to 0 °C has been conducted employing a testing apparatus equipped with an air-pressure controller. The shear strength of undisturbed frozen soils was analyzed, and the comparison between the strength of reconstituted and undisturbed frozen soils was investigated. The following conclusions can be formulated based on the results of this study:
1) The confining pressure applied by the air pump reduced the heat exchange and decreased the temperature fluctuation in the pressure chamber, thus leading to a high temperature precision of ±0.1 °C. The multi-stage loading on a single specimen method can reduce the scatter of the test results, and it was verified to be suitable for the undistributed frozen soils.
2) The replication of the test on reconstituted frozen-soil specimens with a temperature of −1 °C verified the reliability of the developed apparatus, and the findings that the temperature decrement resulted in a shear strength increment was consistent with the previous studies. But the strengthening effects of confining pressure to the shear strength were less noticeable than for the temperatures.
3) The shear strength of undisturbed frozen-soil specimens was higher than that of the reconstituted frozen-soil specimen due to the uniformly distributed large proportion of pore-ice and gravel, and it is approximately 1.6 times more than for the reconstituted frozen soils.
4) The strength mechanism is closely related to the structures existing between soil particles, pore-water, and pore-ice. The pore-ice is surrounded by substantial pore-water for frozen soils with a temperature close to 0 °C, thus producing the similar strength behavior with that for unfrozen saturated soils.
Acknowledgments:The authors would like to extend great thanks to GuiLin Lu and Wei Jiao for their hard work in the experiment. This research was supported by National Natural Science Foundation of China (No. 51304209), the Natural Science Foundation of Jiangsu Province of China (No. BK20141135), and the Fundamental Research Funds for the Central Universities (No. 2015QNA63).
Cao YY. 2015. Experimental study on frozen soil subgrade strength in the northern foot of Qinghai-Tibet Railway. Low Temperature Architecture Technology, 2: 82-84. DOI:10.13905/j.cnki.dwjz.2015.02.032 |
Chang XX, Ma W, Sheng Y, et al. 1995. Effects of experimental conditions on mechanical index of frozen soils. Journal of Glaciology and Geocryology, 17: 151-155. |
Du HM, Zhang SJ, Ma W, 2014. Experimental study of uniaxial compressive deformation and strength of frozen silty sand under different initial ice contents. Rock and Soil Mechanics, 10: 2855–2860. DOI: 1000-7598(2014)10-2855-06. (in Chinese)
|
Hu K, Lai YM. 2014. Experimental study on the strength parameters and strength criteria of saline frozen silty sand. Journal of Glaciology and Geocryology, 36(5): 1199-1204. DOI:10.522/j.issn.1000-0240.2014.0143 |
Huo M, Wang SJ, Zhang JZ, et al. 2010. Experimetnal study on influences of water content and temperature on mechanical properties of ice-rich frozen soil. Journal of Hydraulic Engnieering, 41(10): 1165-1172. DOI:10.13243/j.cnki.slxb.2010.10.009 |
Jin HJ, Li SX, Wang SL, et al., 2000. Impacts of climatic change on permafrost and cold regions environments in China. Acta Geographica Sinica, 55(2): 161–173. DOI: 0375-5444(2000)02-0161-13. (in Chinese)
|
Lai YM, Zhang Y, Zhang SJ, et al., 2009. Experimental study of strength of frozen sandy soil under different water contents and temperatures. Rock and Soil Mechanics, 30(12): 3665–3670. DOI: 1000-7598(2009)12-3665-06. (in Chinese)
|
Li ZY, Zhang B. 2014. Experimental study of stress-stain relationships of frozen expansive soil. Journal of Glaciology and Geocryology, 36(4): 902-906. DOI:10.7522/j.issn.1000-0240.2014.0108 |
Ma W, Mu Y, Wu Q, et al., 2011. Characteristics and mechanisms of embankment deformation along the Qinghai-Tibet Railway in permafrost regions. Cold Regions Science and Technology, 67(3): 178–186. DOI: 1000-4548(2004)01-0115-05. (in Chinese)
|
Ma XJ, 2006. Experimental study on creep of warm and ice-rich frozen soil. Ph.D. Thesis, Cold and Arid Regions Environmental and Engineering Research Institute. DOI: 1000-4548(2007)04-0848-05. (in Chinese)
|
Radd FJ, Wolfe LH. 1979. Ice lens structures, compression strengths and creep behavior of some synthetic frozen silty soils. Engineering Geology, 13: 169-183. DOI:10.1016/0013-7952(79)90030-9 |
Watson GH, Slusarchuk WA, Rowley RK. 1973. Determination of some frozen and thawed properties of permafrost soils. Canadian Geotechnical Journal, 10(4): 592-606. DOI:10.1139/t73-055 |
Yang ZH, Still BJ, Ge XX. 2015. Mechanical properties of seasonally frozen and permafrost soils at high strain rate. Cold Regions Science and Technology, 113: 12-19. DOI:10.1016/j.coldregions.2015.02.008 |
Zhang SJ, Sun ZZ, Du HM. 2012. A preliminary analysis of main factors affecting stress-strain behaviors of frozen soil with high water content. Applied Mechanics and Materials, 1975(204): 128-134. DOI:10.4028/www.scientific.net/AMM.204-208.128 |
Zhao XD, Zhou GQ, Lu GL, et al. 2017. Thermal gradient dependent deformation behavior of frozen soil and its mechanism at temperatures close to 0 °C. Cold Regions Science and Technology, 135: 105-115. DOI:10.1016/j.coldregions.2017.01.001 |
Zhou GQ, Hu K, Zhao XD, et al. 2015. Laboratory investigation on tensile strength characteristics of warm frozen soils. Cold Regions Science and Technology, 113: 81-90. DOI:10.1016/j.coldregions.2015.02.003 |
 2017, Vol. 9
