2. College of Engineering, University of Alaska Anchorage, Anchorage, Alaska 99508, USA;
3. School of Civil Engineering, Harbin Institute of Technology, Harbin, Heilongjiang 150090, China;
4. State Key Laboratory of Geo-mechanics and Deep Underground Engineering, China University of Mining and Technology, Xuzhou, Jiangsu 21116, China
Thawed permafrost could cause a serious of problems for foundations in cold regions (Andersland and Ladanyi, 2004). Alaska is covered by permafrost, and the depth can approach 600 m in the North Slope (Brown, 1970; DeGeer and Cathro, 1992). A potential engineering disaster exists in oil-wells when warm oil is extracted from deep reservoirs, thawing the permafrost and inducing soil settlement (Smith and Clegg, 1971; Goodman, 1978; Smith, 1983). To evaluate the stability of oil-wells and surrounding soil, the elastic properties of thawed permafrost first need to investigated.
Wave velocity and modulus of soil are important elastic parameters in analyzing site response. Numerous experimental results have been conducted on frozen soils by both site and laboratory testing methods, such as triaxial, resonant column, and wave velocity test based on ultrasonic method (Watson et al., 1973 ; Vinson, 1978; Zhu and Zhang, 1982; Ling et al., 2002 , 2015; Li et al., 2007 ). Numerous tests were performed on thawed soils to investigate the modulus affected by freeze-thaw cycles (Graham and Au, 1985; Ogata et al., 1985 ; Berg et al., 1996 ; Simonsen et al., 2002 ; Wang et al., 2007a ; Ishikawa et al., 2008 ; Liu et al., 2010 ; Zhang et al., 2015 ), and on thawing soils to investigate the thaw consolidation behaviors (Tsytovich, 1975; Alkire, 1977; Tong and Chen, 1987; Ponomarev et al., 1988 ). However, these tests were carried out on reconstituted soil samples, and cannot present the original fabrics between soil particles and ice lens. Recently, a rare experimental research has been reported on thawed and thawing natural permafrost for thawed settlement and strength (Watson et al., 1973 ; Nixon and Hanna, 1979).
To determine the modulus behaviors on natural thawed permafrost, an original and non-damage testing procedure named Bender Elements Method was employed herein. Bender element is an electromechanical transducer to achieve converting between electrical energy and mechanical energy. The first bender element was introduced by Shirley and Hampton (1978), and then improved by numerous researches (Dyvik and Madshus, 1985; Lee and Santamarina, 2005; Leong et al., 2005 ; Youn et al., 2008 ). The advantages of bender element have been demonstrated, and it also could easily get the wave velocity and initial tangent modulus for strains as low as 10−6.
This paper presents shear property results obtained from testing of thawed silty and sandy permafrost. The Bender element (i.e., BE) was designed and manufactured firstly, and used to measure shear wave velocities. Then, the shear modulus affected by confining pressure, water (ice) content and dry density were analyzed and discussed. Finally, a regression formulation of shear modulus for thawed silty and sandy permafrost were proposed and validated, respectively.
2 Experimental programs 2.1 Thawed permafrost preparationPermafrost cores with 10 cm diameter were sampled from 2A P1 drilling site in the North Slope of Alaska, USA, and then preserved in cold storage. The permafrost cores were trimmed to cylinder samples about 70 mm diameter in a cold room at a temperature of −20 °C. Then the prepared samples were covered by plastic wrap, and placed into a sealing bag at indoor temperature of about 20 °C for 24 hours. Table 1 summarizes the soil sample number, depth, and other properties such as water content (w), bulk density (p), specific gravity (Gs) and salinity. Note that the water content ranges from 18.02% to 25.93% for thawed silty soils, and from 20.42% to 27.70%. Most water content is greater than plastic limit (PL), and smaller than liquid limit (LL). It is interesting to note that salinity varies widely from 7.5 ppt (part per thousand) to 28.0 ppt for silty specimens, whereas the salinity only changes slightly from 0.5 ppt to 5.0 ppt for sand specimens. Bulk density range is 1,836 kg/m3 to 2,007 kg/m3 for silty soils, and 1,788 kg/m3 to 2,108 kg/m3 for sandy soils.
|
|
Table 1 Details of test sample from the 2A P1 drilling site |
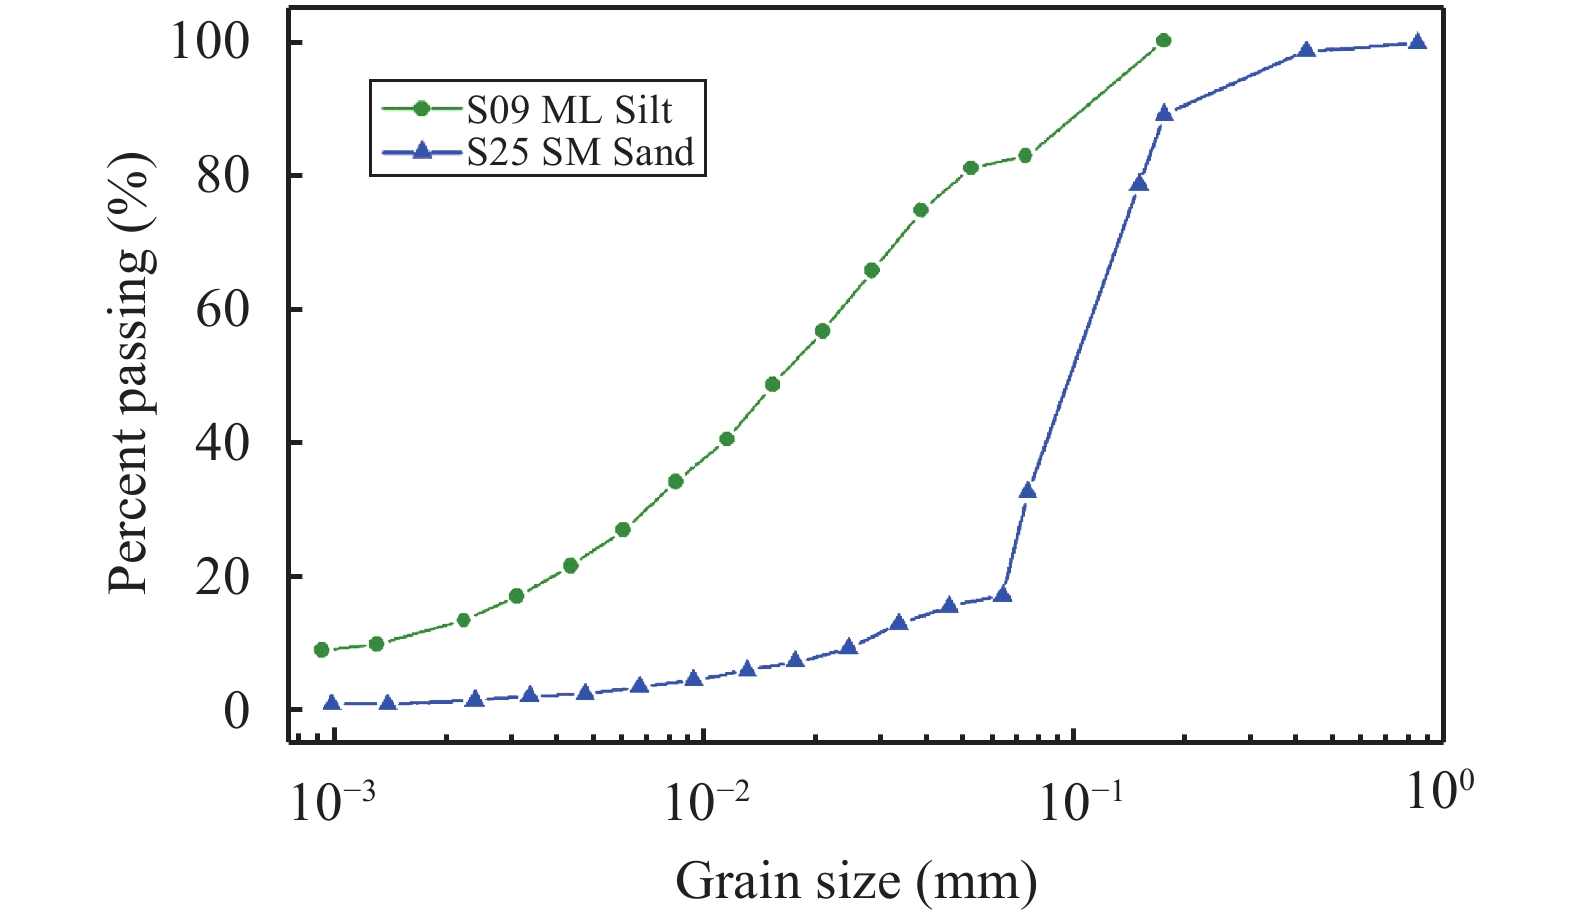
Figure 1 shows the grain size distributions of representative permafrost. All samples including silt and sand can be classified as ML and SM, respectively. The uniformity coefficient and curvature coefficient for sandy soil can be determined as 4.0 and 1.4.

|
Figure 1 Grain size distribution curves of thawed permafrost |
The piezoelectric material (i.e., type of T226-H4-503Y) produced by PIEZO SYSTEMS, INC. was used to manufacture the bender element. Parallel type element was chosen to prepare the bender element, and the piezoelectric rectangular slice is about 10 mm long, 4 mm wide and 0.66 mm thick. Figure 2 shows the wire connection, coating and housing of the bender element. Firstly, internal plate of PZT was connected to a positive pole, and two surfaces were connected to ground. Secondly, the welding area and slice edge were coated and covered by polyurethane. The top and bottom surfaces of the slice were shielded and grounded by silver paint to eliminate cross-walk caused by electromagnetic interaction (Lee and Santamarina, 2005). Thirdly, the ending of prepared element was placed into a nylon plug and leaves a cantilever of about 3 mm long, then the rest of the space is filled and anchored with epoxy. Finally, the polyurethane was coated on the tips again in order to waterproof and protect the sensors.

|
Figure 2 Wire connection, coating and housing of bender element |
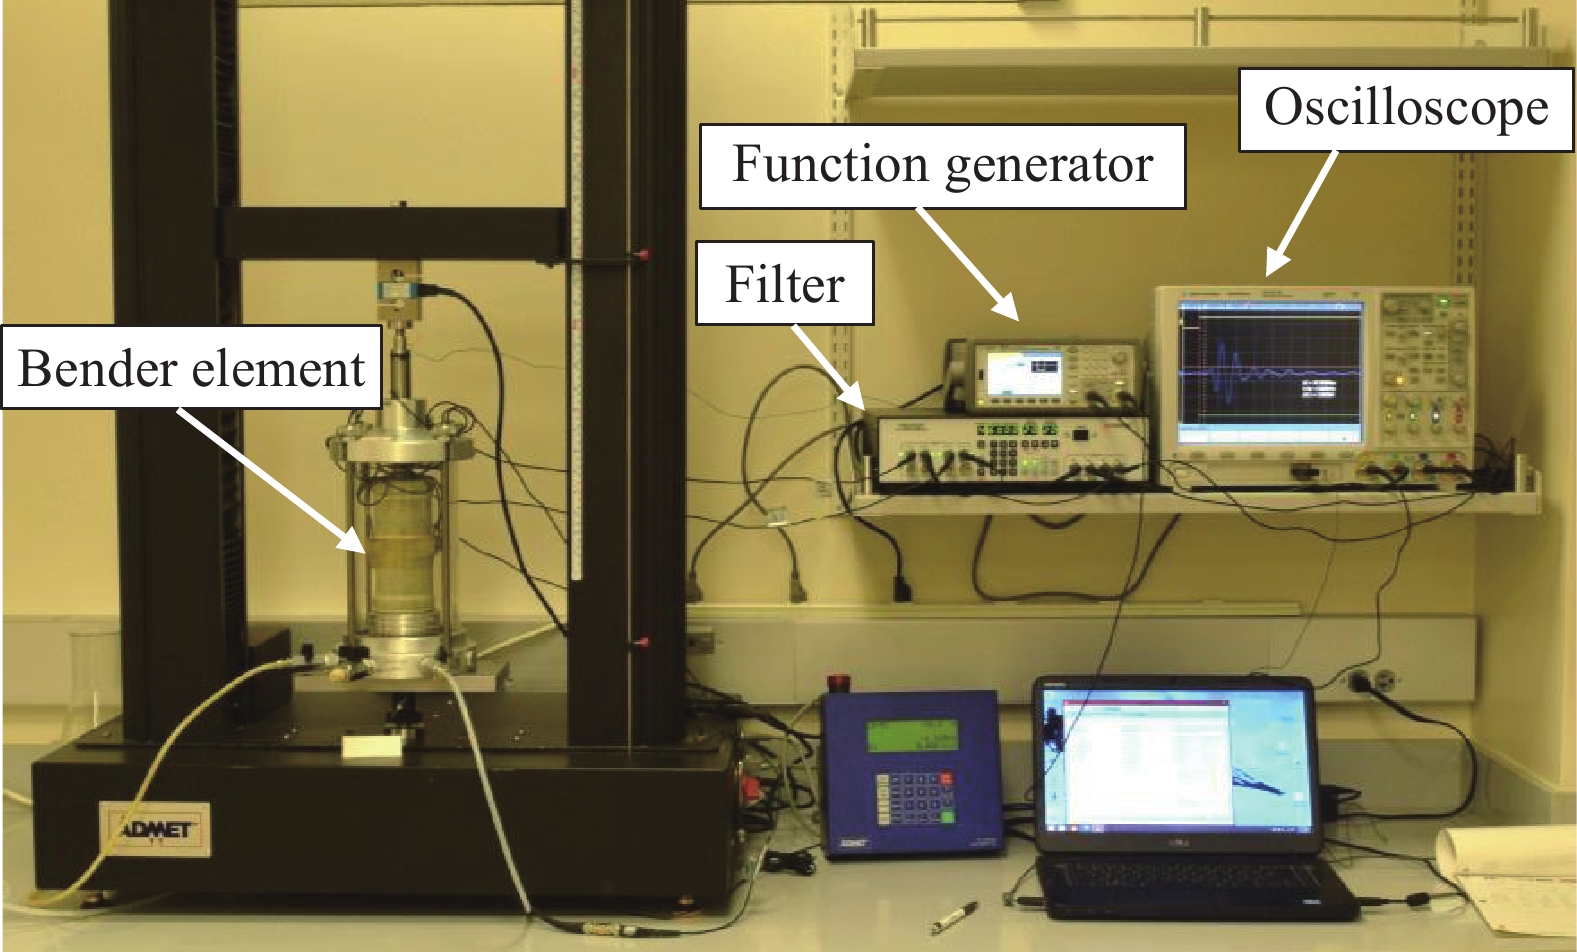
The wave velocity measurement setup consists of wave propagation test and tri-axial test systems (Figure 3). The wave propagation test system includes a Function Generator (Agilent model 33521A), a power amplifier with Filter (Krohn-Hite model 3364) and a Mixed Signal Oscilloscope (Agilent model 70104B). The tri-axial test system includes a tri-axial chamber, a loading applied part and control system (ADMET).

|
Figure 3 Wave velocity measurement setup |
A pair of bender elements were attached to the middle of the sample to test horizontal shear wave velocities. After the samples with BEs were placed in the tri-axial chamber, a wave propagation test was performed without confining pressure. Then, the isotropic confining pressure of 100, 200, 300 or 400 kPa were applied and tested sequentially.
During the wave propagation tests, a step waveform was chosen as input signal which included all frequencies without the need to know the resonant frequencies of the soil sample (Lee and Santamarina, 2005). Therefore, a step signal with peak-to-peak amplitude of 5 volts was generated by using of Function Generator. The received signal was filtered by a bandpass Filter with a bandwidth frequency ranging from 500 Hz to 60 kHz, and the output signal was amplified to 20 dB. The filtered and amplified wave signal data was acquired by the Oscilloscope and compared with the excitation signal for travel time measurement.
3 Experimental results and discussion 3.1 Shear waveform characteristicsStep signal with 5 V peak to peak is transduced, and the typical received waveforms with various confining pressure for thawed silt and sand are presented in Figure 4. One can observe that the periodic shear wave is received, and the amplitude reduced gradually with increasing of time. Moreover, the amplitude of waveform for thawed silty permafrost attenuates sharply after about 2,000 μs, but still present a stronger signal for thawed sandy permafrost.

|
Figure 4 Typical waveforms with various confining pressure for thawed silty (left) and sandy permafrost (right) |
The first smaller peak, so-called the near-field effect (Dyvik and Madshus, 1985; Viggiani and Atkinson, 1995; Brignoli et al., 1996; Wang et al., 2007b ), is observed for all of thawed permafrost. The reason is that the tip-to-tip distance between two sensors is smaller than two times wave length (Wang et al., 2007b ). Therefore, the first arrival of shear wave is determined by first crossing zero herein (Lee and Santamarina, 2005), with the various first arrival points marked on Figure 4. Note that the first arrival time decreases with increasing of confining pressure, and it is found that travel time for thawed sandy permafrost is smaller than thawed silt.
3.2 Shear wave velocityThe Time Domain Analysis Method is used in this research. The wave velocity is calculated using the following equation:
|
$V = \frac{L}{{\Delta t}} = \frac{L}{{t - {t_0}}}$
|
(1) |
where V is wave velocity, L is travel distance, Δt is net travel time, t is total travel time, and t0 is system delay.
The travel distance is determined by measuring the tip-to-tip distance between the transmitting and receiving sensors (Pennington et al., 2001 ; Leong et al., 2005 ). The system delay includes two parts: the first is transmit time of signal during the electric system, which can be determined when the tip of transmit BEs contact the tip of receive BEs. The second is transmit time for samples covered with rubber. To determine this time, two tests should be conducted on the same sample. One test is performed on covered rubber sample, and the other test is performed on uncovered rubber sample. The difference between the two tested times is the sum of the delay time in rubber and in an electrical system.
Figure 5 shows variation of the S-wave velocity with confining pressure increasing from 0 kPa to 400 kPa for thawed silty and sandy permafrost. One can observe from Figure 5 that the S-wave velocity increases with increasing confining pressure, especially for sandy soils. The S-wave velocity for thawed silty soil increases from 133~360 m/s without confining pressure of 164~434 m/s, at the confining pressure of 400 kPa the average increasing specific ratio is about 1.4. The S-wave velocity for thawed sandy soil increases from 76~136 m/s without confining pressure of 220~435 m/s, at the confining pressure of 400 kPa the average increasing specific ratio is 3.4.

|
Figure 5 Variation of S-wave velocity with confining pressure for thawed permafrost |
Previous research on S-wave velocity for silt and sand have been performed. Park and Lee (2014) found the S-wave velocity is affected by confining stress caused by lateral restraint, and S-wave velocity is in the range of 250 to 300 m/s for sand-silt mixture. Youn et al. (2008) found that the S-wave velocity for saturated silica sand is in the range of 180 m/s to 220 m/s at confining pressure of 50 kPa, and 280 m/s to 350 m/s at confining pressure 400 kPa. Cai et al. (2015) found the S-wave velocity for clean Nanjing sand without fine particles in the range of 180 m/s to 290 m/s. Thus, confining pressure and saturate degree may play a significant effect on the shear wave velocity. From Table 1, the saturate degree of most thawed samples is about 80%, which is the main reason why measured wave velocities are greater than the aforementioned experimental tests. A few measured wave velocities were smaller than the afroementioned experimental tests result, which may be related to uniform fabric and ice lens of thawed natural permafrost samples (Figure 6).

|
Figure 6 Typical fabric for thawed silty and sandy permafrost |
Based on the elastic wave propagation theory, the shear modulus can be evaluated by the following equations (Vinson, 1978):
|
$G = \rho V_s^2$
|
(2) |
where G is shear modulus, Vs is S-wave velocity, and ρ is mass density.
3.3.1 Effect of confining pressureFigure 6 shows variation of the shear modulus with confining pressure increasing from 0 kPa to 400 kPa for thawed silty and sandy permafrost. One can observe from Figure 6 that the shear modulus increases with increasing confining pressure for silty soil, and sharply increases for sandy soils. The shear modulus for thawed silty soil increases from 55~260 MPa without confining pressure of 80~378 MPa, at the confining pressure of 400 kPa the average increasing specific ratio is about 1.9. The shear modulus for thawed sandy soil increases from 11~35 MPa without confining pressure of 89~340 MPa, at the confining pressure of 400 kPa the average increasing specific ratio is about 12.

|
Figure 6 Variation of shear modulus with confining pressure for thawed permafrost |
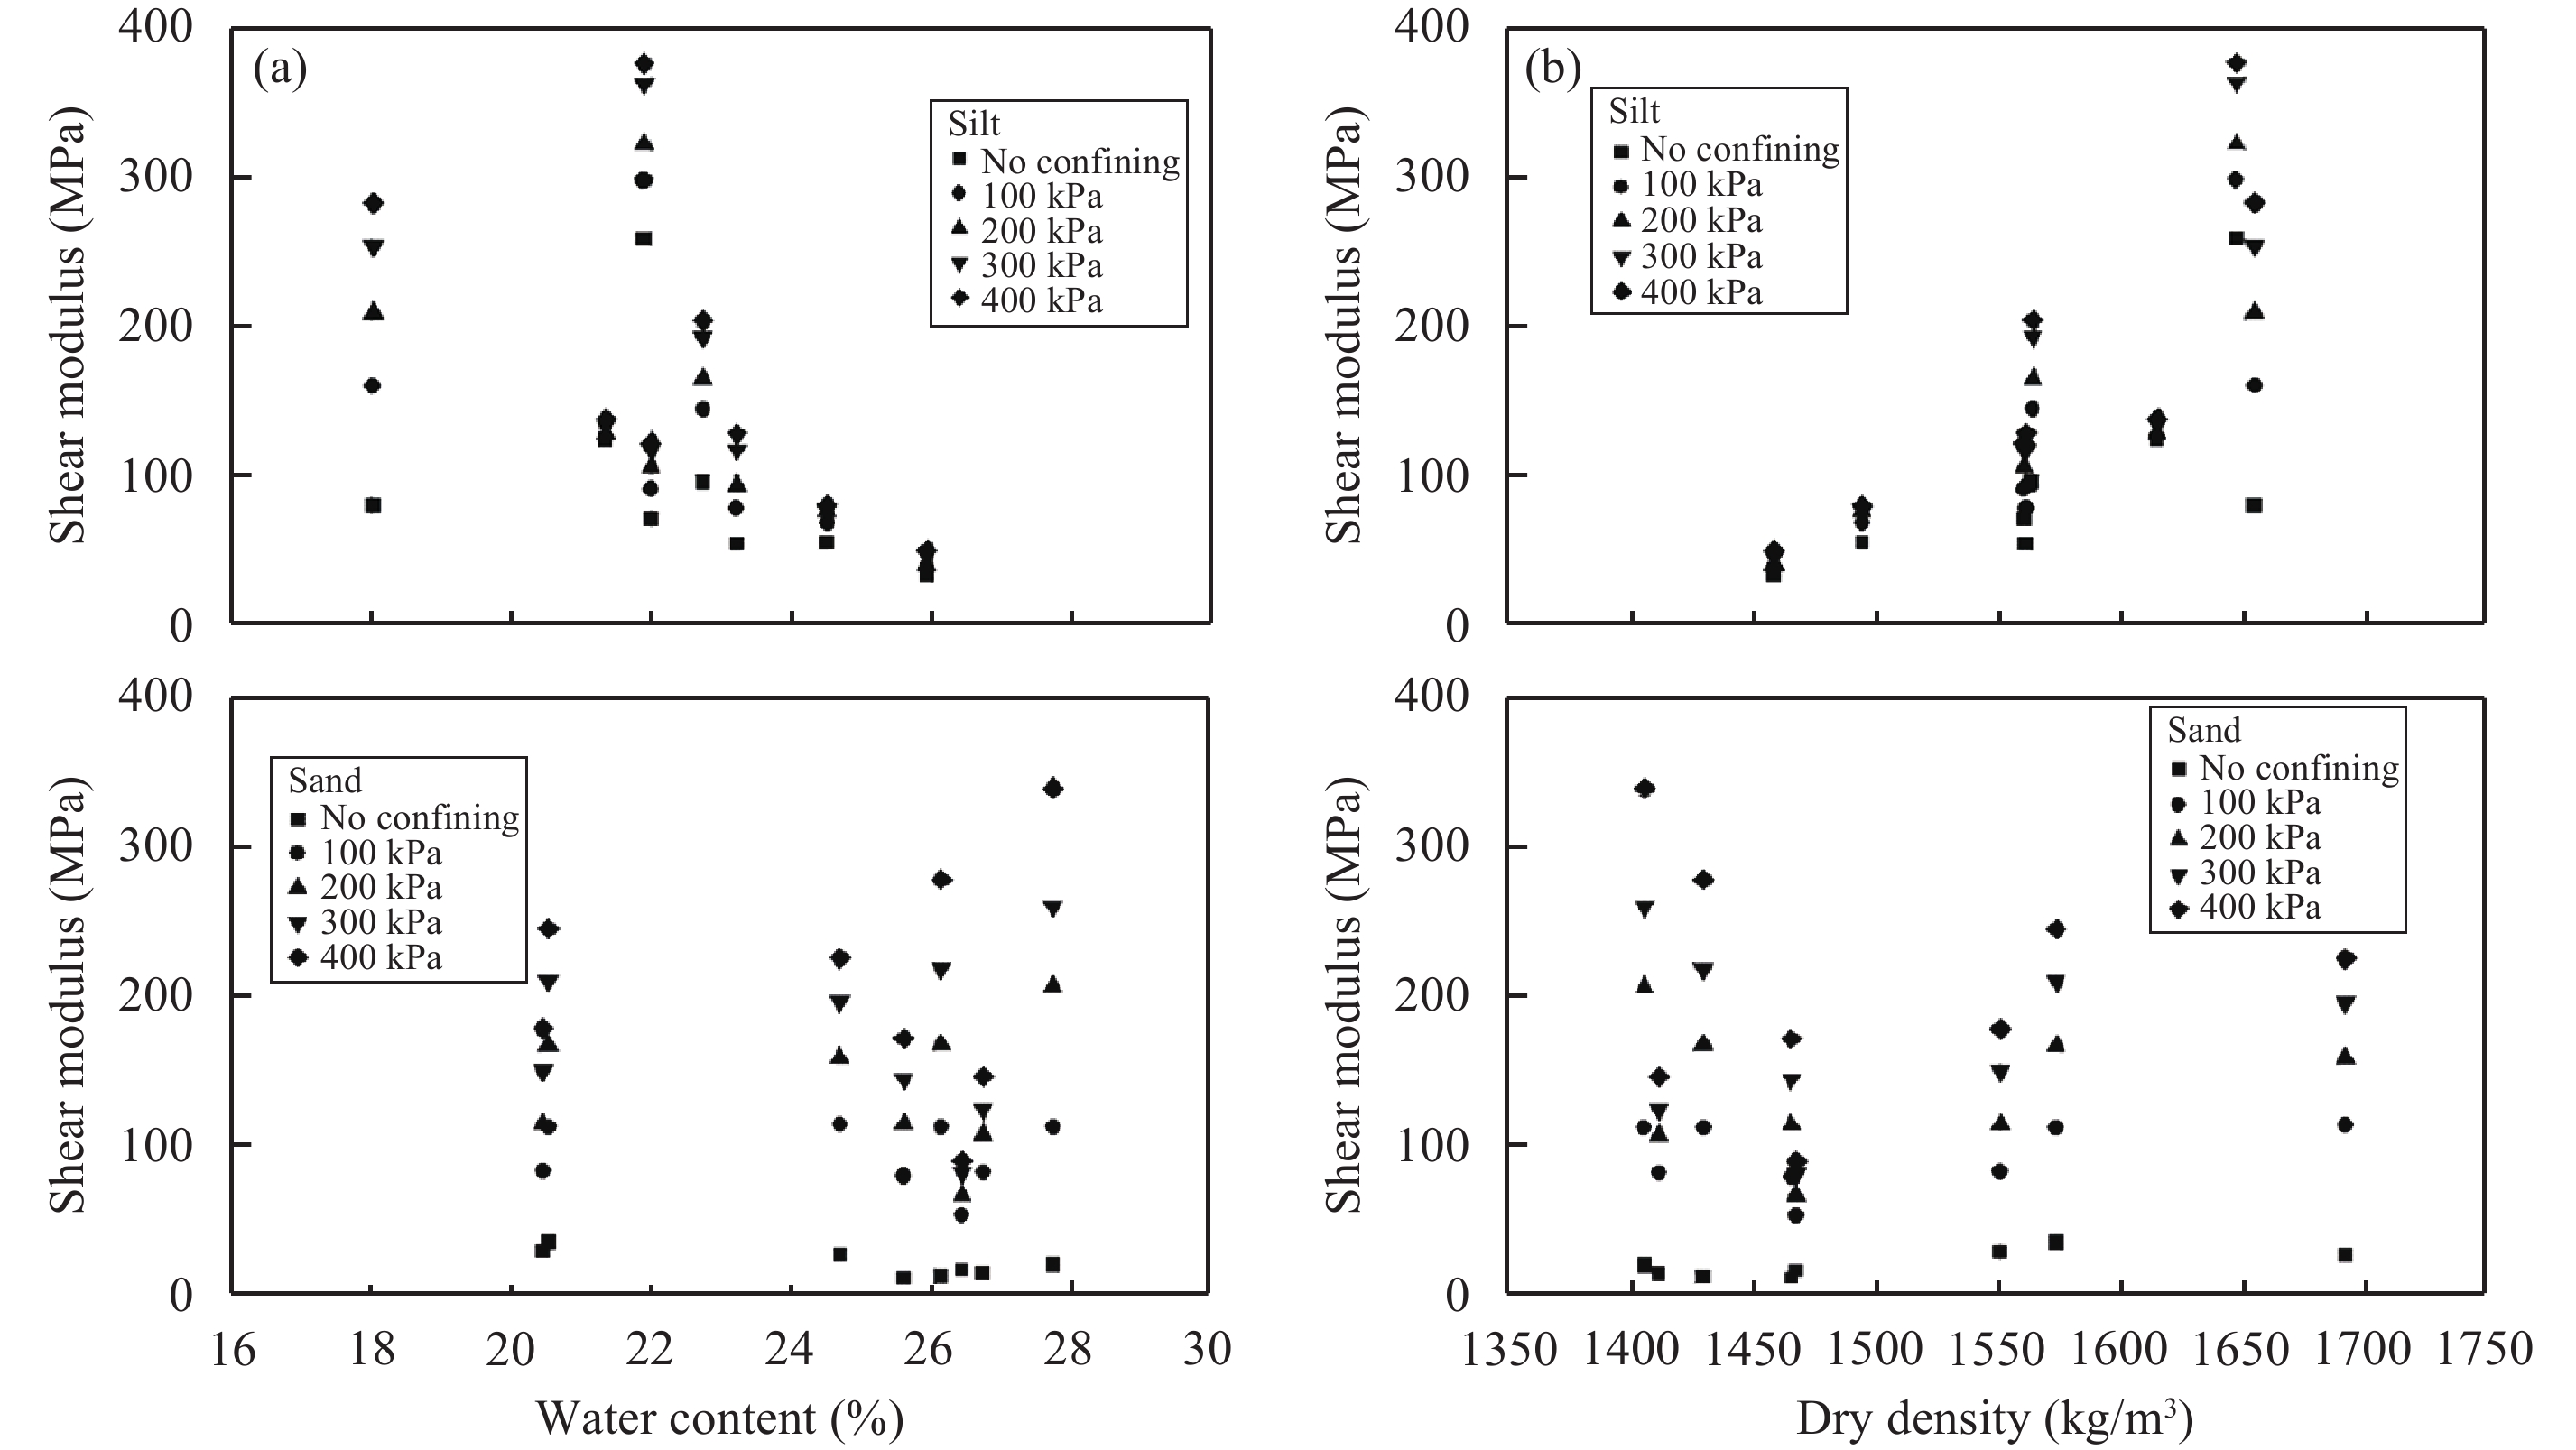
Water content is one of crucial factors that affect the modulus. Figure 7 shows variation of the shear modulus with water content and dry density for thawed silty and sandy permafrost. One can observe from Figure 7a that the shear modulus for silt presents an obviously decreasing tendency with increasing water content ranging of 18%~26%. However, the shear modulus for sandy soil presents a weaker decreasing tendency than silty soil. Similar to Figure 7a, Figure 7b shows that the shear modulus for silt presents an increasing tendency with increasing dry density ranging of 1,450~1,650 kg/m3. However, the shear modulus for sandy soil presents a weaker decreasing tendency than silty soil.

|
Figure 7 Variation of shear modulus with water content and dry density for thawed silty and sandy permafrost |
Numerous empirical equations were proposed by considering the effects of water content, dry density and stress state (Dunlap, 1963; Uzan, 1985; NCHRP, 2003; Zhang et al., 2015 ). Janbu's Model (1963) was used firstly to fit regression formulation from 100 kPa to 400 kPa.
|
$G = {k_1} \cdot {P_a} \cdot {\left({\frac{{{\sigma _3}}}{{{P_a}}}} \right)^{{k_2}}}$
|
(3) |
where, G is shear modulus (kPa), Pa is a reference pressure generally taken as 100 kPa, k1 and k2 are regression coefficients.
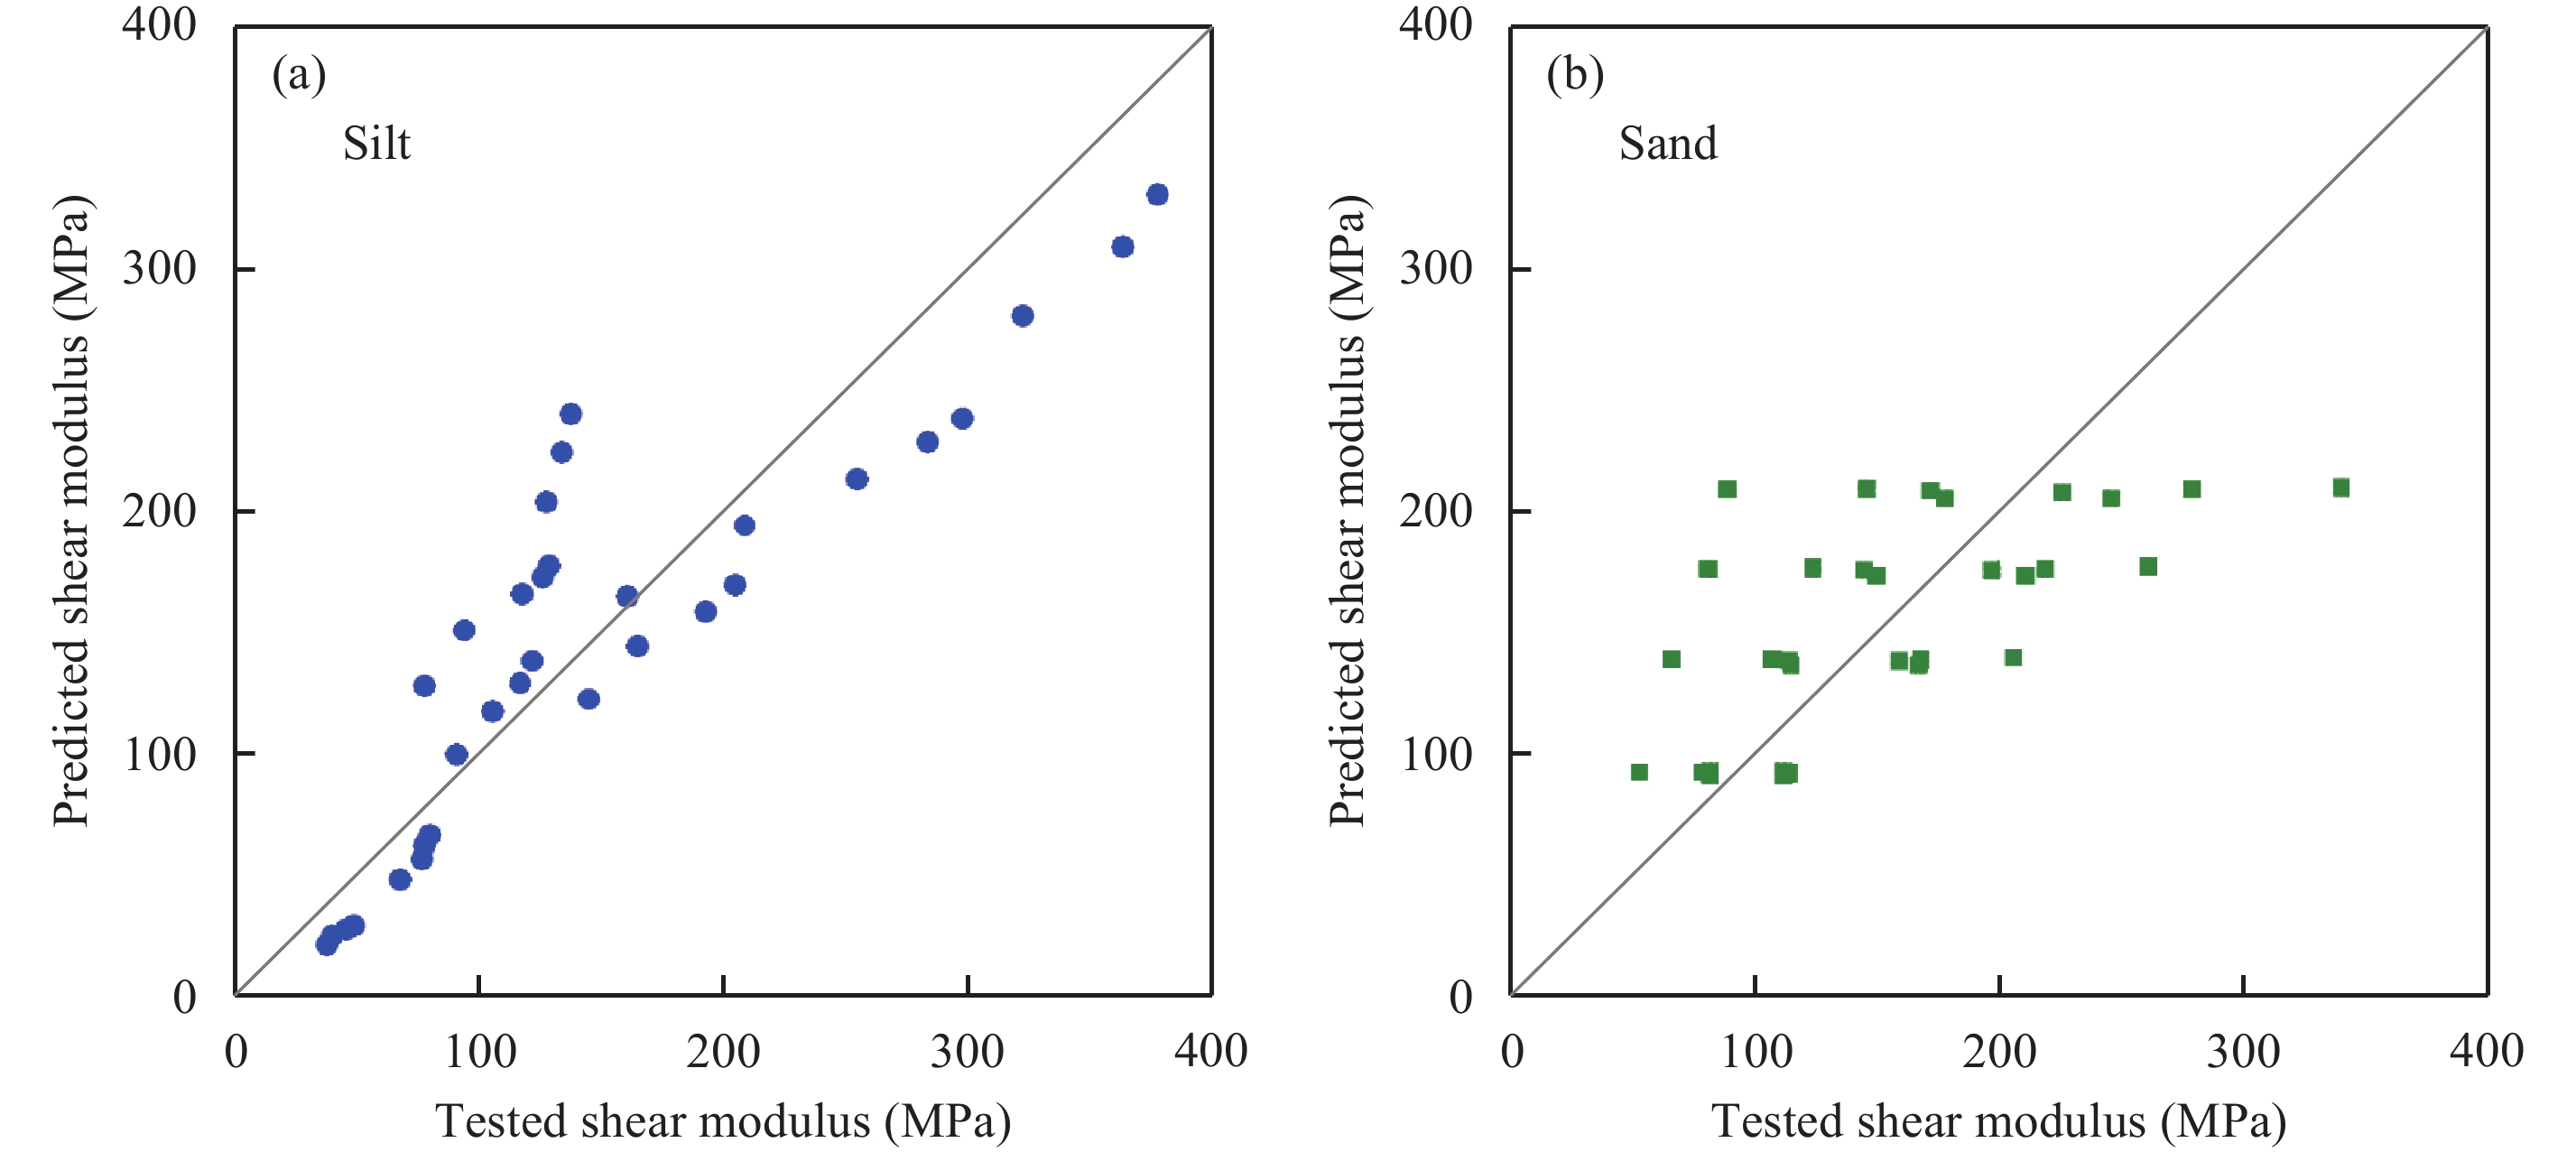
Table 2 shows the regression coefficients of shear modulus for thawed silt and sand. One can observe that Janbu's Model could obtain a good fit for each thawed silt and sand. Average value of k1 and k2 for silt is 1,241 and 0.23, while 923 and 0.56 for sand, respectively. As studied above, the water content and dry density present stronger effects on shear modulus for silt, but only water content presents weaker effects for thawed sand. Therefore, the Janbu Model parameter k1 could be determined by Equation (3). For Table 2 and Figure 8, it can be seen that the predicted data are in agreement with the measured shear modulus.
|
${k_1} = {A_1}{\gamma _d} + {B_1}w + {C_1}$
|
(4) |
where, γd is dry density (kg/m3), w is water content, σ3 is confining pressure (kPa), A1, B1, and C1 is regression coefficient, respectively.
|
|
Table 2 Regression coefficients of shear modulus for thawed silty and sandy permafrost |

|
Figure 8 Comparison of shear modulus from tested and regression-model prediction |
Shear wave velocity and shear modulus of thawed natural silty and sandy permafrost, sampled from the North Slope of Alaska, were investigated based on the bender elements. The effects of confining pressure, water content and dry density were analyzed and discussed. The following conclusions can be made based on analyses of the test results:
(1) The water content ranges from 18.02% to 25.93% for thawed silty soils, and from 20.42% to 27.70%. The salinity varies significantly from 7.5 ppt to 28.0 ppt for silty specimens, and a range of 0.5 ppt to 5.0 ppt for sand. The bulk density range is 1,836 kg/m3 to 2,007 kg/m3 for silty soils, and 1,788 kg/m3 to 2,108 kg/m3 for sandy soils.
(2) Confining pressure increases from 0 kPa to 400 kPa per 100 kPa, shear wave velocities increase from 133~360 m/s to 164~434 m/s for thawed silt, and from 76~136 m/s to 220~435 m/s for thawed sand. The average increasing specific ratio is about 1.4 and 3.4, respectively.
(3) Water content and dry density have strong effects on shear modulus for thawed silt, and the shear increases with decreasing water content and increasing dry density. However, these two factors present a weaker effect for thawed sand permafrost.
(4) Janbu Model parameters were obtained for each sample, k1 and k2 for silt is 1,241 and 0.23, while 923 and 0.56 for sand. A modified model to predict the shear modulus is proposed, the model parameters and comparison between measured and prediction were presented.
Acknowledgments:The authors gratefully acknowledge the financial support from ConocoPhillips Alaska, Inc., BP Alaska, ExxonMobil and Chevron. The authors are thankful to Mrs. Lynn Aleshire for their support and technical discussions provided during the project, also grateful to Dr. Jong-Sub Lee, Korea University, for his advice on the bender element fabrication and signal processing.
Alkire BD, 1977. Generalized thaw settlement of soil. In: Proceedings of the 15th Annual Engineering Geology and Soils Engineering Symposium. Idaho State: Idaho State University, pp. 133–147.
|
Andersland OB, Ladanyi B, 2004. Frozen Ground Engineering. 2nd Ed.. Hoboken, NJ: John Wiley and Sons, Inc.
|
Bellotti R, Jamiolkowski M, Lo presti DCF, et al. 1996. Anisotropy of small strain stiffness in Ticino sand. Geotechnique, 46(1): 115-131. DOI:10.1680/geot.1996.46.1.115 |
Berg RL, Bigl SR, Stark JA, et al., 1996. Resilient modulus testing of materials from MN/ROAD, phase 1. Special Report No. 96–19. Hanover, NH, USA: US Army Cold Regions Research and Engineering Laboratory, pp. 1–20.
|
Brown RJE, 1970. Permafrost in Canada. Toronto: University of Toronto Press.
|
Cai YQ, Dong QY, Wang J, et al. 2015. Measurement of small strain shear modulus of clean and natural sands in saturated condition using bender element test. Soil Dynamics and Earthquake Engineering, 76: 100-110. DOI:10.1016/j.soildyn.2014.12.013 |
Dunlap WS, 1963. A report on a mathematical model describing the deformation characteristics of granular materials. Technical Report 1, Project 2-8-62-27. Texas: Texas A&M University.
|
Dyvik R, Madshus C, 1985. Lab measurements of Gmax using bender elements. In: Proceedings of the Conference on the Advances in the Art of Testing Soils under Cyclic Conditions. New York: ASCE Geotechnical Engineering Division, pp. 186–196.
|
Goodman MA, 1978. Handbook of Arctic Well Completions. Houston: Gulf Publishing Company.
|
Graham J, Au VCS. 1985. Effects of freeze-thaw and softening on a natural clay at low stresses. Canadian Geotechnical Journal, 22(1): 69-78. DOI:10.1139/t85-007 |
Ishikawa T, Ozaki Y, Miura S. 2008. Influence of freeze-thaw action on mechanical behavior of crushable volcanic coarse-grained soils. Doboku Gakkai Ronbunshuu C, 64(3): 712-717. DOI:10.2208/jscejc.64.712 |
Lee JS, Santamarina JC. 2005. Bender elements: performance and signal interpretation. Journal of Geotechnical and Geoenvironmental Engineering, 131(9): 1063-1070. DOI:10.1061/(ASCE)1090-0241(2005)131:9(1063) |
Leong EC, Yeo SH, Rahardjo H. 2005. Measuring shear wave velocity using bender elements. Geotechnical Testing Journal, 28(5): 488-498. DOI:10.1520/GTJ12196 |
Li SY, Lai YM, Zhang MY, et al. 2007. Study on distribution laws of elastic modulus and strength of warm frozen soil. Chinese Journal of Rock Mechanics and Engineering, 26(S2): 4299-4305. |
Ling XZ, Xu XY, Xu CH, et al. 2002. Study on frozen Harbin silty clay through its measuring tests to ultrasonic velocity. Chinese Journal of Geotechnical Engineering, 24(4): 456-459. DOI:10.3321/j.issn:1000-4548.2002.04.010 |
Ling XZ, Zhang F, Li QL, et al. 2015. Dynamic shear modulus and damping ratio of frozen compacted sand subjected to freeze-thaw cycle under multi-stage cyclic loading. Soil Dynamics and Earthquake Engineering, 76: 111-121. DOI:10.1016/j.soildyn.2015.02.007 |
Liu JK, Wang TL, Tian YH. 2010. Experimental study of the dynamic properties of cement- and lime-modified clay soils subjected to freeze-thaw cycles. Cold Regions Science and Technology, 61(1): 29-33. DOI:10.1016/j.coldregions.2010.01.002 |
NCHRP, 2003. Procedure for resilient modulus of unstabilized aggregate base and subgrade materials. Project 1-28A. Washington D.C.: Transportation Research Board.
|
Nixon JF, Hanna AJ. 1979. The undrained strength of some thawed permafrost soils. Canadian Geotechnical Journal, 16(2): 420-427. DOI:10.1139/t79-044 |
Ogata N, Kataoka T, Komiya A, 1985. Effect of Freezing-thawing on the mechanical properties of soil. In: Proceedings of the 4th International Symposium on Ground Freezing. Sapporo, Japan, pp. 5–7.
|
Park JH, Lee JS. 2014. Characteristics of elastic waves in sand-silt mixtures due to freezing. Cold Regions Science and Technology, 99: 1-11. DOI:10.1016/j.coldregions.2013.11.002 |
Pennington DS, Nash DFT, Lings L. 2001. Horizontally mounted bender elements for measuring anisotropic shear moduli in triaxial clay specimens. Geotechnical Testing Journal, 24(2): 133-144. DOI:10.1520/GTJ11333J |
Ponomarev VD, Sorokin VA, Fedoseev YG. 1988. Compressibility of sandy permafrost during thawing. Soil Mechanics and Foundation Engineering, 25(3): 124-128. DOI:10.1007/BF01709717 |
Shirley DJ, Hampton LD. 1978. Shear-wave measurements in laboratory sediments. The Journal of the Acoustical Society of America, 63(2): 607-613. DOI:10.1121/1.381760 |
Simonsen E, Janoo VC, Isacsson U. 2002. Resilient properties of unbound road materials during seasonal frost conditions. Journal of Cold Regions Engineering, 16(1): 28-50. DOI:10.1061/(ASCE)0887-381X(2002)16:1(28) |
Smith RE, Clegg MW, 1971. Analysis and design of production wells through thick permafrost. In: Proceedings of the 8th World Petroleum Congress. Moscow: World Petroleum Congress, pp. 379–389.
|
Smith RE. 1983. Development of petroleum reserves in arctic Alaska: a brief discussion. Cold Regions Science and Technology, 7: 195-199. DOI:10.1016/0165-232X(83)90066-6 |
Tong CJ, Chen EY. 1987. Thaw-consolidation behavior of seasonally frozen soils. Journal of Glaciology and Geocryology, 9(3): 221-228. |
Tsytovich NA, 1975. The Mechanics of Frozen Ground. New York: McGraw-Hill Book Company.
|
Uzan J, 1985. Characterization of granular material. Transportation Research Record 1022. Washington D.C.: Transportation Research Board, pp. 52–59.
|
Viggiani G, Atkinson JH. 1995. Interpretation of bender element tests. Geotechnique, 45(1): 149-154. DOI:10.1680/geot.1995.45.1.149 |
Vinson TS, 1978. Response of frozen ground to dynamic loadings. In: Andersland OB, Anderson DM (eds.). Geotechnical Engineering for Cold Regions. New York: McGraw-Hill Book Company, pp. 405–458.
|
Wang DY, Ma W, Niu YH, et al. 2007a. Effects of cyclic freezing and thawing on mechanical properties of Qinghai-Tibet clay. Cold Regions Science and Technology, 48(1): 34-43. DOI:10.1016/j.coldregions.2006.09.008 |
Wang YH, Lo KF, Yan WM, et al. 2007b. Measurement biases in the bender element test. Journal of Geotechnical and Geoenvironmental Engineering, 133(5): 564-574. DOI:10.1061/(ASCE)1090-0241(2007)133:5(564) |
Watson GH, Slusarchuk WA, Rowley RK. 1973. Determination of some frozen and thawed properties of permafrost soils. Canadian Geotechnical Journal, 10(4): 592-606. DOI:10.1139/t73-055 |
Youn JU, Choo YW, Kim DS. 2008. Measurement of small-strain shear modulus Gmax of dry and saturated sands by bender element, resonant column, and torsional shear tests
. Canadian Geotechnical Journal, 45(10): 1426-1438. DOI:10.1139/T08-069 |
Zhang F, Jin RX, Feng DC, et al., 2015. Mechanical properties and an empirical model of compacted silty clay subjected to freeze-thaw cycles. In: Proceedings of International Symposium on Systematic Approaches to Environmental Sustainability in Transportation. Reston, VA, United States: ASCE, pp. 200–212.
|
Zhu YL, Zhang JY. 1982. Elastic and compressive deformation of frozen soils. Journal of Glaciology and Cryopedology, 4(3): 29-39. |
 2017, Vol. 9
