2. Linze Inland River Basin Research Station/Key Laboratory of Land Surface Process and Climate Change in Cold and Arid Regions, Northwest Institute of Eco-Environment and Resources, Chinese Academy of Sciences, Lanzhou, Gansu 730000, China;
3. Linze Inland River Basin Research Station/ Key Laboratory of Ecohydrology of Inland River Basin, Northwest Institute of Eco-Environment and Resources, Chinese Academy of Sciences, Lanzhou, Gansu 730000, China
In cotton (Gossypium hirsutum L.), the cluster planting pattern (3 plants per hole) is an alternative to the traditional planting pattern (1 plant per hole) that was conceived to increase yields and water use efficiency in arid regions where soil water evaporation and water leakage are substantial. Cluster planting produced 32.3% higher yields than traditional planting (Su et al., 2009 ). However, no studies have investigated what changes occur in crop growth to explain these yield differences. Many studies have found that higher-yield planting patterns were associated with more bolls per unit area. Increases in boll number, and ultimately yield, are influenced by assimilates available for boll production (Mason, 1992; Hearn, 1994; Vories and Glover, 2006). Charles-Edwards et al. (1986) found that boll size was smaller in the ultra-narrow row planting pattern, suggesting a limitation in assimilates available for boll growth. The increase in yield in the ultra-narrow row planting pattern could be due to either increased biomass accumulation or increased partitioning to reproductive growth.
Numerous studies have examined biomass accumulation or partitioning throughout the growing season in narrow-row planting patterns. Brodrick et al. (2012) found that early biomass accumulation was faster in the ultra-narrow row planting pattern than in conventionally spaced treatments but slowed later in the season, and the final total dry matter was not significantly different. Other studies have reported that the narrow-row planting pattern led to more crop dry matter (Jost and Cothren, 2001; Balkcom et al., 2010 ). Also, increased yield in the ultra-narrow row crops through increased partitioning of dry matter to reproductive growth has been reported (Best et al., 1997 ; Brodrick et al., 2012 ). However, changes in biomass production and partitioning are not consistent among planting patterns.
A detailed analysis of growth and physiological characteristics was used to identify key factors influencing yield in different planting patterns (San-oh et al., 2006 ; Gwathmey and Clement, 2010; Mattera et al., 2013 ), but research on biomass production and partitioning of cotton in cluster planting pattern was not carried out. In this study, the main objective was to determine whether differences in biomass accumulation or partitioning to reproductive growth during individual growth periods contributed to higher yield in the cluster planting pattern compared with the traditional planting pattern.
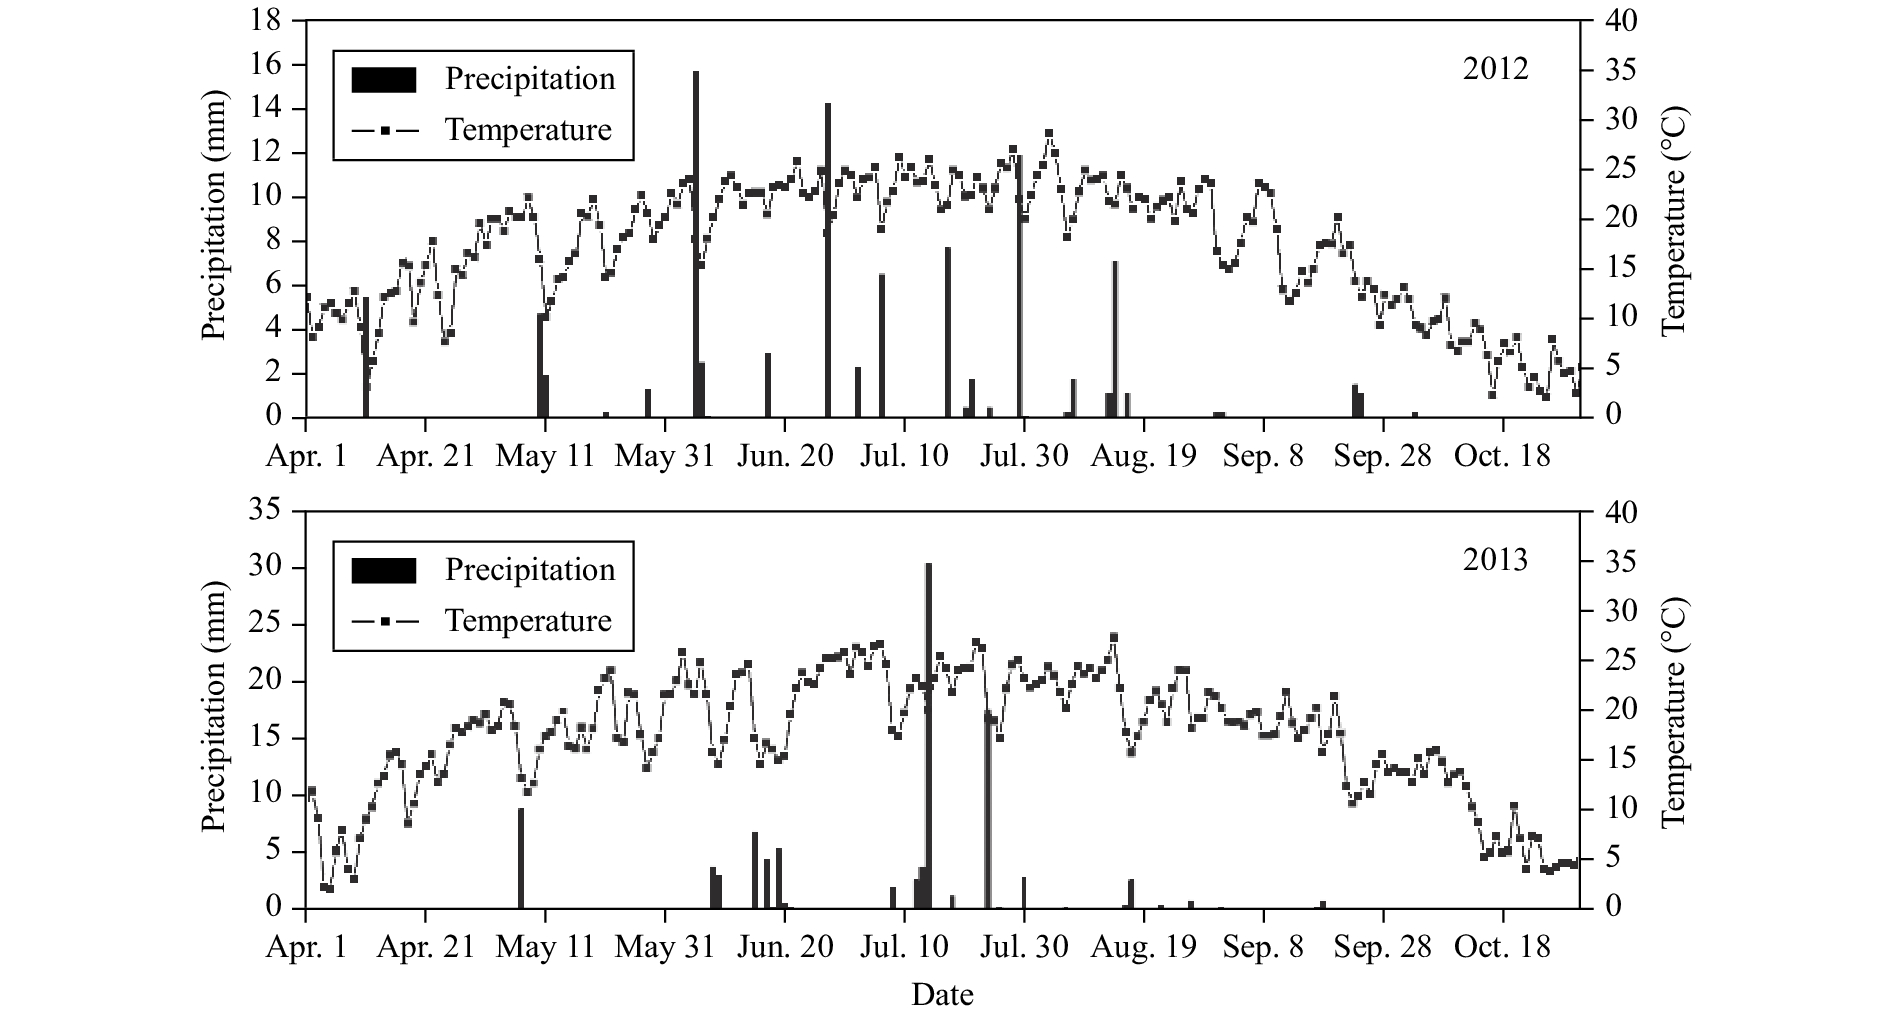
2 Materials and methods 2.1 Experimental siteA field experiment was conducted in 2012 and 2013 at the Linze Inland River Basin Research Station (39°21′N, 100°02′E, 1,400 m a.s.l.), which is located in the northern part of Linze, in the middle reach of the Hexi Corridor in Gansu Province, China. The site has an arid desert climate where the mean annual precipitation is 116.8 mm. The mean annual evaporation is 2,390 mm, 20 times higher than the precipitation. The average daily temperature is 7.6 °C, with a total range of 39.1 °C to −27.0 °C. The accumulated annual temperature ≥10 °C is 3,088 °C, and the frost-free period is 165 d. The main wind is northwesterly, and the windy season is from April to May, with an annual wind velocity of 3.2 m/s. There are about 15 d with heavy wind per year. The annual total number of sunlight hours is 3,045 h. The depth of frozen soil is about 10 m. During the growing season, precipitation was 98 mm in 2012 and 105 mm in 2013, the average daily temperature was 17.6 °C in 2012 and 17.7 °C in 2013 (Figure 1).

|
Figure 1 Precipitation and temperature during the cotton growing seasons in 2012 and 2013 |
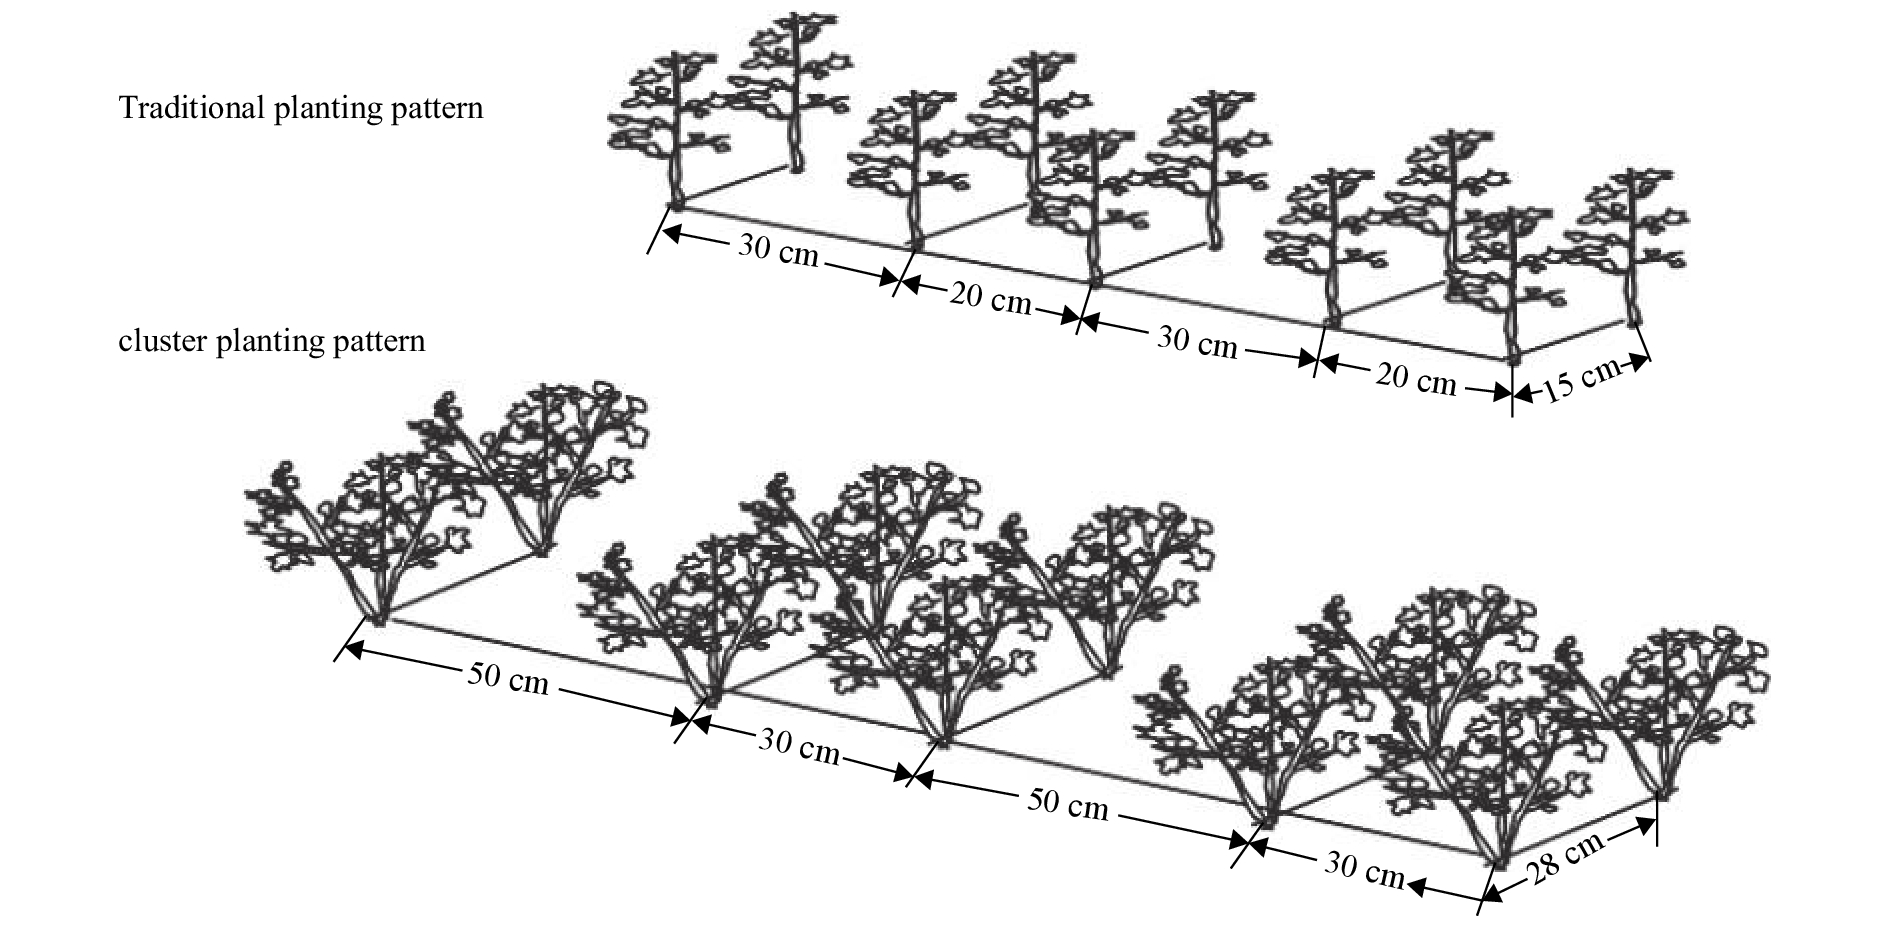
Traditional planting pattern (1 plant per hole) and cluster planting pattern (3 plants per hole) were compared in two growth seasons (2012 and 2013). The local traditional planting pattern with 30 cm between wide rows, 20 cm between narrow rows, and 15 cm between holes (26 plants per m2); the cluster planting pattern with 50 cm between wide rows, 30 cm between narrow rows, and 28 cm between holes (26 plants per m2) (Figure 2). Each planting pattern had 6 plots (replicates), and a total of 12 plots were arranged by a completely randomized plot design, the area of each plot was 16 m2 (4 m×4 m).

|
Figure 2 A schematic diagram showing cluster planting and traditional planting patterns |
The cultivar 'Xinluzao8', developed by the Institute of Cotton in Shihezi, Xinjiang, was sown in sandy soil in late April and harvested from the end of September to early October. Basal fertilizer of 112 kg·N/hm2 as urea and 56 kg P2O5/hm2 as diammonium phosphate were applied just before sowing. The same amounts were applied again at the squaring stage, and 56 kg·N/hm2 urea were applied at the bolling stage.
Irrigation was started after plant emergence on May 23 in 2012, and on May 20 in 2013, and was maintained at 65% of field capacity at soil depths of 0–80 cm, where most cotton roots can be found. The water was irrigated by flood irrigation and irrigation amounts were controlled by a water meter. Soil water content was checked gravimetrically every 2 days for 0–20, 20–40, 40–60, and 60–80 cm depths. The amount of supplemental irrigation in each plot was calculated by comparing the measured soil water content in the 0–80 cm soil depth with the 65% of field capacity. Total irrigation amounts during the growing seasons were 615 mm in 2012 and 585 mm in 2013. Before irrigation, the needed amount of supplemental irrigation (SI) was calculated with the following formula (Sidika et al., 2012 ):
| $SI = 0.01 \times BD \times H \times \left({{\theta _t} - {\theta _n}} \right)$ | (1) |
where SI (mm) is the amount of supplemental irrigation; BD (kg/m3) is bulk density; H (cm) is soil depth; θt is the soil water content at 65% of field capacity after supplemental irrigation; and θn is the measured value of soil water content before irrigation.
The value for θt was calculated as follows:
| ${\theta _t} = {\theta _{\max }} \times {\theta _{{\rm{tr}}}}$ | (2) |
where θmax (%) is the field capacity (FC), and θtr is the relative soil water content for each soil layer at 65% of field capacity.
2.3 Growth parametersAt harvest, 10 plants were selected for measuring growth parameters in each plot. Plant height was measured from cotyledon node to stem apex. Plant stem diameter was measured at 2 cm on top of the cotyledon node. The numbers of sympodia was counted in these 10 plants in each plot.
Leaf area index (LAI) was measured by destructive sampling. Leaf area was determined by measuring sub-samples (10 plants per plot which was also used to measure plant height and stem diameter) with a Li-Cor planimeter (Model LI-3100, LI-COR Inc., Lincoln, NE, USA). These samples were dried and weighed, and specific leaf area was determined (m2/g). LAI was calculated as the product of specific leaf area and the amount of leaf dry matter (g/m2), and the plants in 1-m2 were taken for leaf dry matter.
2.4 Yield and componentSix plots in cluster or traditional planting patterns were used for yield measurement; it was measured by hand picking all open bolls in a 9 m2 area in each plot. The number of bolls was recorded and seed cotton samples were ginned in a 10-saw gin. Seed cotton yield, lint yield (kg/hm2), lint percentage (%), lint per boll (g per boll), and average boll size (g seed cotton per boll) were calculated.
2.5 Biomass accumulationPlant samples (aboveground) were collected from 1 m2 in each plot in cluster or traditional planting patterns every 10 d before the first square. Total fresh biomass was measured, and six plants were used and partitioned into laminae, stems, squares, green bolls (flowers and unopened bolls), and open bolls (two or more sutures dehisced). The number of each fruit type was recorded. Partitioned samples were dried in an oven at 80 °C for at least 48 h and weighed. The first biomass harvest was taken when squaring started and the last after all bolls had opened. To account for the high synthesis cost of cotton fruit relative to vegetative tissue, biomass components were converted into glucose equivalents (Wall et al., 1994 ), expressed as g dry matter per m2. The conversions were 1.3807 (g glucose per g tissue) for leaves and squares, 1.4326 for stems, and 1.7636 for bolls. Glucose-adjusted total dry matter and total fruit dry matter (total number of squares, green bolls, and open bolls) were then derived.
2.6 Ratio of fruit to total dry matterThe final ratio of fruit dry matter to total aboveground dry matter was determined from the final biomass harvest in each treatment. For these analyses, the ratio of fruit to total dry matter included all fruit (squares, green bolls, and open bolls) converted to glucose equivalents.
2.7 Crop growth rateTo compare the dynamics of biomass production and partitioning, growth rates (dry matter g/(m2·d)) during all growth periods were compared among treatments for crops (accumulated total dry matter) and fruits (dry matter of squares, green bolls, and open bolls).
2.8 PartitioningTo test whether one treatment partitioned significantly more dry matter to fruit over time, a distribution ratio (DR), the ratio of the change in fruit dry matter to the change in total dry matter, was calculated for the interval between each sampling in the treatments.
2.9 Statistical analysisStatistic analyses were conducted using SPSS 16.0 (IBM, Chicago, IL, USA). The t-test was performed at different significance levels to determine whether differences existed between cluster and traditional planting treatments. All graphs were constructed using the Origin 8.0 software package (OriginLab, Guangzhou, China).
3 Results 3.1 Growth parametersCluster planting decreased plant height, but the stem diameter, leaf area index and numbers of sympodia was enhanced (Table 1). A combined analysis across two years shows that planting pattern treatments, years and planting pattern treatments × years had no significant effect on plant height. Planting pattern treatments and years had a significant effect on stem diameter and leaf area index (P <0.001). The number of sympodia show a significant difference under planting pattern treatments ( P <0.05).
|
|
Table 1 Effect of planting pattern treatments on cotton growth parameters |
In the analysis across two years, there was an increase in lint yield, final boll numbers and boll size in the cluster planting pattern compared to the traditional planting (Table 2). Seed cotton yield and lint percentage were numerically higher in the cluster planting pattern contributing to the increased lint yield compared with the traditional planting (Table 2). Effects of each factor of planting pattern treatments, years and planting pattern treatments × years interaction had significant effect on cotton yield and yield components (P <0.001) except of the interaction between planting pattern treatments and years on final boll numbers.
|
|
Table 2 Effect of planting pattern treatments on cotton yield and yield components |
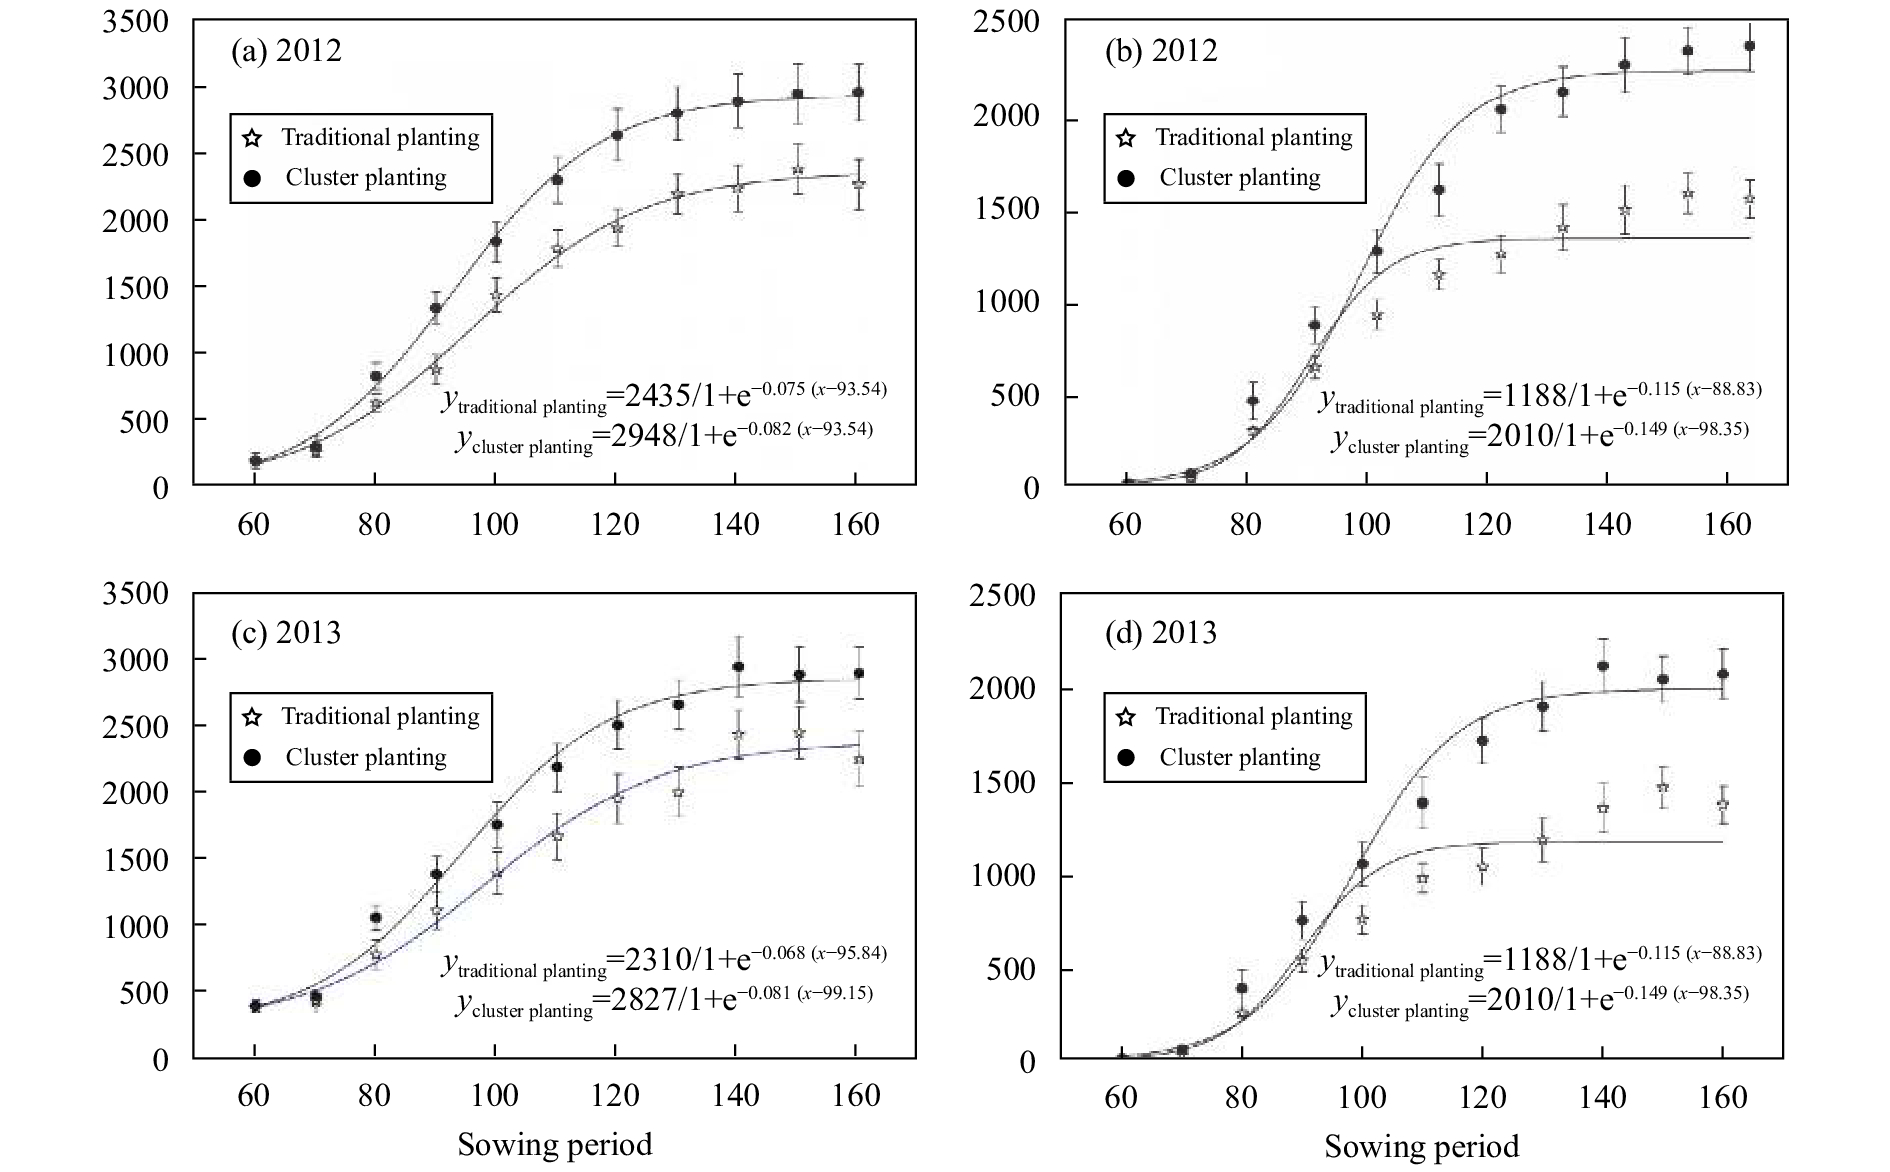
The patterns of total dry matter production were similar between traditional and cluster planting patterns. Total dry matter accumulated slightly earlier in cluster planting compared to the traditional planting pattern in each year (Figure 3). The cluster planting in 2012 had significantly higher total dry matter than the traditional planting at 90 days after sowing (DAS) (Figure 3a). In 2013 cluster planting total dry matter was significantly higher than the traditional planting at 80 DAS (Figure 3c).
The pattern of accumulation of fruit dry matter was similar in 2012 and 2013 (Figures 3b, 3d). The cluster planting had significantly higher fruit dry matter at 80 DAS than the traditional planting (Figures 3b, 3d).
The ratio of final fruit dry matter to final total dry matter was higher in the cluster planting than in the traditional planting, and there were significant differences between cluster planting and traditional planting in two years (Table 3). A combined analysis for the ratio across two years show extremely significant difference between cluster planting and traditional planting (P <0.001).

|
Figure 3 Total dry matter (a, c) and fruit dry matter accumulation (b, d) for cluster planting and traditional planting. Error bars are ± one standard error of the mean. The form of the logistic function was y=C/(1 + e−b(x−m)), where C is the upper asymptote, b is a measure of the slope and m represents the time of inflection, R2 values for all curves >0.90 |
|
|
Table 3 Mean and combined analysis means for final total dry matter, fruit dry matter and final ratio of fruit dry matter to total dry matter of cotton between cluster planting and traditional planting in two years |
The nonlinear regression analysis found significant differences in the growth curves between cluster and traditional planting for both total dry matter and fruit dry matter. Differences in the proportionality constants (b) in two years indicated that the relative crop growth rate was higher in cluster planting treatment than in the traditional planting (Figure 3). The cluster planting reached the point of inflection (m=97.04 in 2012 and 98.35 in 2013) later than the traditional planting (m=89.03 in 2012 and 88.83 in 2013), indicating that growth slowed later in cluster planting.
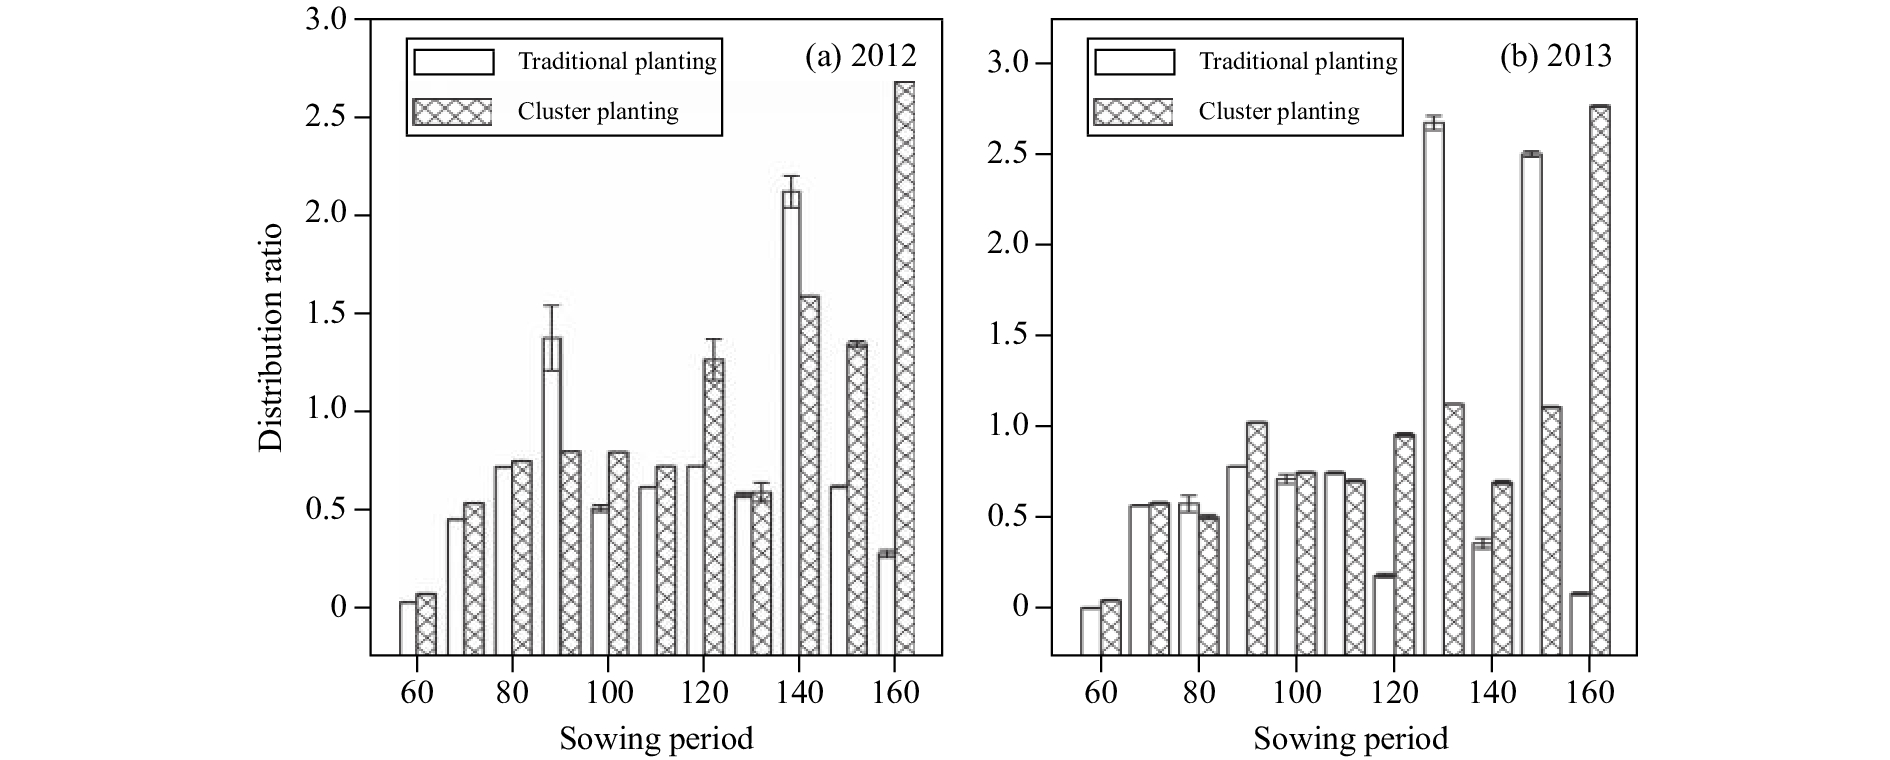
3.5 PartitioningThere were some significant differences in fruit distribution ratios (DR) between cluster planting and traditional planting in two years (P <0.05) ( Figure 4). In 2012 the cluster planting treatment partitioned significantly more of the current increment of dry matter to fruit than the traditional planting at 60 DAS (cluster planting DR=0.071; traditional planting DR=0.028; P <0.001), 70 DAS (cluster planting DR=0.53; traditional planting DR=0.448; P <0.001), 80 DAS (cluster planting DR=0.745; traditional planting DR=0.715; P <0.001), 100 DAS (cluster planting DR=0.791; traditional planting DR=0.503; P <0.001), 110 DAS (cluster planting DR=0.718; traditional planting DR=0.612; P <0.001), 120 DAS (cluster planting DR=1.264; traditional planting DR=0.718; P <0.01), 150 DAS (cluster planting DR=1.343; traditional planting DR=0.614; P <0.001) and 160 DAS (cluster planting DR=2.677; traditional planting DR=0.272; P <0.001). In 2013 the cluster planting treatment partitioned significantly more of the current increment of dry matter to fruit than the traditional planting at 60 DAS (cluster planting DR=0.066; traditional planting DR=0.024; P <0.001), 70 DAS (cluster planting DR=0.595; traditional planting DR=0.581; P <0.05), 90 DAS (cluster planting DR=1.309; traditional planting DR=0.796; P <0.001), 120 DAS (cluster planting DR=0.972; traditional planting DR=0.202; P=0.042), 140 DAS (cluster planting DR=0.709; traditional planting DR=0.275; P <0.001), and 160 DAS (cluster planting DR=2.779; traditional planting DR=0.103; P <0.001).

|
Figure 4 Comparison of distribution ratios (DR) between cluster planting and traditional planting. Each data point represents biomass partitioning to reproductive dry matter from 60 days after sowing to harvest time (10 days intervals) |
The aim of this study was to determine whether increased cotton lint yield in the cluster planting pattern relative to the traditional pattern was a result of differences in biomass production or in the partitioning of biomass to reproductive growth. In this study, despite a same plant density for cluster planting and traditional planting patterns, the numbers of sympodia, boll size and final dry matter production were significantly higher in the cluster planting pattern than in the traditional planting pattern, the higher biomass per plant in cluster planting indicated that facilitation between plants promoted the assimilation of nutrients for growth. This is in contrast to the results of other studies, such as Gwathmey and Clement (2010) which found that the ultra-narrow row planting pattern had lower boll set and lower stem starch reserves than conventionally spaced rows. Smaller individual plant sizes at high planting densities have been found in many other crops (Yoda et al., 1963 ) and in ultra-narrow row spaced cotton (Jost and Cothren, 2001; Vories et al., 2001 ; Marois et al., 2004 ; Nichols et al., 2004 ). The reason for the difference between our results and other studies maybe as follows: although the three cotton plants were planted in a hole in cluster planting, they were distributed in three directions according to our thinning, and the canopy microclimate was better than in the traditional planting (Xie et al., 2016 ), this environmental condition is beneficial for cotton photosynthesis, while the distribution of bolls were scattered in cluster planting, implying that photosynthate can been evenly allocated to each organ.
Positive interactions among individuals in cluster planting also increased cotton growth rates. The cluster-planted cotton had a higher growth rate during all growth periods, with a significant difference in peak crop growth rate relative to traditional planting. As the slowing of crop growth rate was later in the cluster planting compared with the traditional planting (Figure 3), the cluster planting pattern produced more final total dry matter than did traditional planting by the end of the season.
Biomass production is a prerequisite for cotton yield (Bange and Milroy, 2004). Brodrick et al. (2012) found a higher rate of biomass accumulation in ultra-narrow row cotton relative to conventionally-spaced plants early in the season but not later, perhaps because of increased competition among plants for limiting resources earlier than in the conventionally-spaced crop. In this study, the biomass accumulation rates in the cluster planting during all growth periods were higher than in the traditional planting pattern because of positive interactions among plants. These interactions in the cluster planting pattern allowed plants to efficiently use nutrition and water in an arid region, thus promoting plant growth.
Biomass partitioning to reproductive organs determines yield (Fang et al., 2009 ). The higher economic yield in the cluster planting pattern was due to greater partitioning to reproductive growth per unit area. The DR was higher in the cluster planting plots than the traditional ones during the same period, and the final ratio of fruit to total dry matter was significantly different between traditional and cluster plantings. This increase in partitioning to fruit was due to more and larger bolls in the cluster planting plots, indicating that more fruit dry matter per unit area was acquired in this pattern. This increased partitioning to reproductive growth has been reported in other planting patterns (Best et al., 1997 ; Jost and Cothren, 2000, 2001; Brodrick et al., 2012 ). Best et al. (1997) found that as row spacing decreased, partitioning to fruit increased. Thus, the positive intraspecific interactions in the cluster planting pattern cause more photosynthate to be transferred to reproductive tissue.
5 ConclusionThe results of this study indicate that the cluster planting pattern (3 plants per hole) produced higher yields than the traditional planting pattern (1 plant per hole) because of increased partitioning of total dry matter to fruit. The cluster-planted cotton had higher crop growth rates and biomass accumulation during all growth periods and, hence, more final dry matter production at a crop level. Numbers of sympodia and dry matter production per plant was significantly higher in the cluster planting pattern and was accompanied by an increase in boll size, indicating that facilitation between plants was promoting crop growth.
Acknowledgments:This work was financially supported by the National Natural Sciences Foundation of China (31300323) and China Postdoctoral Science Foundation Funded Project (2014M552515). We are grateful to the anonymous reviewers for their valuable comments, which substantially improved the manuscript. We thank Edanz editing for language assistance and also would like to thank the staff of Linze Inland River Basin Research Station.
Balkcom KS, Price AJ, Van Santen E, et al.. 2010. Row spacing, tillage system, and herbicide technology affects cotton plant growth and yield. Field Crops Research, 117(2–3): 219-225. DOI:10.1016/j.fcr.2010.03.003 |
Bange MP, Milroy SP. 2004. Growth and dry matter partitioning of diverse cotton genotypes. Field Crops Research, 87(1): 73-87. DOI:10.1016/j.fcr.2003.09.007 |
Best EC, Riney JB, Krieg DR, 1997. Factors affecting source-sink relations in cotton. In: Dugger P, Richter DA (eds.). Proc. Beltwide Cotton Conference New Orleans, LA, January 7–10, 1997. Memphis, TN: National Cotton Council of America, pp. 1387–1389.
|
Brodrick R, Bange MP, Milroy SP, et al.. 2012. Physiological determinants of high yielding ultra-narrow row cotton: Biomass accumulation and partitioning. Field Crops Research, 134: 122-129. DOI:10.1016/j.fcr.2012.05.007 |
Charles-Edwards DA, Doley D, Rimmington GM, 1986. Modelling Plant Growth and Development. Sydney: Academic Press.
|
Fang WP, Li LL, Xie DY, et al.. 2009. Comparison of dry matter accumulation and N, P, K uptake and distribution in different organs and yield on hybrid cotton and conventional cotton. Plant Nutrition and Fertilizer Science, 15(6): 1401-1406. DOI:10.3321/j.issn:1008-505X.2009.06.022 |
Gwathmey CO, Clement JD. 2010. Alteration of cotton source-sink relations with plant population density and mepiquat chloride. Field Crops Research, 116(1–2): 101-107. DOI:10.1016/j.fcr.2009.11.019 |
Hearn AB. 1994. OZCOT: a simulation model for cotton crop management. Agricultural Systems, 44(3): 257-299. DOI:10.1016/0308-521X(94)90223-3 |
Jost PH, Cothren JT. 2000. Growth and yield comparisons of cotton planted in conventional and ultra-narrow row spacings. Crop Science, 40(2): 430-435. DOI:10.2135/cropsci2000.402430x |
Jost PH, Cothren JT. 2001. Phenotypic alterations and crop maturity differences in ultra-narrow row and conventionally spaced cotton. Crop Science, 41(4): 1150-1159. DOI:10.2135/cropsci2001.4141150x |
Marois JJ, Wright DW, Wiatrak PJ, et al.. 2004. Effect of row width and nitrogen on cotton morphology and canopy microclimate. Crop Science, 44(3): 870-877. DOI:10.2135/cropsci2004.8700 |
Mason TG. 1922. Growth and abscission in Sea Island cotton. Annals of Botany, 36(144): 457-484. |
Mattera J, Romero LA, Cuatrín AL, et al.. 2013. Yield components, light interception and radiation use efficiency of Lucerne (Medicago sativa L
. ) in response to row spacing. European Journal of Agronomy, 45: 87-95. DOI:10.1016/j.eja.2012.10.008 |
Nichols SP, Snipes CE, Jones MA. 2004. Cotton growth, lint yield, and fiber quality as affected by row spacing and cultivar. The Journal of Cotton Science, 8(1): 1-12. |
San-oh Y, Sugiyama T, Yoshita D, et al.. 2006. The effect of planting pattern on the rate of photosynthesis and related processes during ripening in rice plants. Field Crops Research, 96(1): 113-124. DOI:10.1016/j.fcr.2005.06.002 |
Sidika E, Cigdem S, Emrah O, et al.. 2012. The effect of different irrigation water levels on yield and quality characteristics of purple basil (Ocimum basilicum L.)
. Agricultural Water Management, 109: 155-161. DOI:10.1016/j.agwat.2012.03.004 |
Su PX, Xie TT, Ding SS. 2009. Experimental studies on high-yield cluster cultivation of cotton in the Hexi Corridor oases of northwestern China. Agricultural Research in the Arid Areas, 27(6): 108-113. |
Vories ED, Valco TD, Bryant KJ, et al.. 2001. Three-year comparison of conventional and ultra narrow row cotton production systems. Applied Engineering in Agriculture, 17(5): 583-589. DOI:10.13031/2013.6910 |
Vories ED, Glover RE. 2006. Comparison of growth and yield components of conventional and ultra-narrow row cotton. The Journal of Cotton Science, 10(4): 235-243. |
Wall GW, Amthor JS, Kimball BA. 1994. COTCO2: a cotton growth simulation model for global change
. Agricultural and Forest Meteorology, 70(1–4): 289-342. DOI:10.1016/0168-1923(94)90064-7 |
Xie TT, Su PX, An LZ, et al.. 2016. Physiological characteristics of high yield under cluster planting: photosynthesis and canopy microclimate of cotton. Plant Production Science, 19(1): 165-172. DOI:10.1080/1343943X.2015.1128088 |
Yoda K, Kira T, Ogawa H, et al.. 1963. Self-thinning in overcrowded pure stands under cultivated and natural conditions (intraspecific competition among higher plants XI). Journal of Biology, Osaka City University, 14: 107-129. |
 2018, Vol. 10
