2. Key Laboratory of the Education Ministry for Poyang Lake Wetland and Watershed Research, Jiangxi Normal University, Nanchang, Jiangxi 330022, China;
3. Research Center for East-West Cooperation in China, East China Normal University, Shanghai 200241, China
Runoff fluctuation is a kind of complex hydrological phenomenon, for which the process shows a strong nonlinear characteristic (Liu et al., 2017a ). Traditional European-style geometry seems unable to describe completely and accurately a complex non-linear course of this kind, but the nonlinear science centered on chaos theory becomes a powerful tool to describe such courses. As an important branch in the hydrological system, the temporal and spatial variation of river-runoff fluctuation is an interference course with very complex nonlinearity and uncertainty (Bai et al., 2015 ). As observed with large-scale hydrological issues, river-runoff variation is impacted by global climate change; but it has an obvious nonlinear feedback effect to climate. As for mid-scale hydrological issues, runoff variation is not only relevant to climatic factors (precipitation, temperature, and so on) but also under the influence of under-lying surface, terrain, landform, and human activities (Jia and Huang, 2013). Furthermore, the process of temporal-evolution dynamics for runoff formation has a remarkably nonlinear cumulative effect (Xue et al., 2016 ; Liu et al., 2017a ,b,c). Owing to the highly nonlinear character of flood-wave movement, the impact of nonlinear dynamics with various sources should be considered in describing runoff fluctuation. With the rapid development of signal-detection technology, it is now possible to collect hydrological information with high efficiency and over a large range. Meanwhile, study on the nonlinear system-identification and parameter-estimation theory has also enriched the analytic approach of systematic hydrology. Merely due to the interactive complexity of factors inside a runoff system, as well as the difficulty in eliminating numerous external factors that impact its evolution process, it is hard to comprehend and depict the evolution characteristics of a runoff system. Consequently, the observable result—that is, the runoff time series is a complicated attribute that stems from the interplay of many hydroclimatic factors, providing an effective object of research for us to extract streamflow variability.
The multifractal theory, as first put forth by Mandelbrot in 1972, is a new frontier developed recently in nonlinear science, providing an advanced method for investigating the possibility that the time series generated by certain hydrological systems may be members of a special class of complex processes (Shi et al., 2010 ). The multifractal method has been widely utilized in research on food engineering (García-Armenta et al., 2016 ), seismicity (Roy and Mondal, 2012; Lu and Xu, 2014; Mondal and Roy, 2016; Fan and Lin, 2017), mining engineering (Nouri and Arian, 2017), medical research (Rajković et al., 2016 ), Internet traffic (Anderson et al., 2017 ), climatic change (Liu et al., 2014 ; Medina-Cobo et al., 2016 ), air and water pollution (Shi et al., 2009 ; Liu et al., 2015 , 2017b; He et al., 2017 ), stock analysis (Chen and Zheng, 2017), and other fields. The multifractal method investigates systemic properties based on local statistical properties, fundamentally by means of a statistical–physical method to discuss the distribution of probability. To be specific, the multifractal is defined on the basis of fractal structure; and it is the singularity assembly with nonuniform fractal dimension distribution constituted by the probable subsets from several limited kinds of a large amount of different singularity scaling exponents (Shi et al., 2009 , 2010). It depicts the local scaling properties of a fractal subset with different scales and scaling exponents distributed in a subset. That is to say, it describes the features of the complex fractal at various levels. Each level is expressed by different parameters that constitute an assembly. From the geometrical perspective, the scale and fractal dimension of the several subsets that comprise a fractal set are obviously different. The multifractal analysis of time series could describe the distribution status of probability resulting from different local condition or from different levels during the evolution process of the whole set. For this reason, multifractal analysis also measures the degrees of complexity, irregularity, and nonuniformity in the fractal structure (Easwaramoorthy and Uthayakumar, 2010). Thus, to depict and describe the hydrological system by applying multifractal theory is similar to observing the same matter by using a magnifying lens and a microscope with various resolutions, enabling us to have a clearer and more thorough understanding of runoff fluctuation, and thus obtain more statistical information related to different time scales and ranges from the runoff time series.
Climate warming will lead to change in the hydrological cycle; and Xinjiang, one of the main arid areas in Northwest China, belongs to the typical temperate continental arid climate (Bai et al., 2015 ). Runoff fluctuation can provide overviews of hydrological detection, but the mechanisms that drive its temporal evolution are not very clear, resulting in various techniques for runoff forecasting that are often excellent in some aspects but poor in others (Schlink et al., 2006 ). In this paper, we examine runoff variability using the spectrum method to look for its multifractal behaviors. The multifractal behaviors of runoff fluctuation were quantitatively evaluated by three major parameters (Δα, Δf, and B) of the multifractal spectrum f(α). It is to be hoped that our study can deepen the understanding of the hydrological process and its inherent mechanism in the continental drainage basins of arid areas in the context of global warming.
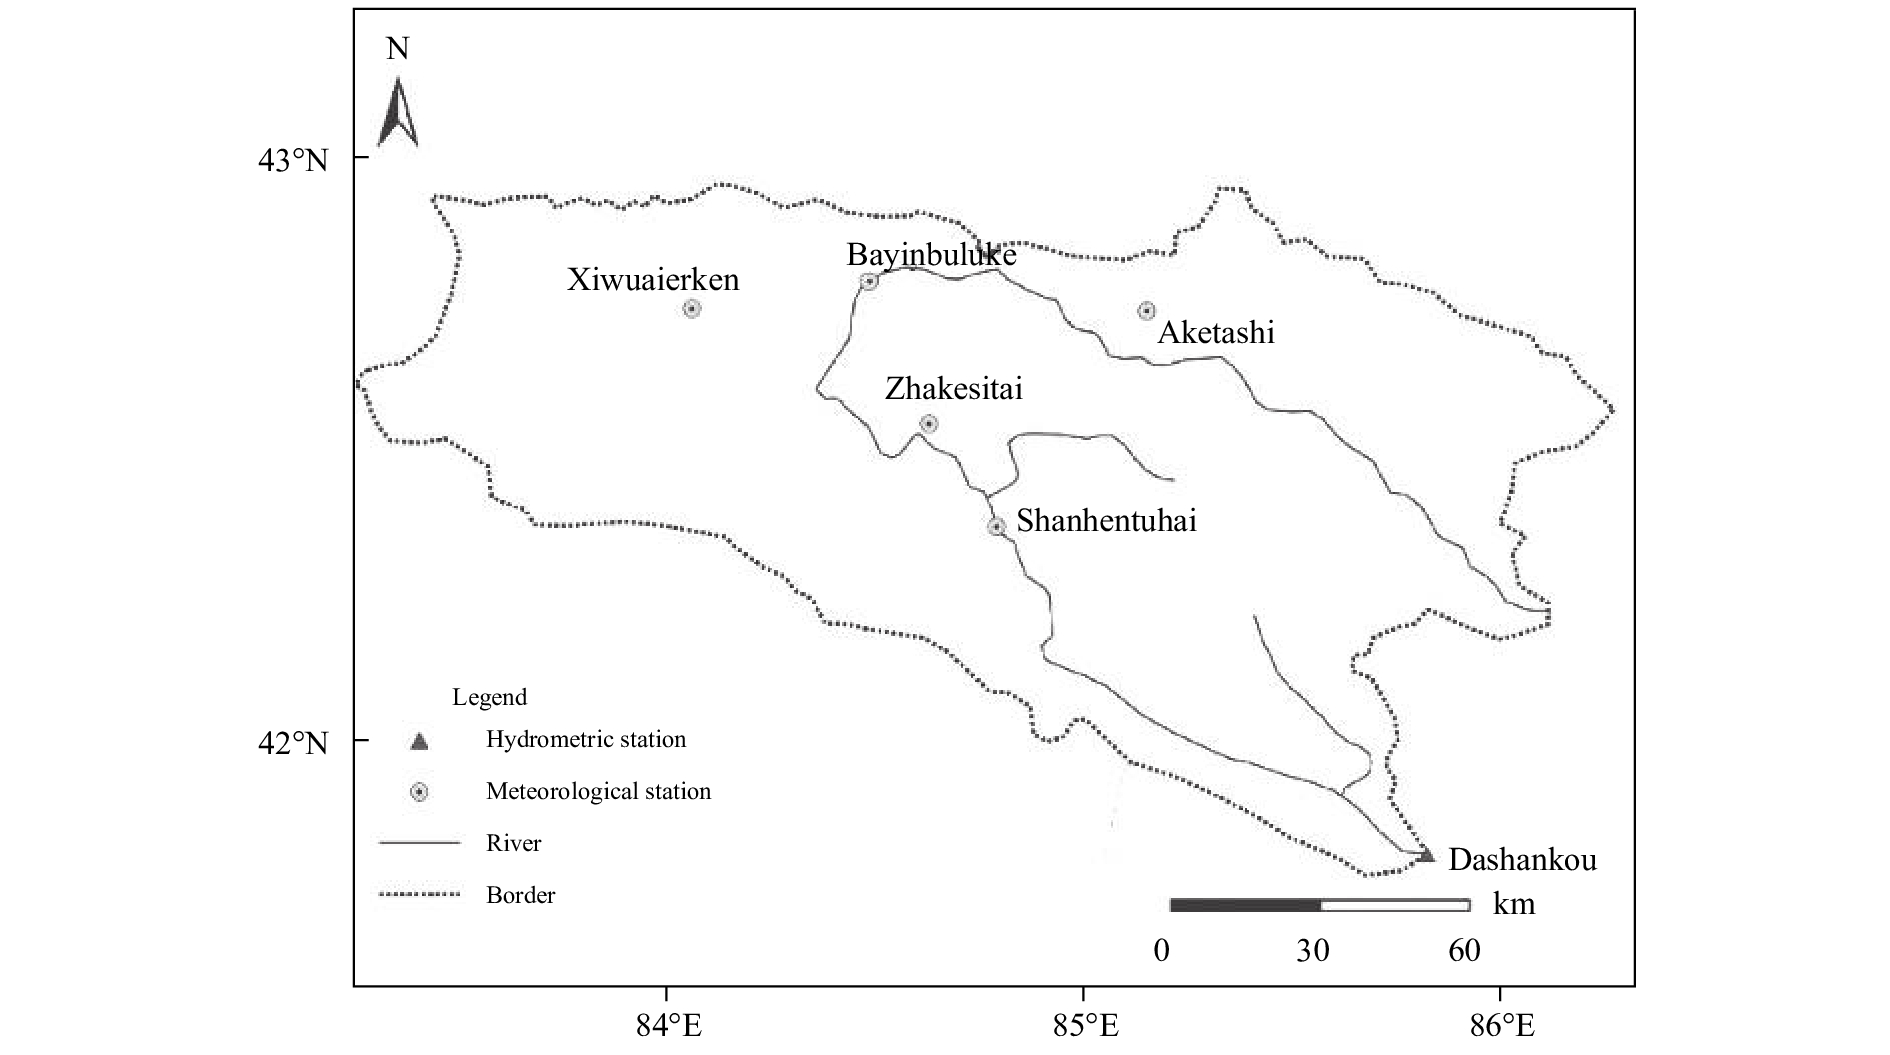
2 Study area and data 2.1 Study areaThe Kaidu River is located in the Bayinggolin Mongol Autonomous Prefecture of Xinjiang (Bazhou for short), and it is on the north margin of the Yanqi Basin. It stems from the middle section of the Tianshan Mountains, flows through the mountains' southern slope, and ultimately flows into Bosten Lake, with a drainage area of approximately 22,000 km2. The Kaidu River Basin mainly consists of a mountainous area (namely, the source-flow region) and the downstream-plain area (including the Yanqi Basin and the Bosten Lake wetland); and another part of the basin, from Dashankou Hydrologic Station to the first water-control center, is in the hilly area. The region above the station is included in the Kaidu River Basin (82°58′E–86°55′E, 41°47'–43°21'N), with a water-collecting area of 18,827 km2 (Chen et al., 2013 ). The Kaidu River Basin presents higher in the northwest and lower in the southeast. And the Kaidu River follows an inverted U-shape, resulting from its being separated by the Aierbin Mountain in the central section, while its main stream and tributary have a fan-shaped distribution. The topography in the basin is complex and diverse, with an average elevation of 3,100 m.
|
Figure 1 Geographic location and overview of the Kaidu River Valley |
The Dashankou hydrological station and five meteorological stations are located in the study area, as shown in Figure 1. The data sets examined are high-quality daily runoff in the headwater region, from January 1, 1972, to December 31, 2011. The data is 14,609 as shown in Figure 2. These data are provided by the Xinjiang Tarim River Basin Management Bureau. To determine which data have higher quality, the data have been subjected to extremum, time-consistency, and other tests. In addition, we applied the standard normal nomogeneity tests (SNHT) and the Buishand and Pettit homogeneity test to check these data (Pettit, 1979; Buishand, 1982; Alexandersson, 1986). The stepwise multiple linear regression method was employed to revise the time-series inhomogeneity.

|
Figure 2 Daily runoff in the headwater region, January 1, 1972 to December 31, 2011 |
Generally, there are two approaches to observing irregular multifractal dimensions, that is, generalized dimensions (namely, common dimensions) and multifractal spectrum (also known as singularity spectrum) (Grassberger, 1983). Chhabra et al. (Chhabra and Jensen, 1989; Chhabra et al., 1989 ) considered that the prerequisite for the generalized dimension method is the dimension Dq must be a smooth function to order moment q, that is to say, when the local points of one fractal assembly are distributed unevenly, its value will be changed along with the different balance weights that have been given. Consequently, as far as the signals obtained from the natural world are concerned, this hypothesis is not proper, whereas the multifractal spectrum f(α) does not have such demand. For this reason, this paper adopted the spectrum f(α) method to analyze the dimension of the daily runoff series. The spectrum adopts the common box-counting method (BCM) to solve it (Foroutan-Pour et al., 1999 ). Three major parameters (Δα, Δf, and B) of spectrum f(α) were employed in this research, which could reflect the overall characteristics of the f(α) curve as a whole, and were of explicit physical significance (Liu et al., 2014 , 2015, 2017b).
The Δα reflects the degree of nonuniformity of the probability-measurement distribution and the complexity of the process on the whole fractal structure under the circumstance that the scale is unchanged, and it has depicted the fluctuation degree of the data set. The larger the value Δα, the more nonuniform the probability-measurement distribution of runoff and the more intensely the data fluctuate. However, Δα=0 corresponds to a completely uniform distribution (Sun et al., 2001 ; Telesca et al., 2004 ; Shi et al., 2009 ). Δf has mainly reflected the proportion of the numbers when the runoff value is at the position of wave crest (the highest point) and wave trough (the lowest point) under the condition of constant scale. It could be indicated that more runoff values are in the wave trough when Δf<0; and more runoff values are in the wave crest when Δf>0 (Sun et al., 2001 ). The parameter B could be achieved from the f(α)–α curve of the fitting multifractal spectrum in the following equation.
| $f(\alpha ) = A(\alpha - {\alpha _0}) + B(\alpha - {\alpha _0}) + C$ |
where α0signifies the value α when the function f(α) obtains the maximum. Parameter B represents the degree of asymmetry of the curve. The asymmetry is more favorable in the case when its absolute value is closer to 0. If B<0, the curve shape leans to right; at this moment, the relatively higher fractal exponent takes the leading role. The event with the relatively larger climate and hydrology factor prevails, and its corresponding data-set structure is rougher. IfB>0, the curve shape leans to the left; at this moment, the relatively lower fractal exponent takes the leading role. The event with a relatively small climate and hydrology factor prevails, and its corresponding data-set structure is more "elaborate" (Telesca et al., 2004 ; Shi et al., 2009 ). This characteristic is mainly caused by the climate and hydrology factor has long memorability (Shimizu et al., 2002 ).
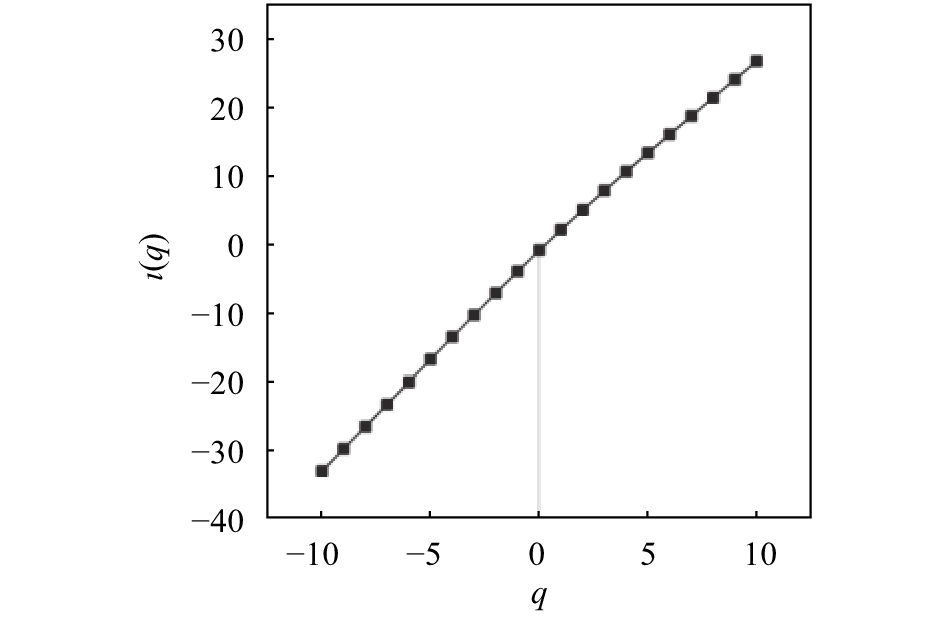
4 Results and discussion 4.1 The determination of multifractal behavior in the time scale of runoffFirstly, we should verify whether the runoff fluctuation complies with multifractal behavior. We calculate the singular curve clusters under the circumstance that the runoff is within the scope of −10≤q≤10, respectively (Figure 3). It can be seen from this diagram that the curve presents a linear relation regardless of the value q. After conducting linear regression towards the curve, respectively, it is found that the linearity correlation coefficient is larger than 0.97 in the whole-time scale. So lnχq(ε)–ln(ε) is equipped with a favorable linear relation, and the benign scale invariance in the whole-time scale is reflected. Thus τ(q)–q has resulted in accordance with the slope to each straight line in Figure 4, which obviously shows that τ(q)–q does not present a linear relation but appears as a convex function relation. Thus, it proves that the evolution of daily runoff presents multifractal behavior. Next, we will calculate parameter Δα, Δf, and B to describe the complexity of the multifractal spectrum.

|
Figure 3 Partition functions for the daily runoff, varying the parameter q |
|
Figure 4 The τ(q) curve for the daily runoff, varying the parameter q |
|
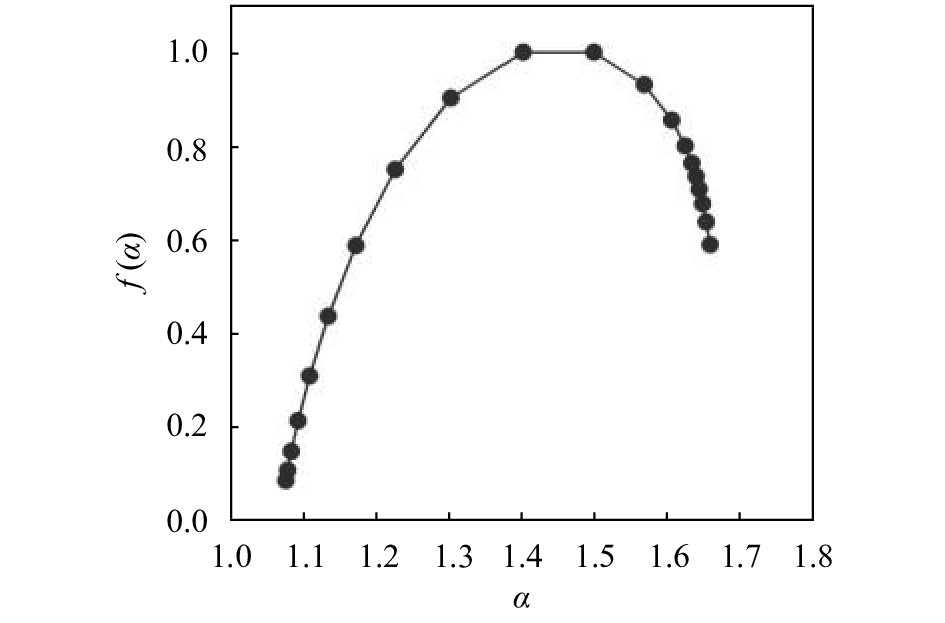
Figure 5 Multifractal spectrum f(α) of the daily runoff |
Figure 5 is the multifractal spectrum f(α)–α curve of runoff, which presents hooklike leftwards. In addition, the multifractal parameters Δα, Δf, and B of the runoff series are calculated, which are 0.5831, −0.3897, and −0.1133, respectively. Concrete analysis is as follows: Δf<0 indicates that these relatively large runoff events play a larger role, among which some local ascending runoff values are included. Moreover, as far asB is concerned, B<0 reflectsf(α)–α spectrum deflects rightwards, which also shows the relatively high fractal exponent plays a predominant role. There is an underlying concern that the runoff presents a rising tendency. Overall, the events with smaller runoff values take the leading role, but the events with larger values display their dominant role year by year. Therefore, the runoff volume of the Kaidu River shows an increasing tendency from 1972 to 2011. Compared to the period before 1961, the escalating temperature resulted in melting the ice and snow in the drainage basin, rises under the overall background of world transformation, which led to the daily runoff of the Kaidu River increasing accordingly.
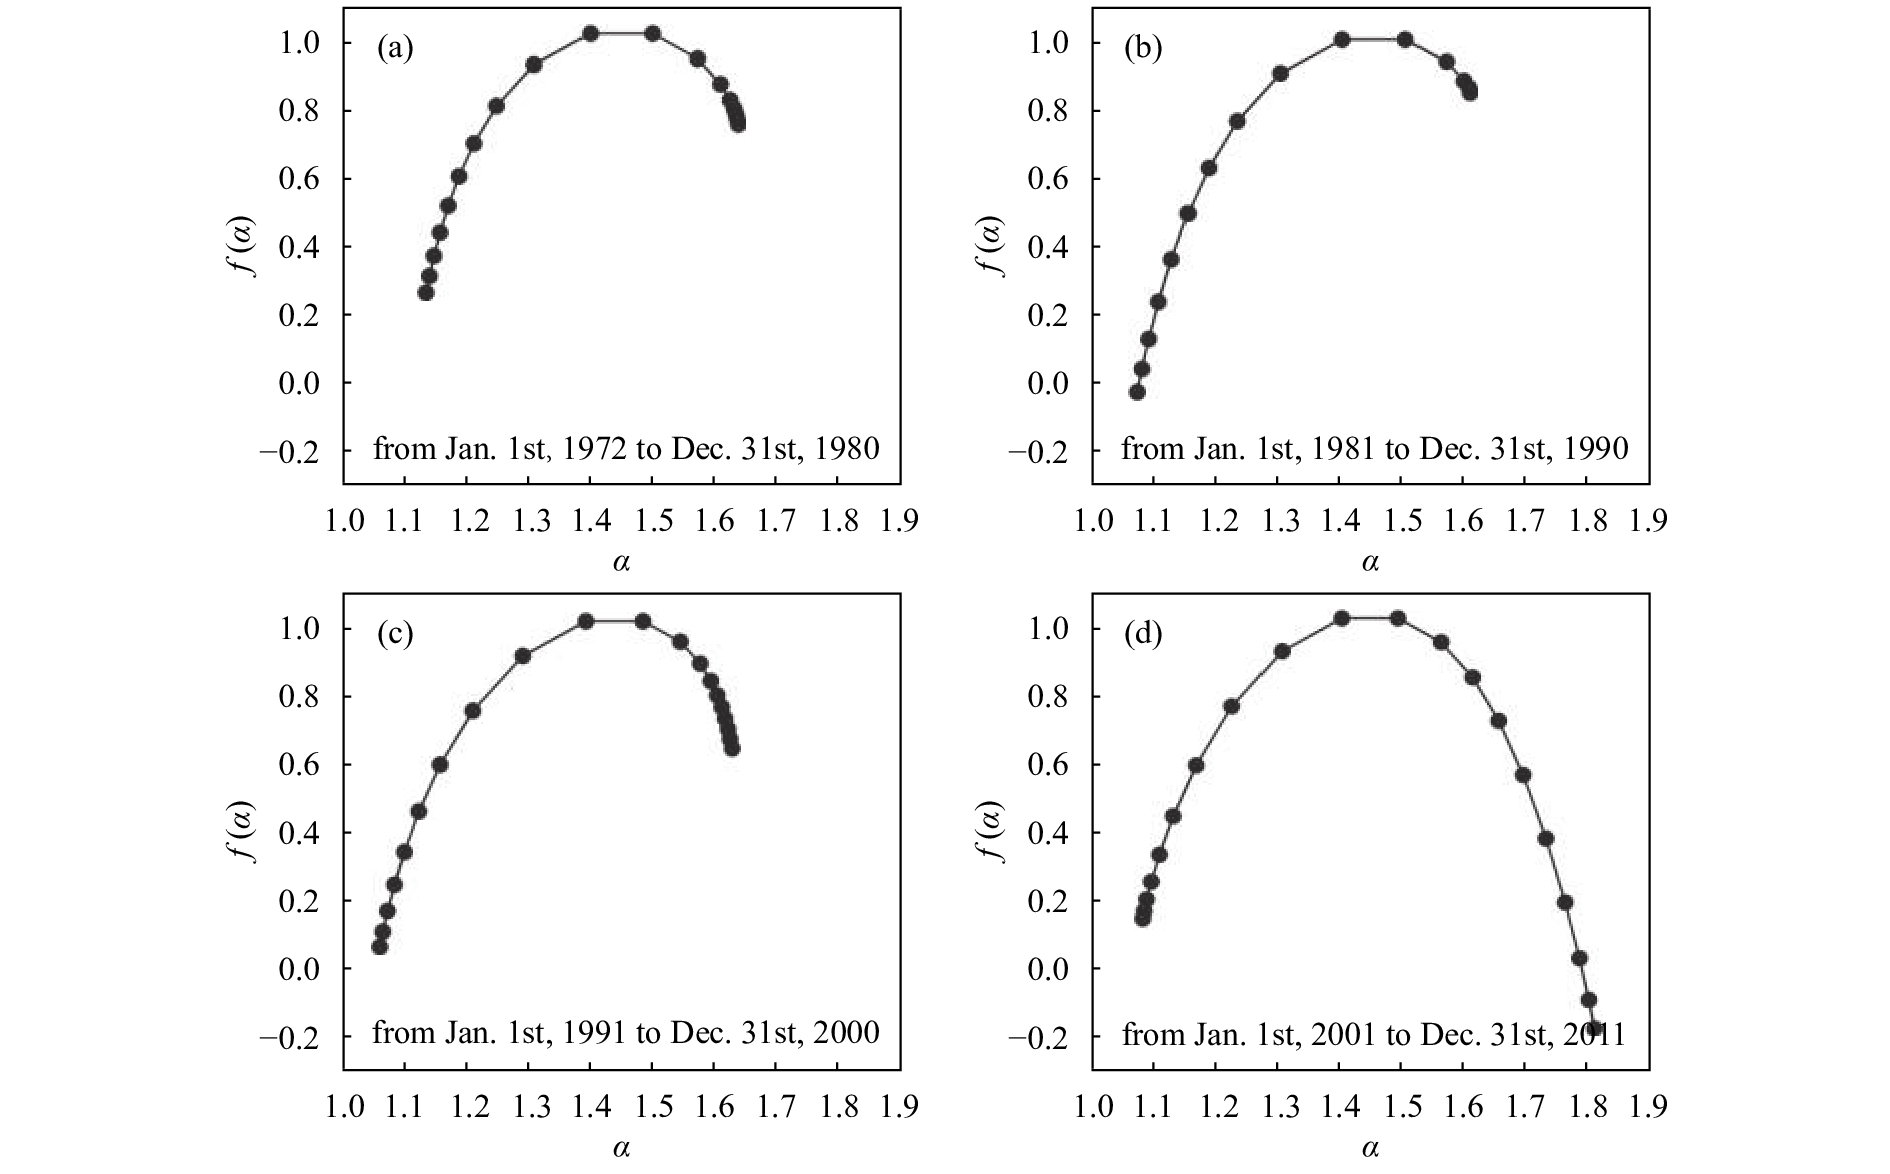
4.2 The multifractal behavior on the decadal scale for daily runoffThe above analysis indicates the daily runoff has exhibited multifractal behaviors in the past 40 years. Under the condition of time reduction, what kind of specific change do the runoff's multifractal behaviors have in decadal change? To answer the question, we are required to carry out further exploration and research. Considering the long memorability of one year to the runoff and data sample length, the following research will analyze the changing situation of runoff's multifractal characteristics by taking the decadal span as the time-interval standard. It clearly should that we have brought the daily runoff data of 2011 into the beginning of the 21st century. So the daily runoff volume of the Kaidu River is divided into four decades; and then the multifractal spectrum in each decade is calculated, respectively. There are temporal evolution, inherent development mechanism, and the impact of human activities in different decades, so every sequence in each decade possesses varied dynamic characteristics and leads to various kinds of complex characteristics. This type of difference may be expressed quantificationally by taking advantage of the multifractal spectrum. Further research on the rule of the multifractal spectrum in each year will be beneficial for investigating the dynamic behavior of the Kaidu River's runoff over temporal evolution and exploring the change rules of hydrological elements within the valley, which will be of great significance scientifically in tackling the impact of climate change.
|
Figure 6 Multifractal spectrum f(α) of the daily runoff in different decades |
Figures 6 and 7 are four spectrums f(α) and their parametric-variation diagram of the Kaidu River's daily runoff, respectively. Over four decades, the spectrum variation is not great. From the variation of Δα, we can clearly see that Δα presents a stable rise (from 0.51 to 0.72), which illustrates these singular values for the Kaidu River's daily runoff range of α left are larger, which also shows the larger runoff events occupy the leading position, as some local runoff values are falling. The Δf value changes relatively greatly on the decadal scale, with "sickle-shape", which can be attributed to the complex fractal structure variation caused by the different natures of the inherent dynamics in different decades. It is an obvious change that the right endpoint on the spectrum from the 1970s to the 1990s is lower than the left (Δf<0), which illustrates the probability for the daily runoff falling the lowest is always larger than that of the highest during the continuous three decades. At the beginning of the 21st century, Δf>0, which illustrates the trend is contrary to that of the 1970s to the 1990s. As far asB is concerned, its fluctuation is also relatively obvious. Generally, all B values are negative; and meanwhile, at the beginning of the 21st century, the value B is much smaller, which suggests the Kaidu River's daily runoff presents a tendency as a whole during 1972–2011. Compared to other decades, the increasing trend is more remarkable in the 1980s. Until the 21st century, the runoff presents a slightly descending tendency on the whole, which explains the events with the relatively large daily runoff of the Kaidu River taking the leading role; but sometimes, the small events also play the dominant role.
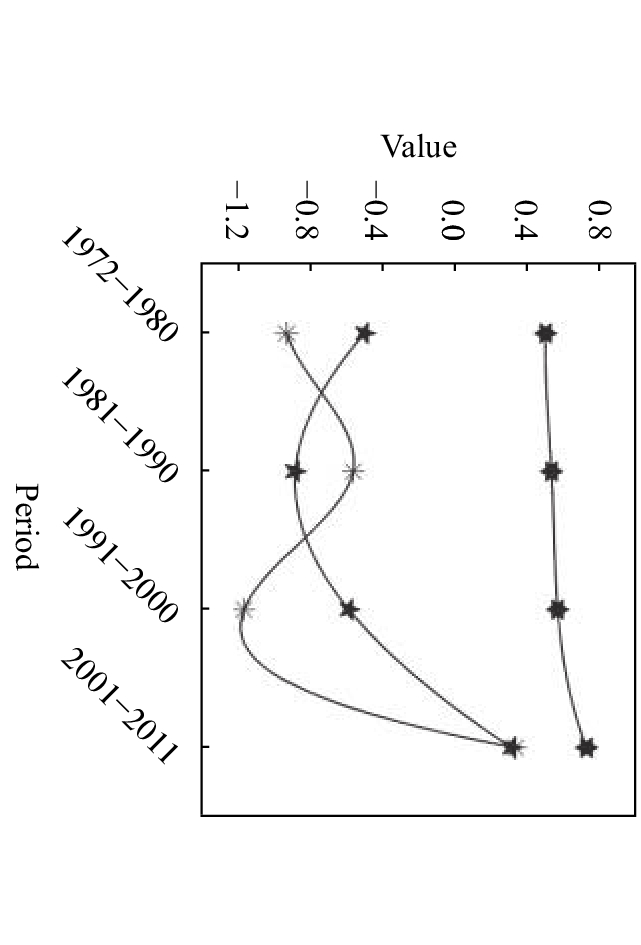
|
Figure 7 Multifractal parameter for the daily runoff Lines with " |
The multifractal method is one of the signal-analysis methods applicable to nonlinear and nonstationary series, and it has been proved a powerful tool in data analysis. When the method is applied to the time series of river runoff, the intrinsic time scales of hydrological change can be extracted; it is helpful to identify the hydrological trend. In this study, based on the hydrological data of the Kaidu River Basin during 1972–2011, the runoff fluctuation was analyzed using the multifractal method; the research results can be expressed briefly as follows:
(1) The singular curve of the runoff time series lnχq(ε)–ln(ε) was equipped with a favorable linear relation and showed a favorable scale invariance over the entire time scale. The τ(q)–q presented a convex function relation, so the runoff evolution had multifractal behavior.
(2) The multifractal spectrum f(α)–α curve of the runoff time series presented hooklike leftwards; it was indicated that, compared to the events with relatively large runoff, the events with relatively small runoff took the leading role if Δf<0, among which some local ascending runoff; anf(α)–α spectrum deflected rightwards was reflected if B<0, which indicated the Kaidu River's daily runoff volume presented an ascending tendency during 1972–2011.
(3) The multifractal processes of the Kaidu River's runoff variation over four decades were further analyzed. The f(α)–α spectrum variation is not great for four decades, by and large. Δα variation illustrates the singular values for the daily runoff range of α left are larger, which also shows larger runoff events occupying the leading position, with some local runoff values falling. The Δf value changes with "sickle-shape" may be attributed to the complex fractal structure variation caused by the different natures of the inherent dynamics in each decade. During the 1970s to the 1990s, Δf<0 illustrates the probability that the daily runoff at the lowest point is always larger than that of the highest during continuous three decades. At the beginning of the 21st century, Δf>0 presents a reverse change trend. As forB values with obvious fluctuation and negative value, the runoff shows an overall increasing tendency from 1972 to 2011 as a whole. Until the 21st century, the runoff with a slightly descending tendency on the whole explains the relatively large runoff events of the Kaidu River, take the leading role; but sometimes, some relatively small events also played the dominant role.
In the runoff time series with multifractal behavior, temporal fluctuation is not consecutive; therefore, there is an inherent correlation temporal scaling behind the randomness and uncertainty presented by this sort of nonlinear variation. Such inherent long-range correlation illustrates that the temporal fluctuation of the daily runoff is not only produced by interference from external random factors but also complex and nonlinear correlation of the data itself may contribute a factor. The correlation mainly comes from cumulative effect in the process of its temporal evolution dynamics.
Acknowledgments:This work was supported by the National Training Program of Innovation and Entrepreneurship for Undergraduates (No. 201611319050), Science and Technology Project of Jiangxi Provincial Department of Education (No. GJJ161097), China Postdoctoral Science Foundation (No. 2016M600515), Jiangxi Province Postdoctoral Science Foundation (No. 2017KY48), the Open Research Fund of Jiangxi Province Key Laboratory of Water Information Cooperative Sensing and Intelligent Processing (2016WICSIP012), and the Opening Fund of the Key Laboratory of Poyang Lake Wetland and Watershed Research (Jiangxi Normal University), Ministry of Education (No. PK2017002).
Alexandersson H. 1986. A homogeneity test applied to precipitation data. International Journal of Climatology, 6(6): 661-675. DOI:10.1002/joc.3370060607 |
Anderson D, Cleveland WS, Xi BW. 2017. Multifractal and Gaussian fractional sum-difference models for Internet traffic. Performance Evaluation, 107: 1-33. DOI:10.1016/j.peva.2016.11.001 |
Bai L, Xu JH, Chen ZS, et al.. 2015. The regional features of temperature variation trends over Xinjiang in China by the ensemble empirical mode decomposition method. International Journal of Climatology, 35(11): 3229-3237. DOI:10.1002/joc.4202 |
Buishand TA. 1982. Some methods for testing the homogeneity of rainfall records. Journal of Hydrology, 58(1–2): 11-27. DOI:10.1016/0022-1694(82)90066-X |
Chen YW, Zheng TT. 2017. Asymmetric joint multifractal analysis in Chinese stock markets. Physica A: Statistical Mechanics and its Applications, 471: 10-19. DOI:10.1016/j.physa.2016.11.052 |
Chen ZS, Chen YN, Li BF. 2013. Quantifying the effects of climate variability and human activities on runoff for Kaidu River Basin in arid region of northwest China. Theoretical and Applied Climatology, 111(3–4): 537-545. DOI:10.1007/s00704-012-0680-4 |
Chhabra A, Jensen RV. 1989. Direct determination of the f(α) singularity spectrum
. Physical Review Letters, 62(12): 1327-1330. DOI:10.1103/PhysRevLett.62.1327 |
Chhabra AB, Meneveau C, Jensen RV, et al.. 1989. Direct determination of the f(α) singularity spectrum and its application to fully developed turbulence
. Physical Review A, 40(9): 5284-5294. DOI:10.1103/PhysRevA.40.5284 |
Easwaramoorthy D, Uthayakumar R, 2010. Analysis of biomedical EEG signals using wavelet transforms and multifractal analysis. In: Proceedings of 2010 IEEE International Conference on Communication Control and Computing Technologies. Ramanathapuram, India: IEEE, pp. 545–549. DOI: 10.1109/ICCCCT.2010.5670780.
|
Fan XX, Lin M. 2017. Multiscale multifractal detrended fluctuation analysis of earthquake magnitude series of Southern California. Physica A: Statistical Mechanics and its Applications, 479: 225-235. DOI:10.1016/j.physa.2017.03.003 |
Foroutan-Pour K, Dutilleul P, Smith DL. 1999. Advances in the implementation of the box-counting method of fractal dimension estimation. Applied Mathematics and Computation, 105(2–3): 195-210. DOI:10.1016/S0096-3003(98)10096-6 |
García-Armenta E, Téllez-Medina DI, Sánchez-Segura L, et al.. 2016. Multifractal breakage pattern of tortilla chips as related to moisture content. Journal of Food Engineering, 168: 96-104. DOI:10.1016/j.jfoodeng.2015.07.015 |
Grassberger P. 1983. Generalized dimensions of strange attractors. Physics Letters A, 97(6): 227-230. DOI:10.1016/0375-9601(83)90753-3 |
He HD, Qiao ZX, Pan W, et al.. 2017. Multiscale multifractal properties between ground-level ozone and its precursors in rural area in Hong Kong. Journal of Environmental Management, 196: 270-277. DOI:10.1016/j.jenvman.2017.02.024 |
Jia KL, Huang J. 2013. Wavelet analysis of the hydrological time series of Dalai Lake, Inner Mongolia, China. Sciences in Cold and Arid Regions, 5(1): 51-72. DOI:10.3724/SP.J.1226.2013.00051 |
Liu WJ, Luo QP, Lu HJ, et al.. 2017a. The effect of litter layer on controlling surface runoff and erosion in rubber plantations on tropical mountain slopes, SW China. CATENA, 149: 167-175. DOI:10.1016/j.catena.2016.09.013 |
Liu ZH, Xu JH, Chen ZS, et al.. 2014. Multifractal and long memory of humidity process in the Tarim River Basin. Stochastic Environmental Research and Risk Assessment, 28(6): 1383-1400. DOI:10.1007/s00477-013-0832-9 |
Liu ZH, Wang LL, Zhu HS. 2015. A time-scaling property of air pollution indices: a case study of Shanghai, China. Atmospheric Pollution Research, 6(5): 886-892. DOI:10.5094/APR.2015.098 |
Liu ZH, Sun LN, Wang JY, et al.. 2017b. Multiple time-scale properties of air pollution indices: A case study of Lanzhou, China. Fresenius Environmental Bulletin, 26(12A): 7681-7686. |
Liu ZH, Wang LL, Yu X, et al.. 2017c. Multi-scale response of runoff to climate fluctuation in the headwater region of the Kaidu River in Xinjiang of China. Atmospheric Science Letters, 18(5): 230-236. DOI:10.1002/asl.747 |
Lu DH, Xu Q. 2014. Analysis of time-scaling behaviour in the sequence of aftershocks of the Wenchuan earthquake, China. Journal of the Geological Society of India, 84(3): 361-369. DOI:10.1007/s12594-014-0140-0 |
Medina-Cobo MT, García-Marín AP, Estévez J, et al.. 2016. The identification of an appropriate Minimum Inter-event Time (MIT) based on multifractal characterization of rainfall data series. Hydrological Processes, 30(19): 3507-3517. DOI:10.1002/hyp.10875 |
Mondal SK, Roy PNS. 2016. Temporal multifractal pattern of seismicity in northwest Himalayan region. Journal of the Geological Society of India, 88(5): 569-575. DOI:10.1007/s12594-016-0522-6 |
Nouri R, Arian M. 2017. Multifractal modeling of the gold mineralization in the Takab area (NW Iran). Arabian Journal of Geosciences, 10(5): 105. DOI:10.1007/s12517-017-2923-2 |
Pettit AN. 1979. A non-parametric approach to the change-point problem. Journal of the Royal Statistical Society, 28(2): 126-135. DOI:10.2307/2346729 |
Rajković N, Kolarević D, Kanjer K, et al.. 2016. Comparison of Monofractal, Multifractal and gray level Co-occurrence matrix algorithms in analysis of Breast tumor microscopic images for prognosis of distant metastasis risk. Biomedical Microdevices, 18(5): 83. DOI:10.1007/s10544-016-0103-x |
Roy PNS, Mondal SK. 2012. Identification of active seismicity by fractal analysis for understanding the recent geodynamics of Central Himalaya. Journal of the Geological Society of India, 79(4): 353-360. DOI:10.1007/s12594-012-0056-5 |
Schlink U, Herbarth O, Richter M, et al.. 2006. Statistical models to assess the health effects and to forecast ground-level ozone. Environmental Modelling & Software, 21(4): 547-558. DOI:10.1016/j.envsoft.2004.12.002 |
Shi K, Liu CQ, Ai NS. 2009. Monofractal and multifractal approaches in investigating temporal variation of air pollution indexes. Fractals, 17(4): 513-522. DOI:10.1142/S0218348X09004454 |
Shi K, Liu CQ, Huang ZW, et al.. 2010. Comparative analysis of time-scaling properties about water PH in Poyang Lake Inlet and Outlet on the basis of fractal methods. Water Science & Technology, 61(8): 2113-2118. DOI:10.2166/wst.2010.135 |
Shimizu Y, Thurner S, Ehrenberger K. 2002. Multifractal spectra as a measure of complexity in human posture. Fractals, 10(1): 103-116. DOI:10.1142/S0218348X02001130 |
Sun X, Chen HP, Wu ZQ, et al.. 2001. Multifractal analysis of Hang Seng index in Hong Kong stock market. Physica A: Statistical Mechanics and its Applications, 291(1–4): 553-562. DOI:10.1016/S0378-4371(00)00606-3 |
Telesca L, Lapenna V, Macchiato M. 2004. Mono- and multi-fractal investigation of scaling properties in temporal patterns of seismic sequences. Chaos, Solitons & Fractals, 19(1): 1-15. DOI:10.1016/S0960-0779(03)00188-7 |
Xue J, Lei JQ, Gui DW, et al.. 2016. Synchronism of runoff response to climate change in Kaidu River Basin in Xinjiang, Northwest China. Sciences in Cold and Arid Regions, 8(1): 82-94. DOI:10.3724/SP.J.1226.2016.00082 |
 2018, Vol. 10
