2. School of Resources and Environment Sciences, Anqing Normal University, Anqing, Anhui 246011, China
The net radiation reaching the earth is affected by atmospheric aerosols, which absorb and scatter solar radiation. The major organic components of atmospheric aerosols are dicarboxylic acids, which are highly water-soluble, have low vapor pressures, and are thus primarily found as particles (Kawamura and Kaplan, 1987; Talbot et al., 1988 ; Lefer et al., 1994 ). The most abundant dicarboxylic acid is oxalic acid, followed by malonic and succinic acids (Yao et al., 2002 ). Norton et al. (1983) first demonstrated the presence of oxalic acid and oxalate in snow, rain, and particulates, as well as some evidence for its presence as a gas.
Oxalic acid is often found in plant cells as oxalate, and almost all plants contain calcium oxalate (Kawamura et al., 1996 ; Zhang, 1996). Oxalate acids can also be found in the soil as calcium oxalate, as oxalic acid is a major metabolic product of fungi, though the concentration of oxalic acid in the soil is much lower than in urban dust particles that result from the dry deposition of aerosols (Kawamura et al., 1996 ). Oxalic acid has been industrially produced since the 1940s and is mainly used for the manufacturing of antibiotics and borneol drugs and for the organic synthesis of industrial chemicals (Talbot et al., 1988 ; Zhang, 1992; Hong, 1997). Oxalic acid is harmful to humans. A known natural local source of oxalate is the biological release and oxidation of hydrocarbons in the atmosphere (Andreae et al., 1988 ; Lefer et al., 1994 ).
Oxalate, (COO)22−, mainly exists as an aerosol particle and in small quantities dissolved in water and in the gaseous phase (Kawamura and Ikushima, 1993; Baboukas et al., 2000 ). Oxalate in the atmosphere is from two kinds of sources, direct and indirect. Direct sources include forest fires, motor-vehicle exhaust emissions, and soil release, which directly release oxalate into the atmosphere. Indirect sources are oxalates that are generated by atmospheric chemical reactions of unsaturated hydrocarbons. The photochemical oxidation of oil fuel and tetrachloroethylene is an important anthropogenic source, caused especially by industrial production releasing a large quantity of hydrocarbons (Matsumoto et al., 1998 ), which generates oxalate through a number of atmospheric photochemical reactions (Norton et al., 1983 ; Sempére and Kawamura, 1994; Legrand and De Angelis, 1996). Oxalates in glaciers have been previously studied in Greenland ice (Legrand and De Angelis, 1995, 1996), the Rongbuk Glacier (Kang et al., 2000 ) in the middle of Mount Everest in the Himalayas, and at the Tianshan Glacier (Li et al., 2001 , 2003) near the Urumqi River. This paper presents the first analysis on the variation of oxalate and fluoride of Laohugou Glacier No. 12 of the Qilian Mountains in western China.
2 Sampling and analysis 2.1 Ice-core drilling and analysisThe Qilian Mountains are located in Central Asia at the northeastern edge of the Qinghai–Tibetan Plateau. The height of the mountains is generally 4,000~5,000 m a.s.l.. Laohugou (hereinafter, LHG) is located on the northern slope at the edge of the Qilian Mountains. LHG Glacier No. 12 is found where the mountains are split drastically; and the wind direction is influenced by local topography, coupled with a prevailing southeast wind controlled by the westerlies. Atlantic water vapor transported by the westerlies is the primary source of water vapor. Strong convection currents in summer account for 69% of the annual precipitation. Except for the firn basin, all snow, ice, and water are melted and evaporated across the region. Although there is less precipitation, winter and spring are important periods of groundwater recharge each year due to low temperatures.
In June 2006, a 20.12-m ice core and a snowpit were sampled from the firn basin of LHG Glacier No. 12 (39°25.7′N, 96°33.4′E) at an altitude of 5,040 m. The ice core was transported in a frozen state to the State Key Laboratory of Cryospheric Science, Cold and Arid Regions Environmental and Engineering Research Institute, Chinese Academy of Sciences, for storage. The ice core was continuously cut into 3–5 cm samples at low temperatures (−5 °C). The 1.5-cm outer layer was removed with a stainless steel scalpel, and samples were placed in sample vials that had been washed with ultrapure water (18.2 MΩ·cm). Then, all oxalate and other main soluble ions in the samples were measured using DINOX ICS-2500 Ion Chromatography at the State Key Laboratory of Cryospheric Science. Chromatographic conditions were as follows: separating column, Dionex Ion Pac As11-HC 4 mm; guard column, Dionex Ion Pac AG11-H 4 mm; ASRS, UL TRA Times auto-regeneration micro-membrane suppressors; conductivity detector; and auto-regeneration KOH eluent. Relative standard deviation was 1%. Before analysis, the samples were removed to allow natural melting for analysis. All analyses were performed in a class 100 clean laboratory environment with strict procedural controls to avoid possible contamination. Oxygen-isotope analysis and β-activation grade analysis were performed. Analysis of stable oxygen-isotope ratios (δ18O) used a MAT-253 mass spectrometer. β-activation grade-analysis measurement used a MINI20-type, low-background α/β counting system.
2.2 Ice-core datingThe ice core was dated using the multiparameter combined method. The 20.12-m shallow ice core was dated by counting the stable oxygen isotopic profile. The concentration curve of Ca2+ and SO42− and characteristics of the dust layer, verified in 1963 by β activity, peaked as a result of atmospheric thermonuclear tests in the early 1960s. The ice core of 606 samples was dated from 1960 to 2006 (Figure 1).

|
Figure 1 The LHG Glacier No. 12 shallow ice-core dating result |
Glaciochemical studies of snowpits are important for the study of modern processes of snow and ice, and are fundamental in ice-core research. Using snowpit data, we analyzed in this paper the source of oxalate of LHG Glacier No. 12.
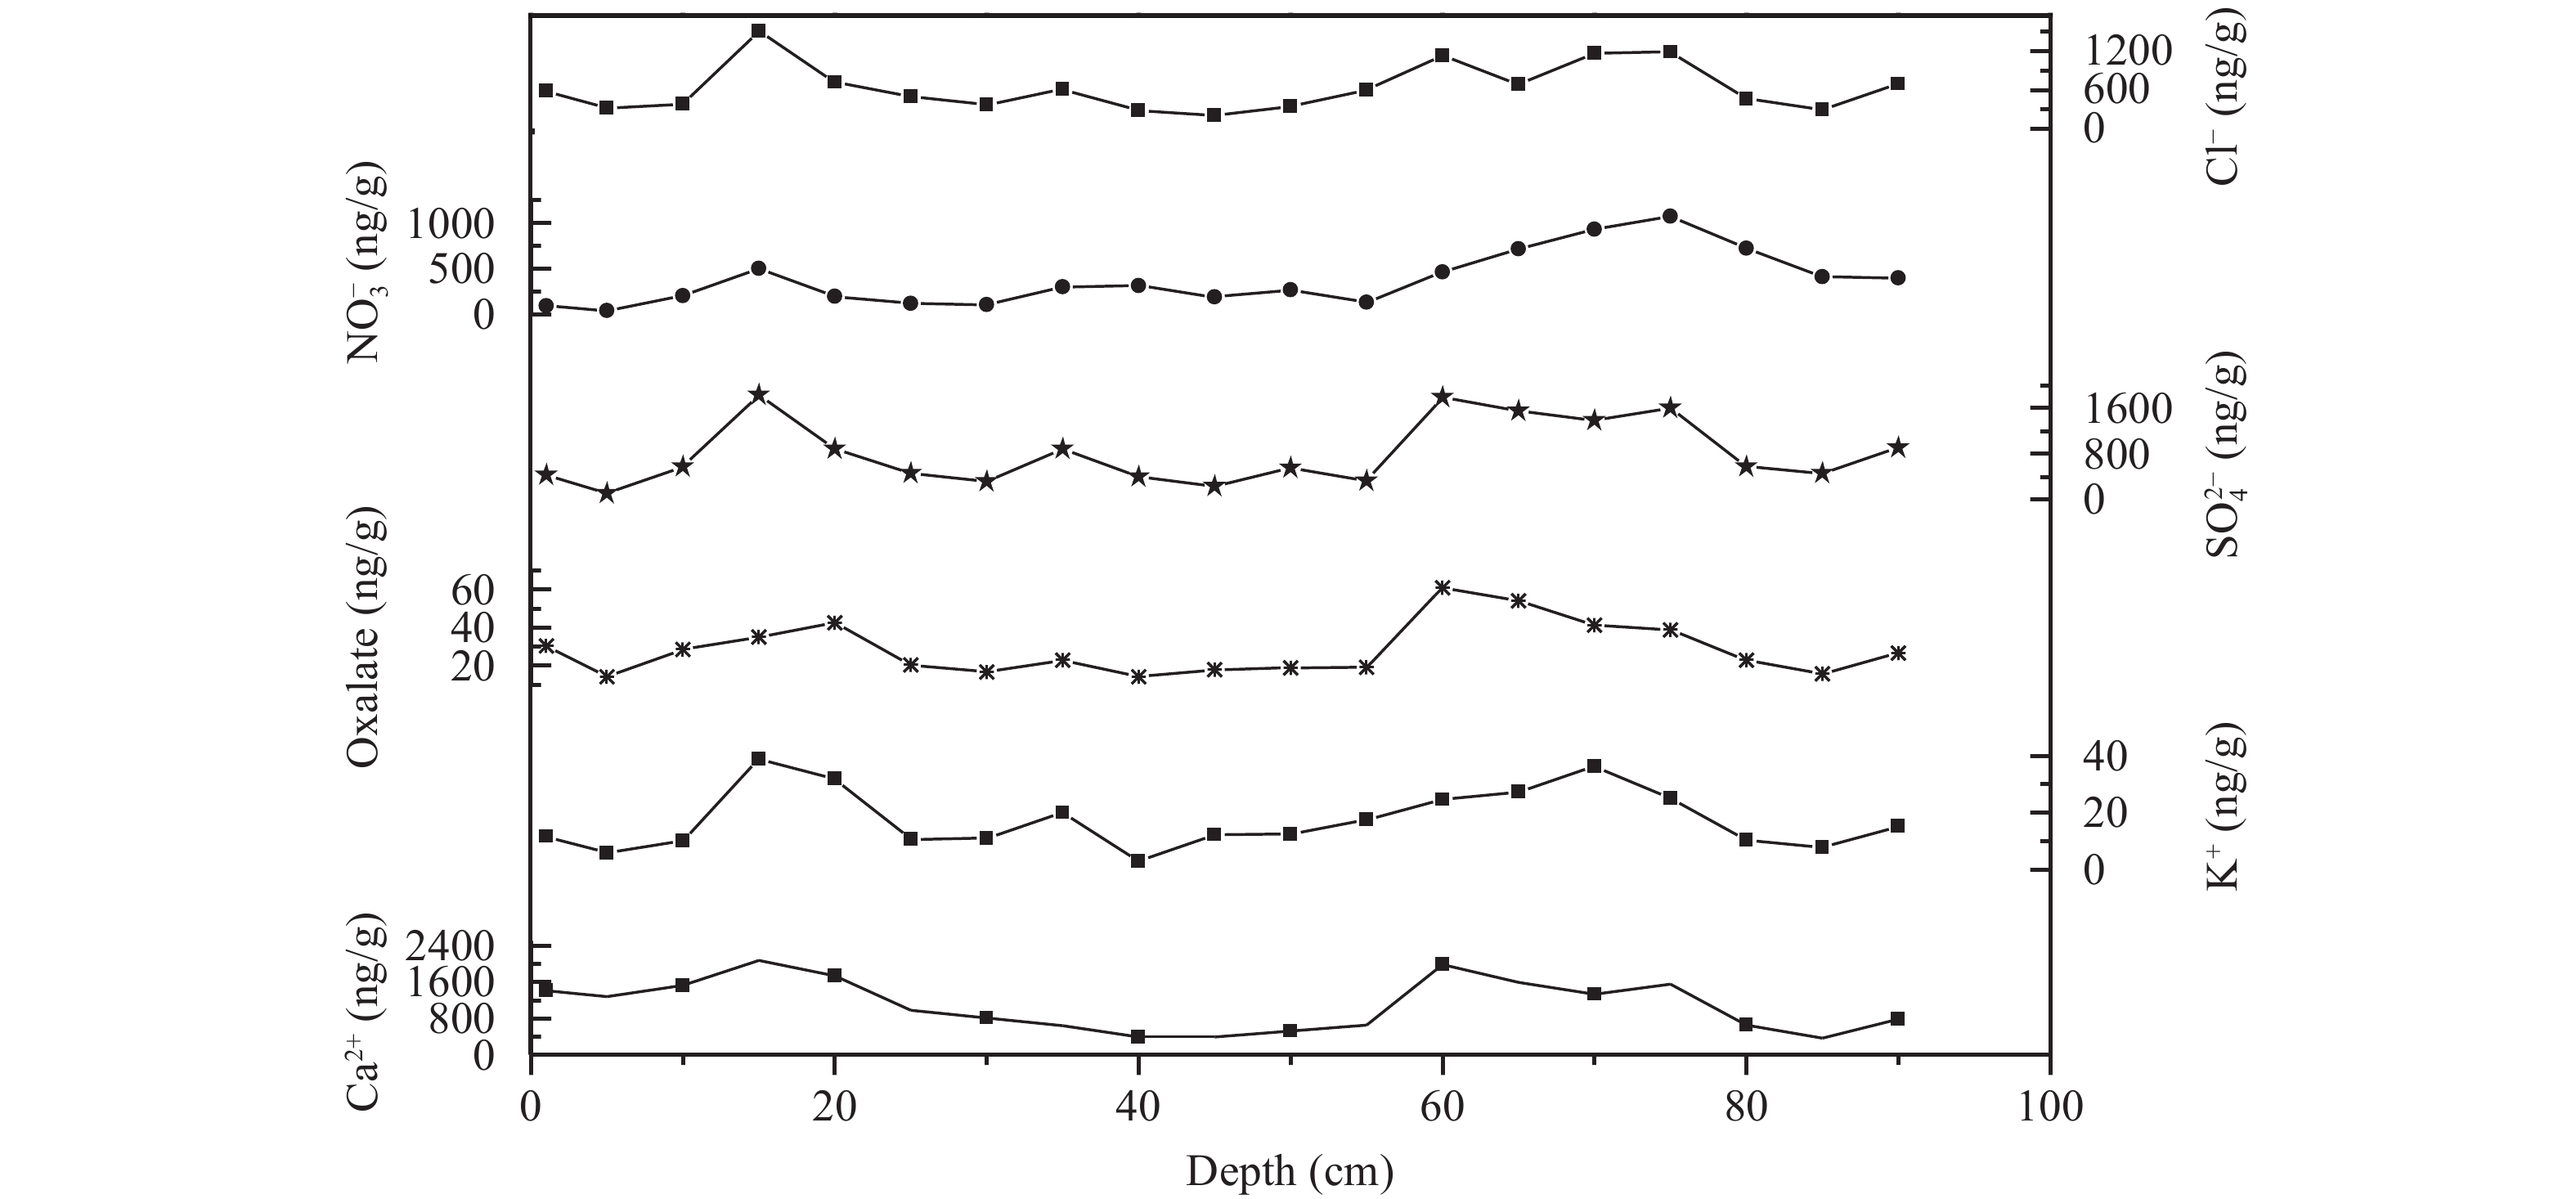
A 95-cm snowpit including 19 samples was collected and analyzed. The average concentration of the oxalate in the snowpit was 28.3 ng/g. The original oxalate record is shown in Figure 2 (COO)22− and other ions demonstrated a significantly seasonal variation in the snowpit of Glacier No. 12. Each ion exhibited a two-peak curve, showing peaks at 20 cm and 65 cm and a valley from 30–60 cm. There were a good correlations between oxalate and SO42−, Ca2+, and K+ (Table 1).

|
Figure 2 The concentration changes of ions in the snowpit of LHG Glacier No. 12 |
|
|
Table 1 Correlation coefficient matrix of the main chemical components in LHG Glacier No. 12 |
Correlative analysis showed that oxalate had significant correlations with SO42−, Ca2+, and K+ in the snowpit, indicating that they may have the same source. Previous researches (Wake et al., 1993 ; Li et al., 1997 ; Yao et al., 2004 ) showed that dust inputs of arid and semi-arid areas of Asia were the major factor that affected the spatial distribution of glaciochemistry in the northern Tibetan Plateau. Cui et al. (2010) and Qin et al. (2015) pointed out that dust material (e.g., Ca2+ and Mg2+) at LHG Glacier No. 12 originated mainly from Central Asia and northwestern China, with the Tarim Basin, the Qaidam Basin, the Inner Mongolia Alashan Desert, and the desert area of Mongolia.
We used the HYSPLIT model to simulate the source of the air mass. The HYSPLIT4 (http://www.arl.noaa.gov/ready/hysplit4.html) model can compute trajectories and can be used successfully for complex dispersion and deposition simulations with puff or particle approaches. The HYSPLIT model has been used in many studies (Kahl et al., 1997 ; Falkovich et al., 2001 ; Ramachandran, 2005). Because the global average lifetime of oxalic acid is 6 to 8 days (Langner and Rodhe, 1991), we used a suitable method of 5-day-long backward trajectory with a daily resolution, to investigate trajectories of air masses coming to the sampling site (39°25.7′N, 96°33.4′E, 5,040 m a.s.l.) during 2005, using meteorological data provided by NOAA/NECP.
Air-mass trajectories showed that the atmosphere in the LHG Glacier No. 12 region was mainly controlled by westerly circulation and the Tibetan Plateau monsoon. The prevailing winds high above the Qilian Mountains have led to some amount of environmental influence from the large arid areas of Central Asia. Within 2,000 m above the surface, anticyclonic circulation systems have developed due to topography in the north and south of the Qilian Mountains. These regional circulation systems provided avenues for transport of atmospheric pollutants from cities (such as Yumen, Jiuquan, and Dunhuang). The composite geography of high mountains with desert basins also has led to local mountain and valley winds. Meteorological data from the Qilian Mountains Station of Glaciology and Ecologic Environment (39.51°N, 96.51°E, 4,180 m a.s.l.) document that West–South–West valley winds of more than 2.8 m/s prevail from March to September (Sun et al., 2011 ), transporting local sources of atmospheric pollutants from the Shule River Valley to LHG Glacier No. 12. The air-mass trajectories indicated that oxalic acid and oxalate aerosols accumulated LHG Glacier No. 12 by dry or wet deposition after traversing Central Asia (mainly western China) arid areas. Yumen and Jiuquan are industrial cities that are 200 km from LHG Glacier No. 12, and atmospheric pollutants from the cities can be transported to the glacier by prevailing cyclonic or anticyclonic circulation. Even farther west is Urumqi, an important industrial town in Northwest China. Atmospheric pollution from cities and industrial towns within the vicinity must have been responsible for oxalate in the area.
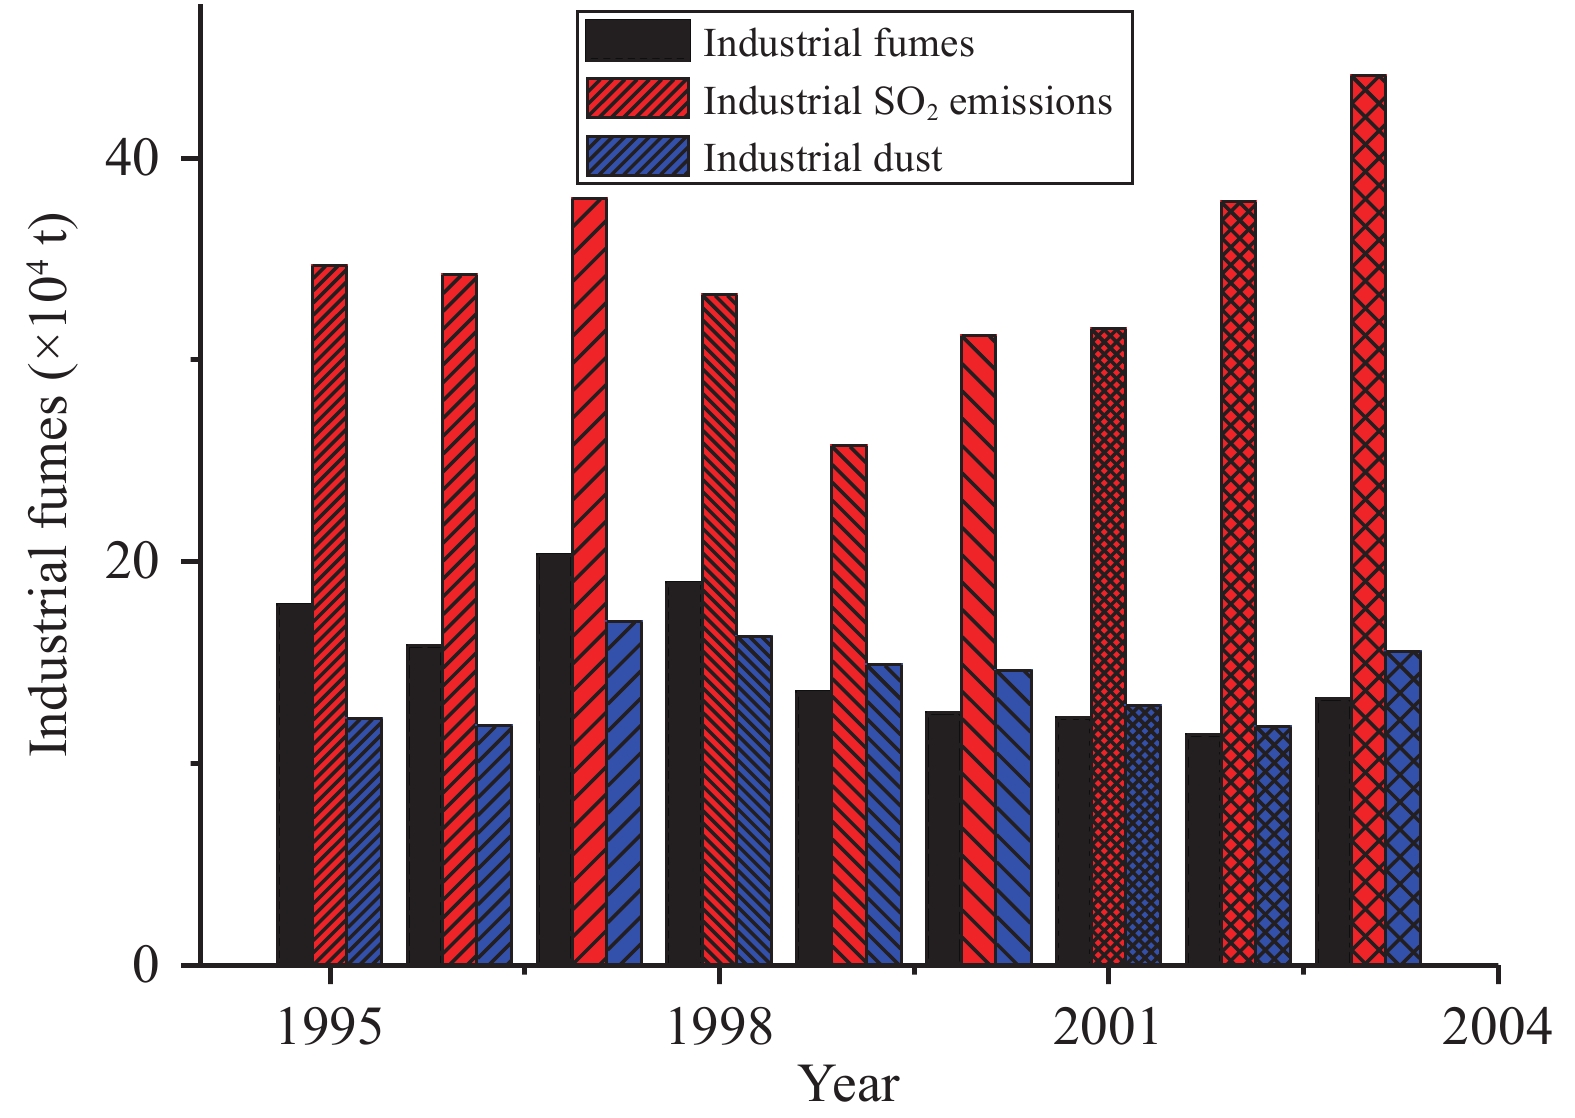
Because there are no public industrial air-pollution emissions data for Jiuquan City, pollution of the Qilian Mountains glacier area can be discussed based on open emissions data of the Gansu Province from 1991 to 2003 (Compilation Committee of Local Chronicles of Gansu Province, http://www.gsep.gansu.gov.cn/hjzlgb). Industrial air emissions (including industrial fumes, industrial SO2 emissions, and industrial dust) have been on an upward trend since the 1990s (Figure 3). But emissions have decreased since 2000, reflecting improvement of the atmospheric environment due to governmental pollution treatment and prevention in regional industrial activities. Since the 1980s, China has experienced a new period of rapid development, during which the glacier recorded an increase in organic compounds. Since the mid-1980s, (COO)22− in the Glacier No. 12 ice core had a significantly increasing trend (Figure 4), mainly because industry and mining developed rapidly with economic development. Petroleum fuels, tetrachloroethylene and industrial production released a large number of hydrocarbons, which generated a number of organic acids through many atmospheric photochemical reactions. At the same time, the increase in temperature and pollutant emission caused by human activities promoted atmospheric photochemical reactions, thereby accelerating the formation of organic acids (Li et al., 2003 ). Concurrently, rising temperature acting as a catalyst increased the oxalate process of reflection.

|
Figure 3 The trend of industrial air emissions |
Furthermore, vegetational emission of oxalic acids also contributed significantly to the acid concentration at LHG Glacier No. 12 because there is an abundance of vegetation on the Qilian Mountains. Glacier No. 12 is near Jiuquan City, where a large number of farmers still used straw for cooking and heating, which would have directly released organic acids into the atmosphere. The organic acids accumulated in glaciers through rainfall after short-distance transport through local climate circulation, resulting in the high concentration of oxalate. There were also many nonferrous metals mines, and a large amount of hydrocarbons have been released into the atmosphere during mining; these hydrocarbons would have produced large amounts of organic acids through a series of oxidation reactions.
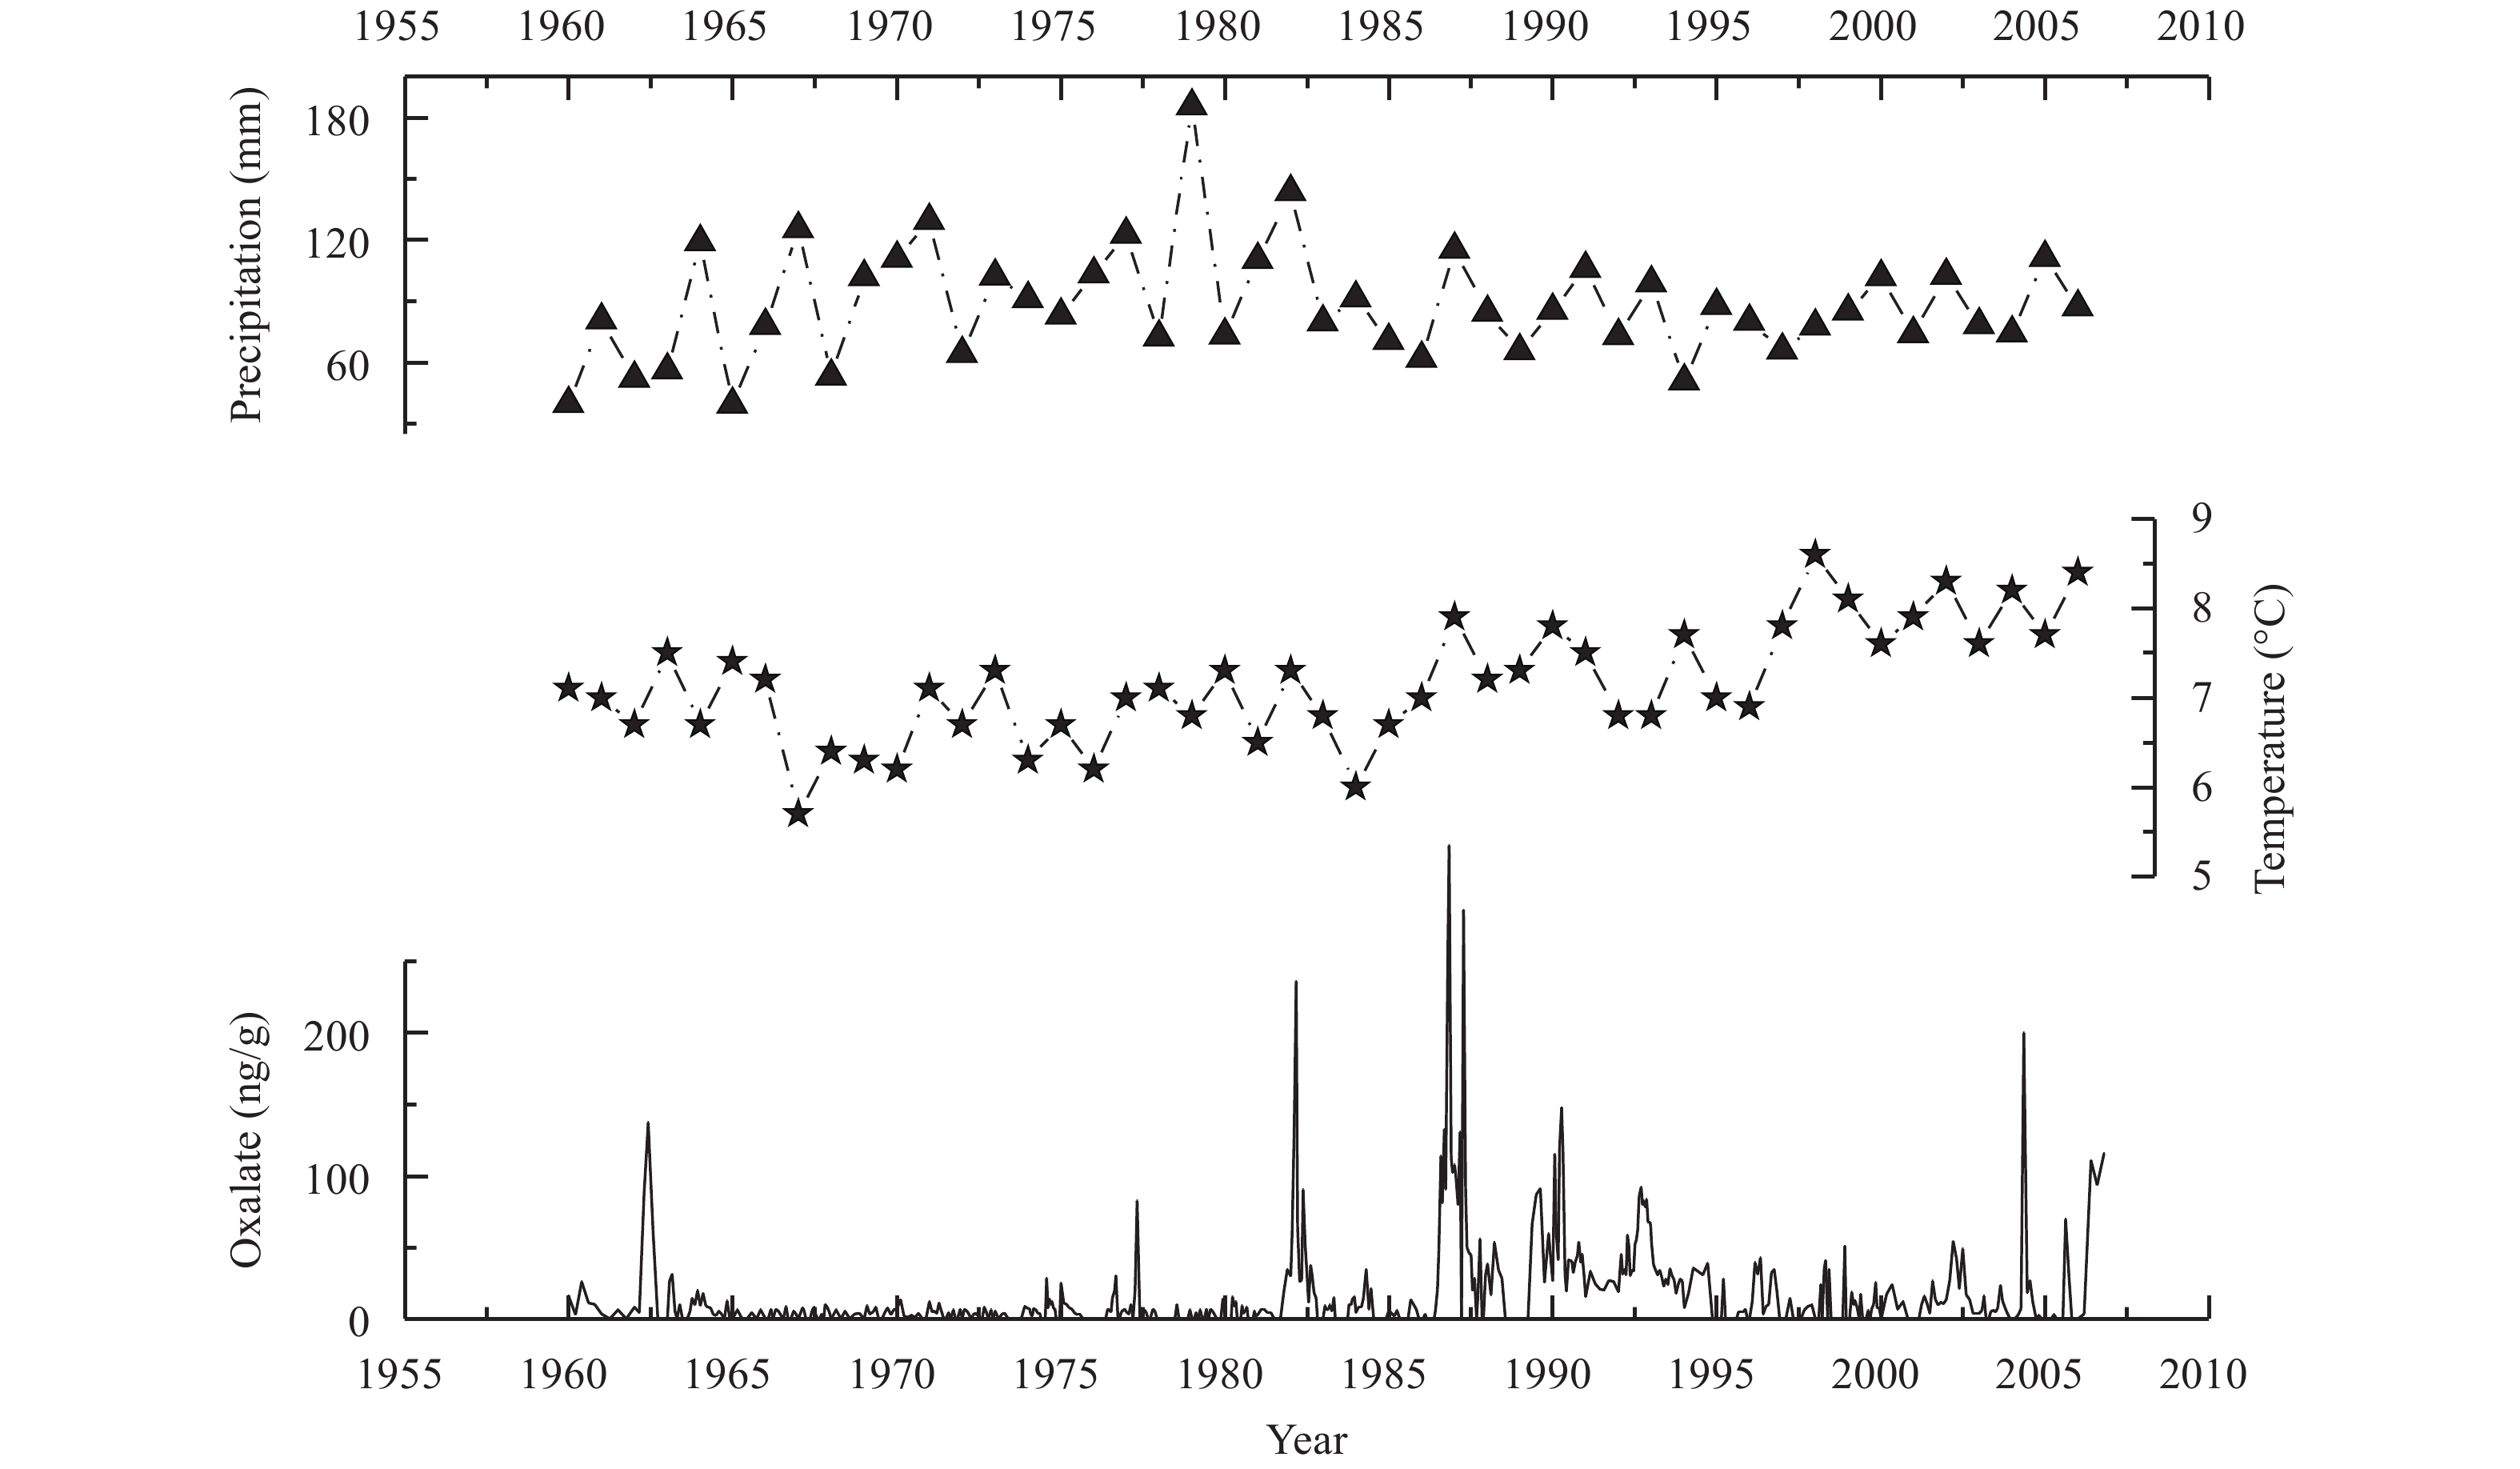
3.3 Record of oxalate concentration in the ice core of Glacier LHG No. 12The average oxalate concentration was 18.5±6.1 ng/g in the Glacier No. 12 ice core, with a few samples with oxalate concentrations exceeding 300 ng/g, and some samples being below the detection limit. As shown in Figure 4, there were main-peak values in 1962, 1977, 1982, 1987, 1990, 2004, and 2006. (COO)22– showed a significantly increasing trend since 1985. From 1985 to 1995, oxalate concentration had large fluctuations, peaking around 1987 and exhibiting a gentlely decreasing trend since 1995. As shown in Table 2, the average concentration in the ice core of LHG Glacier No. 2 was much higher than those in Antarctic and Greenland ice cores and was similar to that in the Rongbu Glacier (Kang et al., 2000 ).
Temperature and precipitation data from the Yumen weather station (40°16′N, 97°02′E, 1,527 m a.s.l.) from 1960 to 2004 revealed that temperature significantly increased since 1985, but precipitation slowly declined (Figure 4). Kang et al. (2000) pointed out a correlation between the concentration of oxalate and temperature, and high temperature can promote oxalate accumulation. In Figure 4, oxalate increased since 1985; and the temperature at the Yumen station also showed a strong upward trend since 1985, while precipitation showed little change. Thus, increasing temperature and decreasing precipitation together may have led to increasing oxalate in the LHG Glacier No. 12 ice core since 1985. Now that a permanent station (39.51°N, 96.51°E, 4,180 m a.s.l.) in the LHG Glacier No. 12 area has been established, and we are prepared to carry out meteorological observations and organic acid testing at LHG Glacier No. 12, we will be able to use the data to better study the quantitative relationship between temperature and oxalate in snow and ice.

|
Figure 4 Variation of (COO)22− concentration in the ice core of LHG Glacier No. 12, and temperature and precipitation changes at the Yumen Station |
Thus far, the study of oxalate in ice cores in the Tibetan Plateau has occurred only at the East Rongbu Glacier of Mount Everest, Glacier No. 1 at the Urumqi riverhead, and LHG Glacier No. 12 in the Qilian Mountains.
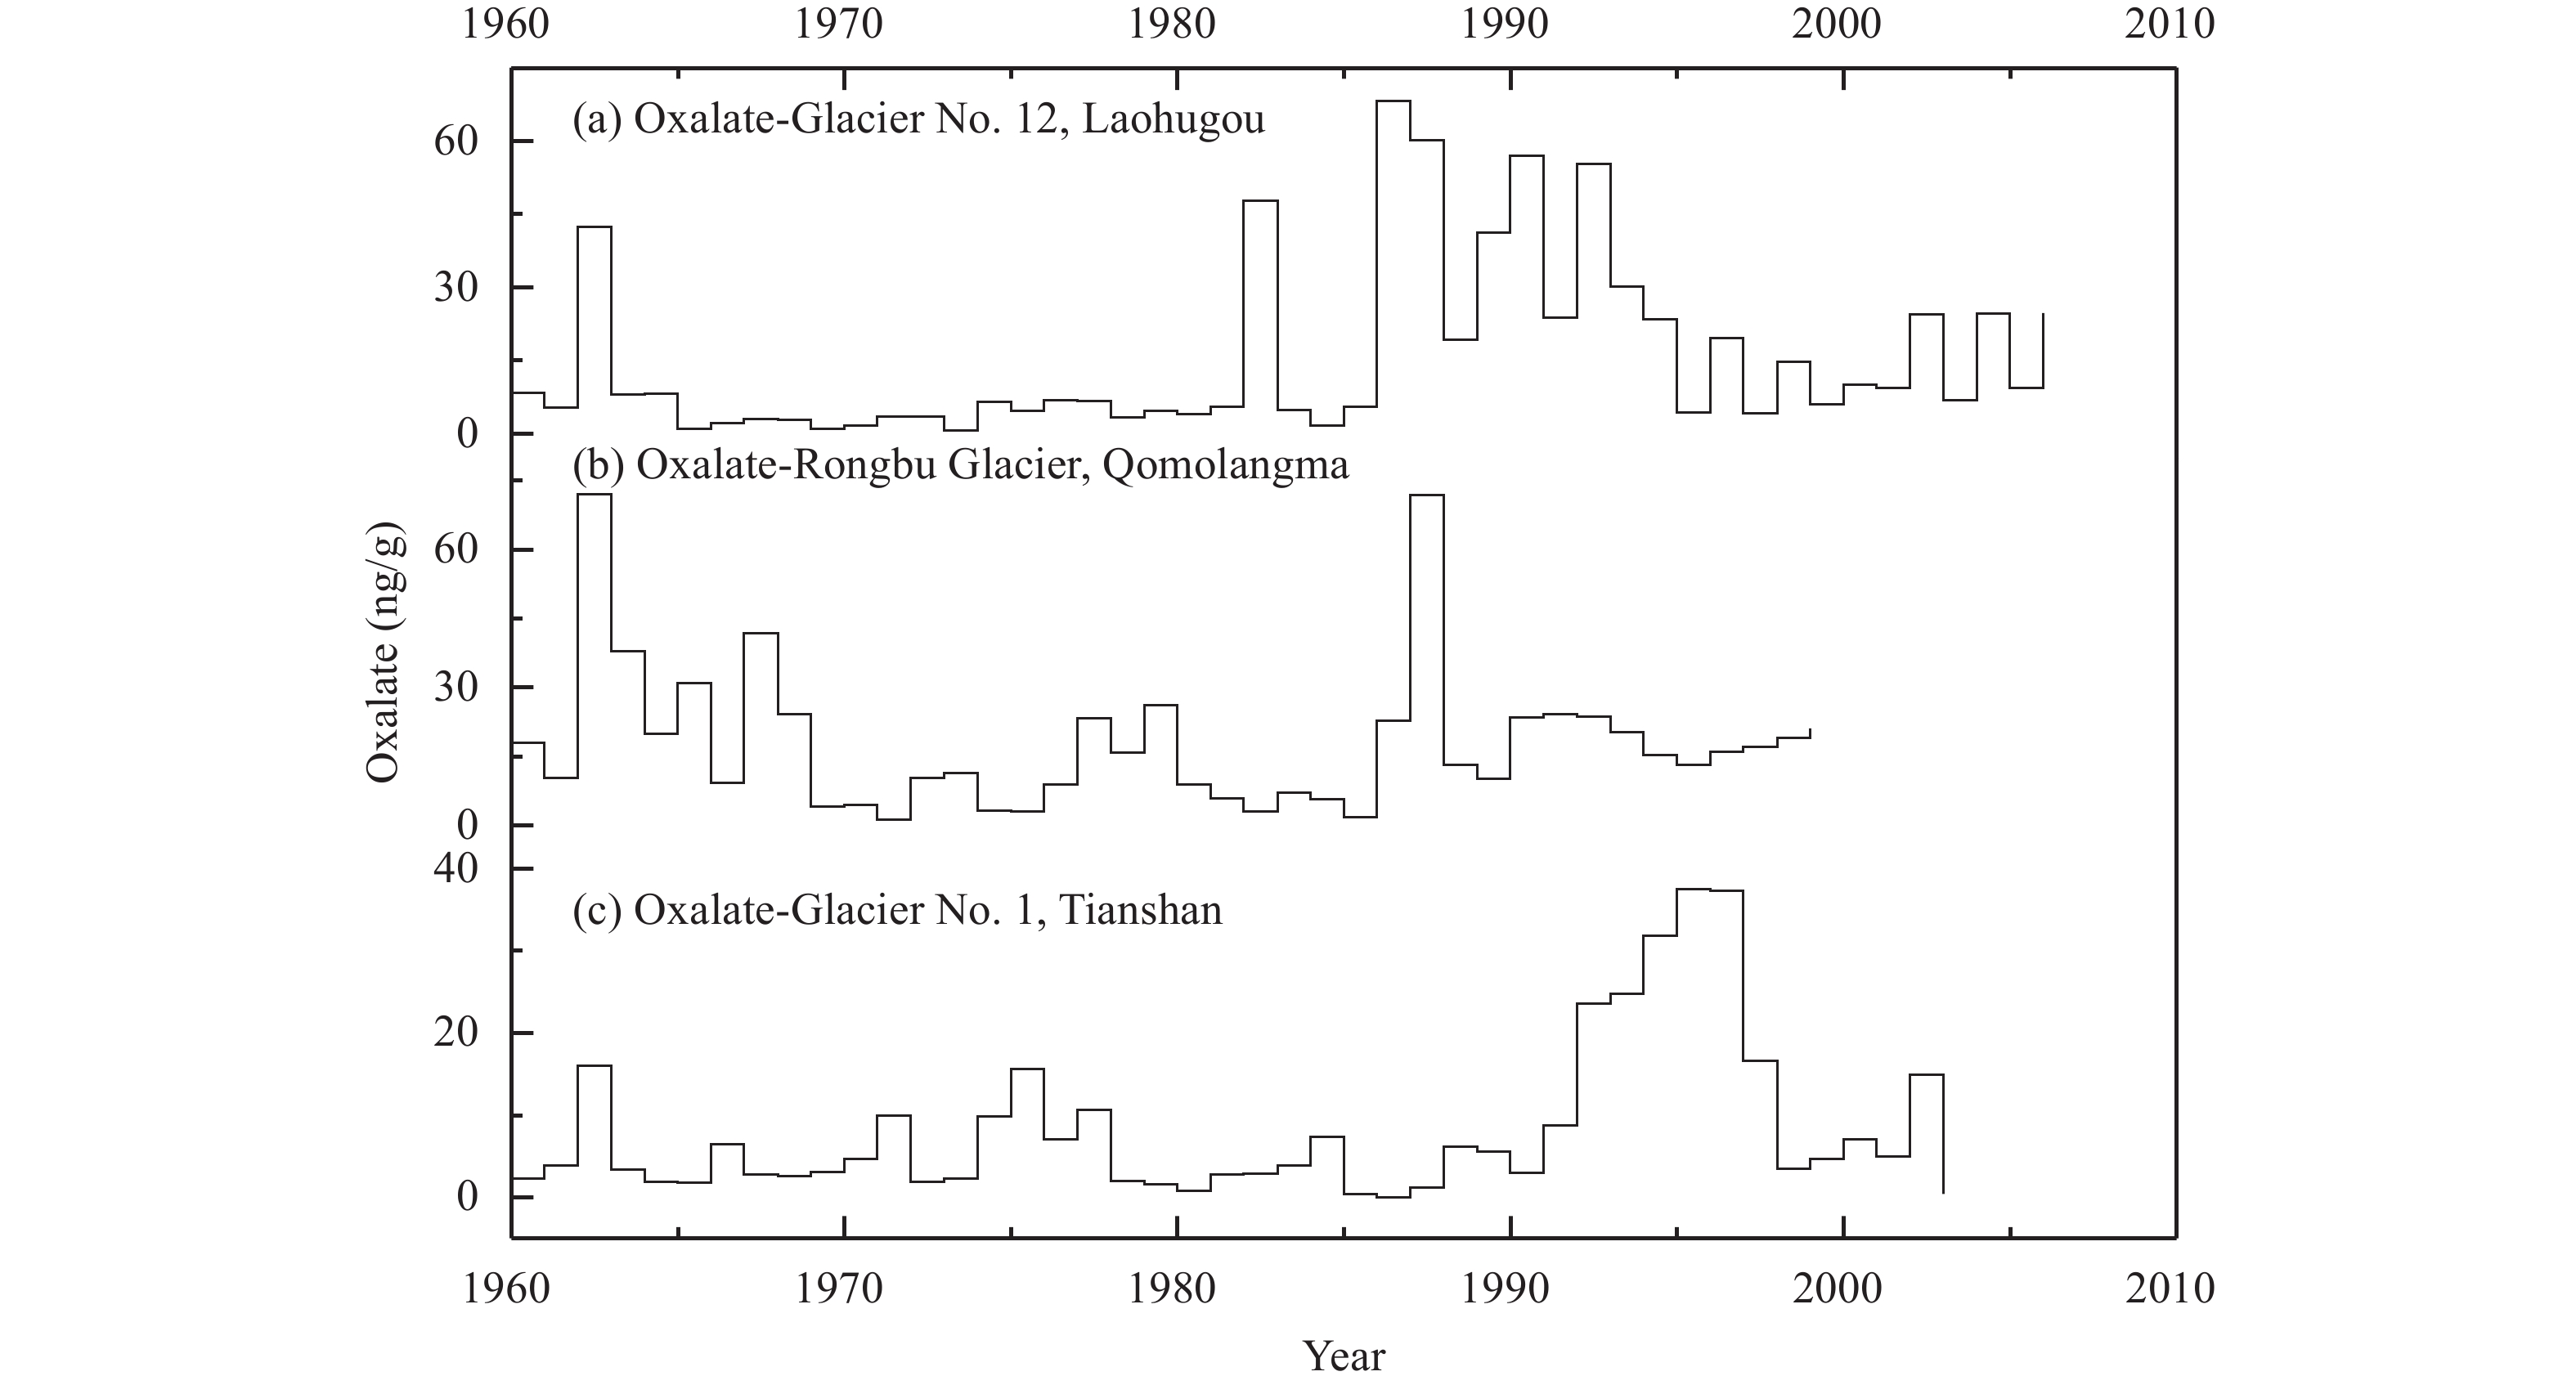
Figure 5 shows the variation of oxalate concentration in the ice cores of LHG Glacier No. 12, Tianshan Glacier No. 1, and Rongbu Glacier. Variation of the oxalate concentration is consistent in the three ice cores, and oxalate concentration was high in the early 1960s and mid-1980s. In the three ice cores, there is a peak value of oxalate around 1962, here we discuss only the effects on Glacier No. 12. They all indicated oxalate concentrations were higher from 1960 to 1970 (Kang et al., 2000 , Li et al., 2001 ). But the peak value of oxalate at LHG Glacier No. 12 in the mid-1960s likely was caused mainly by biomass burning. From 1958 to 1959, natural forests in the Qilian Mountains were seriously damaged during the Great Leap Forward and the Great Construction in China. Over a few years, total forest volume decreased by 5.3×10⁵ m3 in the Qilian Mountains, a 25% reduction (Compilation Committee of Local Chronicles of Gansu Province, 1999). A large number of forests were burned, releasing a large amount of oxalic acid, which led to the peak concentration of oxalate in the early 1960s. Since the 1980s, the main source of oxalate in the Tibetan Plateau ice cores has been industrial pollution (Li et al., 2001 , 2003), demonstrating organic pollutants from human activities have had an impact on the entire region on the Tibetan Plateau.
|
|
Table 2 Concentrations of (COO)22− in ice cores in the world |

|
Figure 5 Variation features of (COO)22− concentration in the ice core of LHG Glacier No. 12, Tianshan Glacier No. 1, and Rongbu Glacier in the Qomolangma |
Oxalate concentrations were continuously measured, based on a snowpit and a 46-year ice core from the LHG Glacier No. 12 in the Qilian Mountains on the northeast edge of the Tibetan Plateau. There has been a significant increase since the mid-1980s. The transport of oxalate in LHG Glacier No. 12 simulated by the HYSPLIT model indicated that the westerlies were dominant in the variation of oxalate concentration. The source of oxalate in LHG Glacier No. 12 is biomass burning and industrial emissions of the main cities around the glacier area.
There a high concentration of (COO)22− in LHG Glacier No. 12 on the Tibetan Plateau, with an average concentration similar to that in the Rongbu Glacier in the Qomolangma Mountains. Since the mid-1980s, (COO)22− has shown an increasing trend, mainly because oilfields, industry, and mining have also increased rapidly in the Qilian Mountains with economic development, releasing a large amount of hydrocarbons into the atmosphere by the burning of fossil fuels and industrial production; and a rise in temperature and anthropogenic pollutant emissions enhanced atmospheric photochemical reactions, thus accelerating the formation of organic acids.
Acknowledgments:This study was supported by Equipment Function Development Technology Innovation Project of Chinese Academy of Science(Y429C51005), the National Natural Science Foundation of China (41301064), Gansu Provincial Natural Science Foundation of China (1506RJZA286), National Found for Fostering Talents of Basic Science(Y311801001). We thank the Public Technology Service Center of Cold and the Arid Regions Environmental and Engineering Research Institute, CAS.
Andreae MO, Browell EV, Garstang M, et al. 1988. Biomass-burning emissions and associated haze layers over Amazonia. Journal of Geophysical Research: Atmospheres, 93(D2): 1509-1527. DOI:10.1029/JD093iD02p01509 |
Baboukas ED, Kanakidou M, Mihalopoulos N. 2000. Carboxylic acids in gas and particulate phase above the Atlantic Ocean. Journal of Geophysical Research: Atmospheres, 105(D11): 14459-14471. DOI:10.1029/1999JD900977 |
Compilation Committee of Local Chronicles of Gansu Province, 1999. Gansu Province Annals: Forestry Notes. Lanzhou: Gansu People's Publishing House, 4: 23081.
|
Cui XQ, Ren JW, Qin X, et al. 2010. Source of major ions from an ice core of the No. 12 Glacier in Laohugou Valley, Qilian Mountain. Sciences in Cold and Arid Regions, 2(6): 522-528. DOI:10.3724/SP.J.1226.2010.00522 |
Falkovich AH, Ganor E, Levin Z, et al. 2001. Chemical and mineralogical analysis of individual mineral dust particles. Journal of Geophysical Research: Atmospheres, 106(D16): 18029-18036. DOI:10.1029/2000JD900430 |
Hong Z L, 1997. Chemical Processing of Organic Raw Materials. Beijing: Chemical Industry Press, pp. 421–438.
|
Kahl JDW, Martinez DA, Kuhns H, et al. 1997. Air mass trajectories to Summit, Greenland: a 44-year climatology and some episodic events. Journal Geophysical Research: Oceans, 102(C12): 26861-26875. DOI:10.1029/97JC00296 |
Kang SC, Qin DH, Mayewski P, et al. 2000. The ice core C2O42− records in recent 200 years and its environmental significance in Mount Qomolangma Region
. China Environmental Science, 20(3): 203-206. DOI:10.3321/j.issn:1000-6923.2000.03.003 |
Kawamura K, Kaplan IR. 1987. Motor exhaust emissions as a primary source for dicarboxylic acids in Los Angeles ambient air. Environmental Science & Technology, 21(1): 105-110. DOI:10.1021/es00155a014 |
Kawamura K, Ikushima K. 1993. Seasonal changes in the distribution of dicarboxylic acids in the urban atmosphere. Environment Science & Technology, 27(10): 2227-2235. DOI:10.1021/es00047a033 |
Kawamura K, Kasukabe H, Barrie LA. 1996a. Source and reaction pathways of dicarboxylic acids, ketoacids and dicarbonyls in arctic aerosols: one year of observations. Atmospheric Environment, 30(10–11): 1709-1722. DOI:10.1016/1352-2310(95)00395-9 |
Kawamura K, Steinberg S, Kaplan IR. 1996b. Concentrations of monocarboxylic and dicarboxylic acids and aldehydes in southern California wet precipitations: Comparison of urban and nonurban samples and compositional changes during scavenging. Atmospheric Environment, 30(7): 1035-1052. DOI:10.1016/1352-2310(95)00404-1 |
Langner J, Rodhe H. 1991. A global three-dimensional model of the tropospheric sulfur cycle. Journal of Atmospheric Chemistry, 13(3): 225-263. DOI:10.1007/bf00058134 |
Lefer BL, Talbot RW, Harriss RH, et al. 1994. Enhancement of acidic gases in biomass burning impacted air masses over Canada. Journal of Geophysical Research: Atmospheres, 99(D1): 1721-1737. DOI:10.1029/93JD02091 |
Legrand M, De Angelis M. 1995. Origins and variations of light carboxylic acids in polar precipitation. Journal of Geophysical Research: Atmospheres, 100(D1): 1445-1462. DOI:10.1029/94JD02614 |
Legrand M, De Angelis M. 1996. Light carboxylic acids in Greenland ice: a record of past forest fires and vegetation emissions from the boreal zone. Journal of Geophysical Research: Atmospheres, 101(D2): 4129-4146. DOI:10.1029/95JD03296 |
Li XQ, Qin DH, Zhou H. 2001. Organic acids: differences in ice core records between Glacier 1, Tianshan, China and the polar areas. Chinese Science Bulletin, 46(1): 80-83. DOI:10.1007/BF03183216 |
Li XQ, Qin DH, Zhou H. 2003. Consistency of oxalate record between Tianshan and Everest regions and its environmental significance. China Environmental Science, 23(1): 1-6. DOI:10.3321/j.issn:1000-6923.2003.01.001 |
Li, Yao CD, Sheng WK, et al. 1997. A geochemical study on an 8 m depth ice core of Guliya ice cap. Journal of Glaciology and Geocryology, 19(2): 173-179. |
Matsumoto K, Nagao I, Tanaka H, et al. 1998. Seasonal characteristics of organic and inorganic species and their size distributions in atmospheric aerosols over the northwest Pacific Ocean. Atmospheric Environment, 32(11): 1931-1946. DOI:10.1016/S1352-2310(97)00499-8 |
Norton RB, Roberts JM, Huebert BJ. 1983. Tropospheric oxalate. Geophysical Research Letters, 10(7): 517-520. DOI:10.1029/GL010i007p00517 |
Qin X, Cui XQ, Du WT, et al. 2015. Variations of the alpine precipitation from an ice core record of the Laohugou glacier basin during 1960-2006 in western Qilian Mountains, China. Journal of Geographical Sciences, 25(2): 165-176. DOI:10.1007/s11442-015-1160-4 |
Ramachandran S. 2005. PM2.5 mass concentrations in comparison with aerosol optical depths over the Arabian Sea and Indian Ocean during winter monsoon
. Atmospheric Environment, 39(10): 1879-1890. DOI:10.1016/j.atmosenv.2004.12.003 |
Sempére R, Kawamura K. 1994. Comparative distributions of dicarboxylic acids and related polar compounds in snow, rain and aerosols from urban atmosphere. Atmospheric Environment, 28(3): 449-459. DOI:10.1016/1352-2310(94)90123-6 |
Sun WJ, Qin X, Ren JW, et al. 2011. Surface energy balance in the accumulation zone of the Laohugou Glacier No. 12 in the Qilian Mountains during ablation period. Journal of Glaciology and Geocryology, 33(1): 38-46. |
Talbot RW, Beecher KW, Harriss RC, et al. 1988. Atmospheric geochemistry of formic and acetic acids at a mid-latitude temperate site. Journal of Geophysical Research: Atmospheres, 93(D2): 1638-1652. DOI:10.1029/JD093iD02p01638 |
Wake CP, Mayewski PA, Xie ZC, et al. 1993. Regional distribution of monsoon and desert dust signals recorded in Asian glaciers. Geophysical Research Letters, 20(14): 1411-1414. DOI:10.1029/93GL01682 |
Yao TD, Wu GJ, Pu JC, et al. 2004. Relationship between calcium and atmospheric dust recorded in Guliya ice core. Chinese Science Bulletin, 49(7): 706-710. DOI:10.1007/BF03184269 |
Yao XH, Fang M, Chan CK. 2002. Size distributions and formation of dicarboxylic acids in atmospheric particles. Atmospheric Environment, 36(13): 2099-2107. DOI:10.1016/S1352-2310(02)00230-3 |
 2018, Vol. 10
