Article Information
- ZhiMing Li, Jian Chen, Kai Sun, Bin Zhang . 2017.
- Numerical simulation and experimental validation of moisture-heat coupling for saturated frozen soils
- Sciences in Cold and Arid Regions, 9(3): 250-257
- http://dx.doi.org/10.3724/SP.J.1226.2017.00250
Article History
- Received: November 1, 2016
- Accepted: December 1, 2016
2. School of Civil Engineering, Harbin Institute of Technology, Harbin, Heilongjiang 150090, China;
3. Heilongjiang Water Conservancy Science Research Institute, Harbin, Heilongjiang 150080, China
Common moisture-heat coupling plays the central role in deterioration of some infrastructure projects, especially those under service in cold regions. For example, many canals built in the Northeast of China to facilitate the allocation of water in the agricultural sector of China have been damaged more or less by freezing-and-thawing action, which is a complex process of moisture-heat coupling due to the complicated dynamic performance of soil texture, influenced significantly by the water content of different phases.
Many research studies have been carried out to investigate the coupling of moisture and heat, and its influence on soil performance. According to well-known unfrozen water dynamics, Harlan (1973) first derived the governing equations for the coupled action of water and heat on porous materials. Based on this initial Harlan's theory, some other equations coupling moisture and temperature interactions were also proposed (Taylor and Luthin, 1978; Shen and Branko, 1990; Leonid, 2009; Liu and Yu, 2011; Tan et al., 2011 ; Zhou and Li, 2012; Yuan et al., 2014 ; Bai et al., 2015 ; Zhang et al., 2016 ). But it is hard for these models to reflect the frost heave caused by moisture transport. Therefore, some scholars revealed the formation of segregated ice using different complicated criterions (Miller, 1972; Gilpin, 1980; Konrad, 1980; O'Neil and Miller, 1985; Thomas et al. 2009 ; Azmatch et al., 2012 ; Zhou et al., 2014 ). Recently, experimental research and numerical simulations were also conducted to explore the freezing-and-thawing actions on canals (Zhang and Kushwaha, 1998; Liu et al., 2011 ; Li et al., 2012 ; Zhong et al., 2013 ; Li et al., 2015 ). Although the results obtained could provide some valuable suggestions for the design and maintenance of canals under service in seasonally frozen regions, many parameters adopted in these models are not easy to determine accurately, which may hinder wide engineering applications of these models.
Based on the Harlan's theory, a new set of governing equations in terms of temperature and porosity are proposed in this paper to model the coupled interaction of moisture and temperature on soils. The parameters employed in this new model are all determined while taking the important coupled interaction of moisture and temperature into account. Numerical investigations were also performed on soil-column specimens to verify the newly proposed models. These efforts indicated that the simulated results from our model agreed very well with the experimental measurements. Moreover, the approach is more convenient and easier to apply for engineering design. In addition, a case study was also carried out to analyse the performance of canals in the northern Nenjing project.
2 Mathematical model and equations 2.1 Basic assumptionsTo simplify analysis of the coupled interaction of temperature and water, four basic assumptions were first adopted.
(1) Heat transfer in soil material is governed by the conduction mechanism. The contribution of convection could be neglected.
(2) Both soil particles and formed ice lens are incompressible.
(3) Water transport obeys Darcy's Law.
(4) Heat losses through insulated walls can be neglected in numerical simulation.
2.2 Temperature field equationBased on Fourier's law and the law of energy conservation, the temperature field equation considering water-ice phase change can be expressed as
| $\rho C\frac{{\partial T}}{{\partial t}} = div(\lambda gradT) + L{\rho _i}\frac{{\partial {\theta _i}}}{{\partial t}}$ | (1) |
where C denotes specific heat capacity; T represents temperature; div(·) and grad(·) are divergence and gradient operators, respectively; λ represents thermal conductivity; ρ and ρi denote soil and ice densities, respectively; t represents time; L is the latent heat; and θi is volumetric ice content.
2.3 Hydraulic field equationBased on Richards's equation, a special term is additionally adopted to consider the influence of ice-lens formation in the hydraulic field equation, which can be expressed as
| $\frac{{\partial {\theta _u}}}{{\partial t}} = div\left[ {D({\theta _u})grad{\theta _u}} \right] + \frac{{\partial {k_y}({\theta _u})}}{{\partial y}} - \frac{{{\rho _i}}}{{{\rho _w}}}\frac{{\partial {\theta _i}}}{{\partial t}}$ | (2) |
in which θu is the volumetric content of unfrozen water; θi is the volumetric content of ice; D(θu) denotes soil-water diffusivity; ky(θu) is hydraulic conductivity in the y-direction, which considers the effect of gravity; and ρw represents water density.
An impedance coefficient I was introduced by Taylor and Luthin (1978) to consider the resistance of water transport provided by the ice lens formed, then the soil water diffusivity D(θu) is yielded as
| $D({\theta _u}) = \frac{{k({\theta _u})}}{{C({\theta _u})}} \cdot I$ | (3) |
| $I = {10^{ - 10{\theta _i}}}$ | (4) |
where k(θu) is hydraulic conductivity; C(θu) is specific water capacity; and I denotes the impedance coefficient. Moreover, hydraulic conductivity and specific water capacity can be calculated according to the widely adopted the Gardner model and the van Genuchten model for the soil-water-characteristics curve (SWCC), respectively (Lu, 2004).
2.4 Coupled moisture-heat modelThe unfrozen water and the temperature in frozen soils are always kept under an equilibrium state of dynamic balance. Herein, an empirical formula is adopted to quantify the relationship between temperature and the ice ratio as
| $Si = \left\{ \begin{array}{l}1 - {[1 - (T - T\!\!f)]^a},\quad T \le T\!\!f\\0,\quad T > T\!\!f\end{array} \right.$ | (5) |
where Si represents the ice ratio; Tf is the freezing temperature; and a is the freezing coefficient.
Obviously, the sum of the water ratio Sw and the ice ratio Si equal 1 for saturated soils. Then the volumetric content of ice and unfrozen water can be written
| ${\theta _i} = n \cdot S\!i,\;\;\;\;\;{\theta _u} = n \cdot S\!w$ | (6) |
Substituting Equation (6) into Equation (1), the temperature equation, Equation (1), can be rearranged as,
| $(\rho C - L{\rho _i}n\frac{{\partial Si}}{{\partial T}})\frac{{\partial T}}{{\partial t}} = div(\lambda gradT) + L{\rho _i}Si\frac{{\partial n}}{{\partial t}}$ | (7) |
Similarly, the hydraulic equation, Equation (2), can be rewritten as,
| $\begin{split}(Sw + \displaystyle \frac{{{\rho _i}}}{{{\rho _w}}} \cdot Si) & \frac{{\partial n}}{{\partial t}} - (1 - \frac{{{\rho _i}}}{{{\rho _w}}})\frac{{{\rm{d}}Si}}{{{\rm{d}}T}}\frac{{{\rm{d}}T}}{{{\rm{d}}t}}n = \\[5pt]& div(Dgrad(nSw)) + \displaystyle \frac{{\partial {k_y}({\theta _u})}}{{\partial y}}\end{split}$ | (8) |
Equations (7) and (8) are the governing equations for the coupled interaction of temperature and water, regarding porosity and temperature as intrinsic variables.
Equations (7) and (8) can be numerically solved by the well-known Galerkin method. After reasonably choosing the trial function u and making v equal to v=λgradT and v= D(θu)gradθu, the weak form of the governing PDEs can be yielded as follows:
| $\begin{split}\oint_\Gamma {u\lambda \displaystyle ( - \frac{{\partial T}}{{\partial y}}} {\rm{d}}x + \frac{{\partial T}}{{\partial x}}{\rm{d}}y) + \iint_D { \displaystyle ( - vgradu + uL{\rho _i}S \!\! i\frac{{\partial n}}{{\partial t}}} \\[5pt] +\displaystyle u(L{\rho _i}n\frac{{\partial S \!\! i}}{{\partial T}} - \rho {C_p})\frac{{\partial T}}{{\partial t}}){\rm{d}}x{\rm{d}}y = 0\end{split}$ | (9) |
| $\begin{split}\oint_\Gamma & {uD ( - \frac{{\partial nS\!\!w}}{{\partial y}}} {\rm d}x + \frac{{\partial nS\!\!w}}{{\partial x}}{\rm d}y) + \\& \quad \quad u\frac{{\partial {k_y}({\theta _u})}}{{\partial y}} - u\frac{{{\rho _i}}}{{{\rho _w}}}\frac{{\partial nS \!\! i}}{{\partial t}} - u\frac{{\partial nS \!\! w}}{{\partial t}}{\rm{d}}x{\rm{d}}y = 0\end{split}$ | (10) |
Based on the governing equations proposed above, a numerical simulation was also carried out and compared to the corresponding experimental measurements of a soil-column test, which is reported with details in the literature (Zhou, 2012).
Zhou (2012) conducted an interesting experiment on a cylindrical soil sample of 10-cm length and 3-cm radius. Its volumetric water content was 18.9%, and other basic properties are listed in Table 1. Initially, the temperature of the soil column was controlled at 0.7 °C. The sample was also thermally insulated on the side and the bottom surfaces. Moreover, its top surface was always exposed to a constant temperature of −2.3 °C. In another aspect, the soil sample was supplied by non-pressure water at the bottom. The Dirichlet boundary conditions of the soil-column test are simply illustrated in Figure 1.
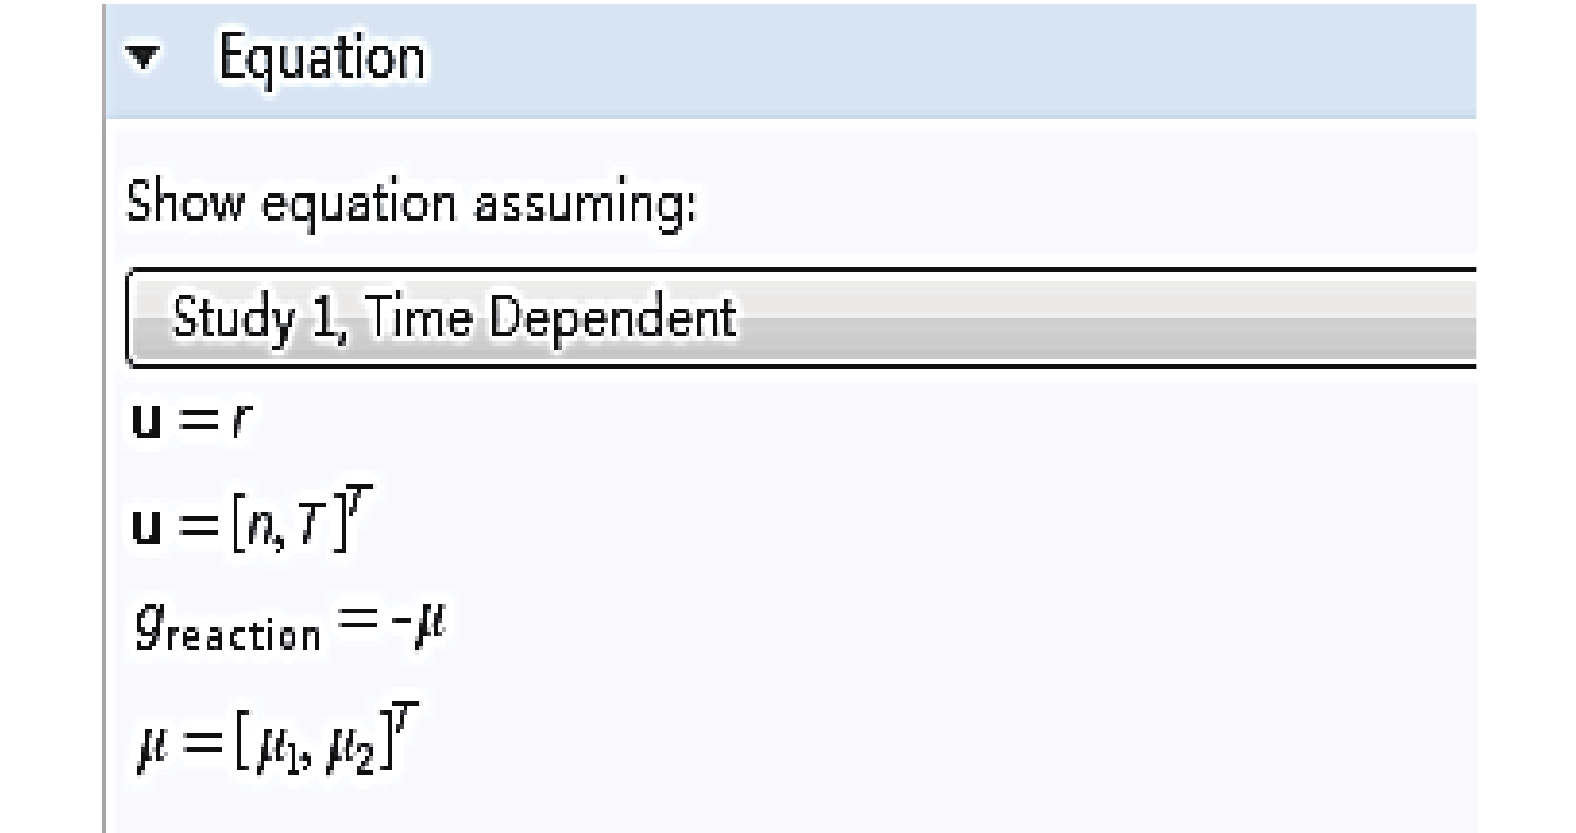
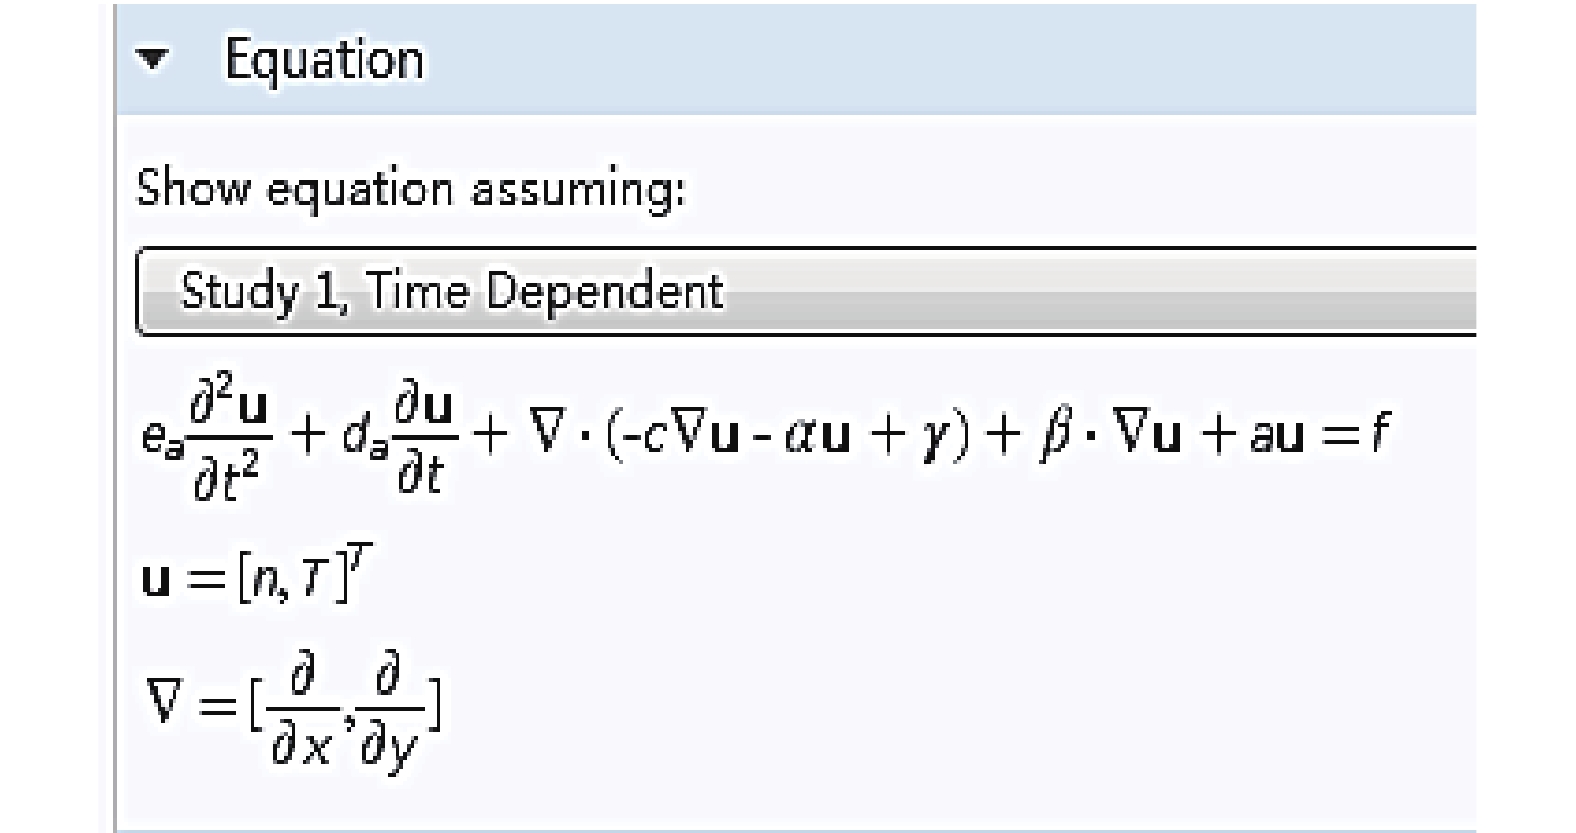
The soil-column test is also numerically simulated by the proposed governing equations. Significantly, the coefficient PDE mathematic module of Comsol Multiphysics was employed to solve the governing equations, as shown in Figure 2.
The basic properties of soil are adopted as being exactly the same as reported by Zhou (2012), as listed in Table 1. However, the numerical model proposed and adopted herein is quite different. The numerical calculation of the proposed governing equations by COMSOL takes about 120 hours.
|
| Figure 1 Dirichlet boundary condition |
|
| Figure 2 Coefficient PDE equation |
| Parameter | Value | Units | Description |
| a | –2 | 1 | Freezing coefficient |
| Tf | –0.35 | °C | Freezing temperature |
| L | 334.56 | kJ/kg | Latent heat |
| ρs | 2,650 | kg/m3 | Density of soil |
| ρi | 900 | kg/m3 | Density of ice |
| Ci | 1,874 | kJ/(m3·K) | Heat capacity of ice |
| Cf | 2,430 | kJ/(m3·K) | Heat capacity of soil |
| Cw | 4,180 | kJ/(m3·K) | Heat capacity of water |
| drs | 1.2 | W/(m·K) | Thermal conductivity of soil |
| drw | 0.58 | W/(m·K) | Thermal conductivity of water |
| dri | 2.22 | W/(m·K) | Thermal conductivity of ice |
The dynamic temperature of a soil sample at different positions was calculated and plotted in Figure 3. It is obviously indicated that the simulated results by FEM agrees very well with reported test results. The temperature of the soil sample significantly changed with time within 10 hours and then remained almost constant.
The temperature distribution of the soil sample at different times is also sketched in Figure 4. Apparently, the temperature becomes lower from bottom to top and gradually approaches a linear distribution with respect to height. Besides, the temperature gradient is relatively large in the frozen zone; and the temperature distribution is also very sharp there. However, the variation of temperature in the unfrozen zone is gentle, with a small temperature gradient. This observation is mainly attributed to different thermal parameters and the latent heat of phase change from water to ice.
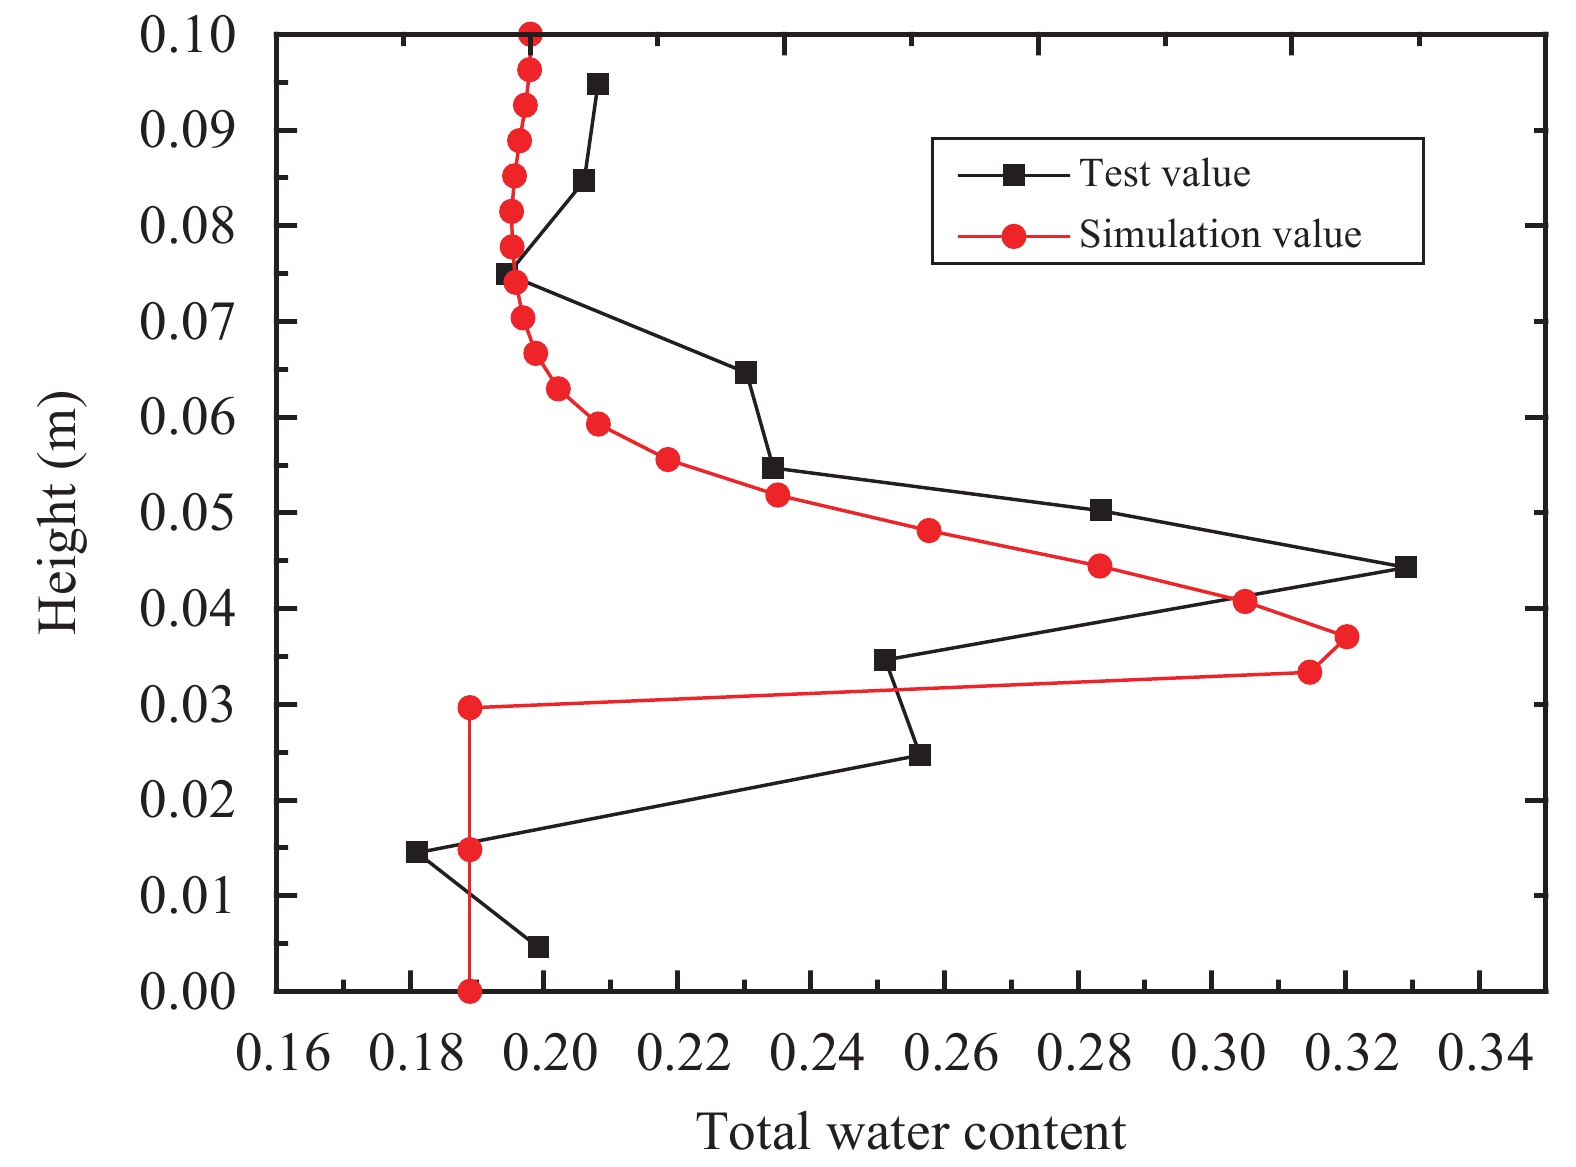
3.3 Numerical simulation of the hydraulic fieldThe total water-content distribution from both experimental tests and numerical simulation at 120 hours is shown in Figure 5. It can be seen that, the FEM-simulated result follows the test results very well, although there is a little bias at the top. This bias is possibly caused by the initial temperature of the soil column being higher than 0.7 °C, which makes some water transport to the frozen zone. In addition, the position of the maximum simulated water content of the soil sample is a little lower than that from experimental test. The bias is due to the phase transition temperature being lower than −0.35 °C in the soil sample. As mentioned above, the temperature field has a great effect on moisture distribution. By comparing Figure 4 to Figure 5, it is easy to conclude that the critical position of phase transition is rather near the position with maximum water content.

|
| Figure 3 Dynamic temperature at different positions |

|
| Figure 4 Temperature distribution at different times |
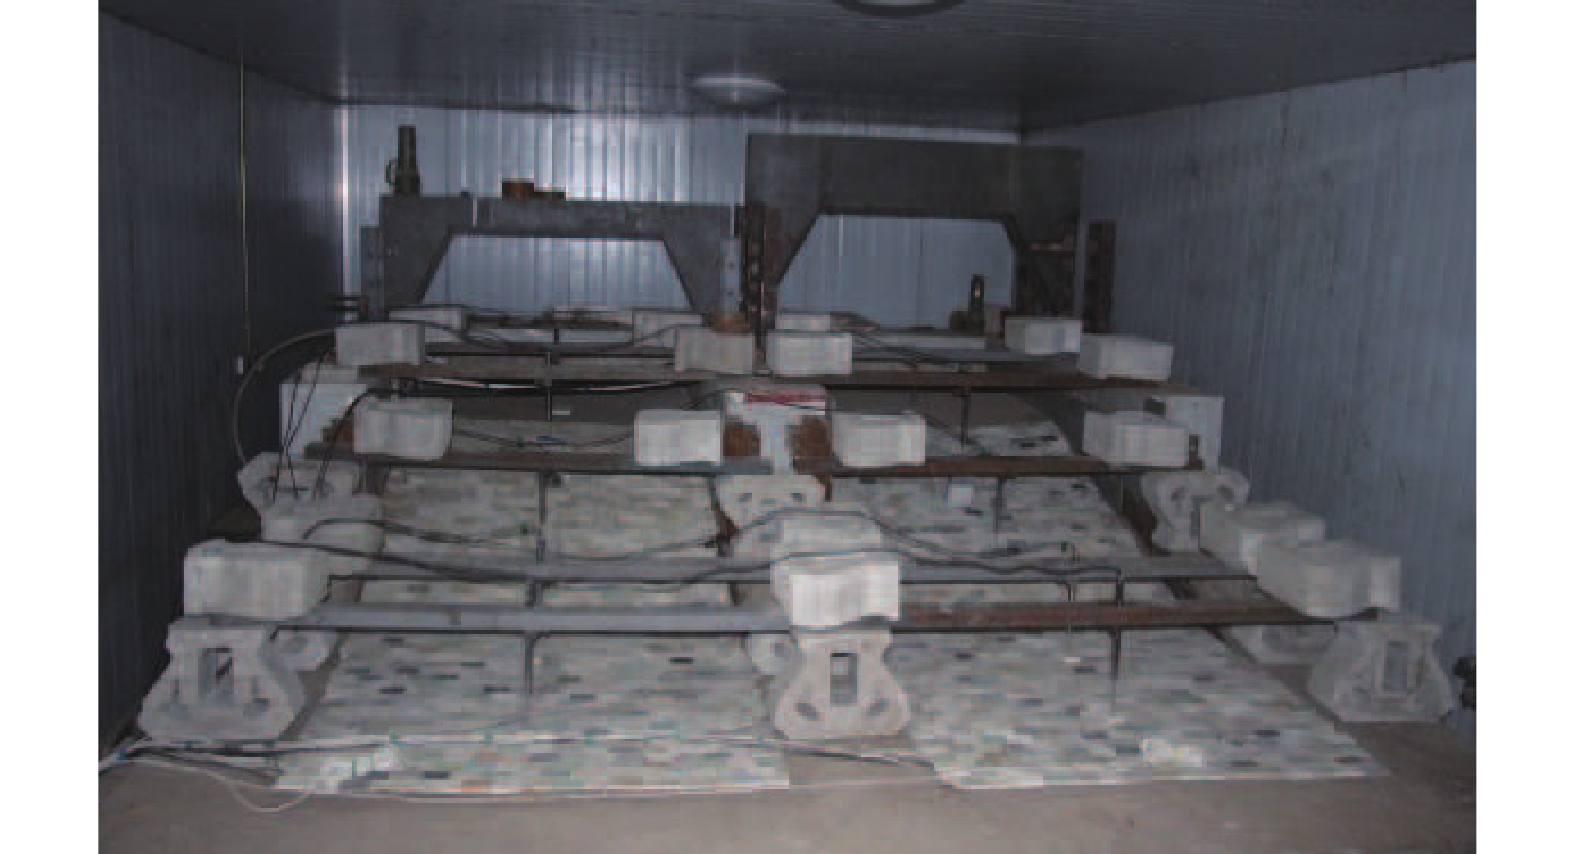
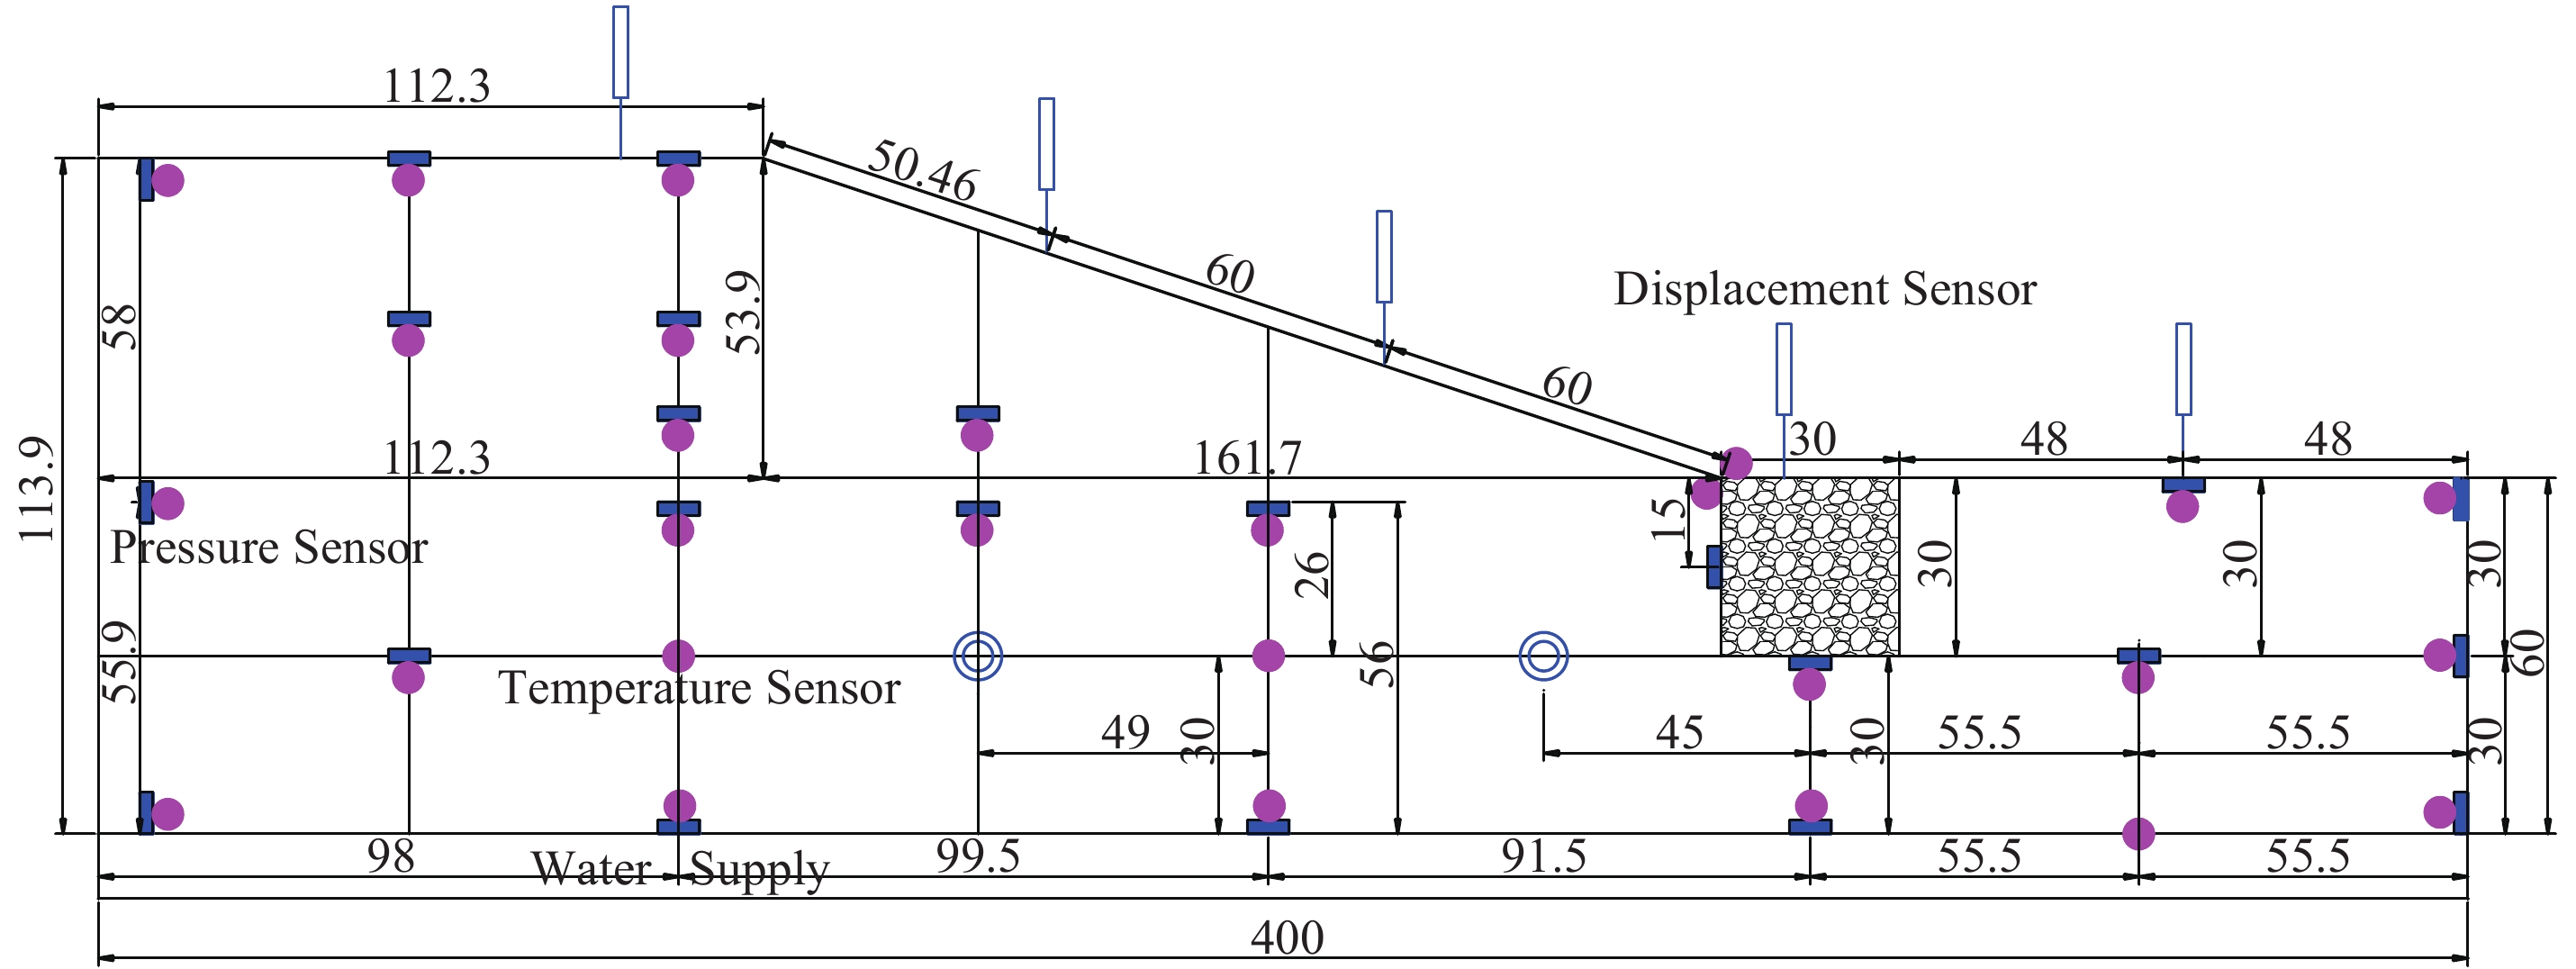
Another model test was also carried out in our low-temperature laboratory, as shown in Figures 6 and 7. The temperature was automatically controlled and can be achieved as low as −35 °C. The test chamber (length×width×height) is 4.00m×1.36m×1.44m. The data-acquisition system constitutes the XLD temperature-inspection instrument, the DT615 data-collection instrument, 27 PT100 temperature sensors, 5 WDL displacement sensors, and 22 YT-200G soil-pressure sensors. Heave measurements are made to a precision of ±0.01 mm from water absorption. Moreover, the accuracy of temperature and soil-pressure sensors are ±(0.3+0.005|T|) and ±0.5 kPa, respectively.
Experimentally monitored data included dynamic temperature and frost heave, as well as stress of the soil. A geometrical scale 1:10 was adopted to design the scale model. The size of the model and the setting of various sensors are depicted in Figure 8.
The clay soil in the model test was taken from the field of the Beiyin Canal in Daqing region. The liquid limit and plastic limit were 36.6% and 17.5% for the clay soil, respectively. The scaled canal was filled with this kind of clay, having a dry density of 1,540 kg/m3 and porosity of 0.3. The sensors were installed at the designated places, and the initial values of each sensor were recorded.
|
| Figure 5 Water-content change with height (120 h) |
|
| Figure 6 Low-temperature laboratory |

|
| Figure 7 Monitoring system of the test model |
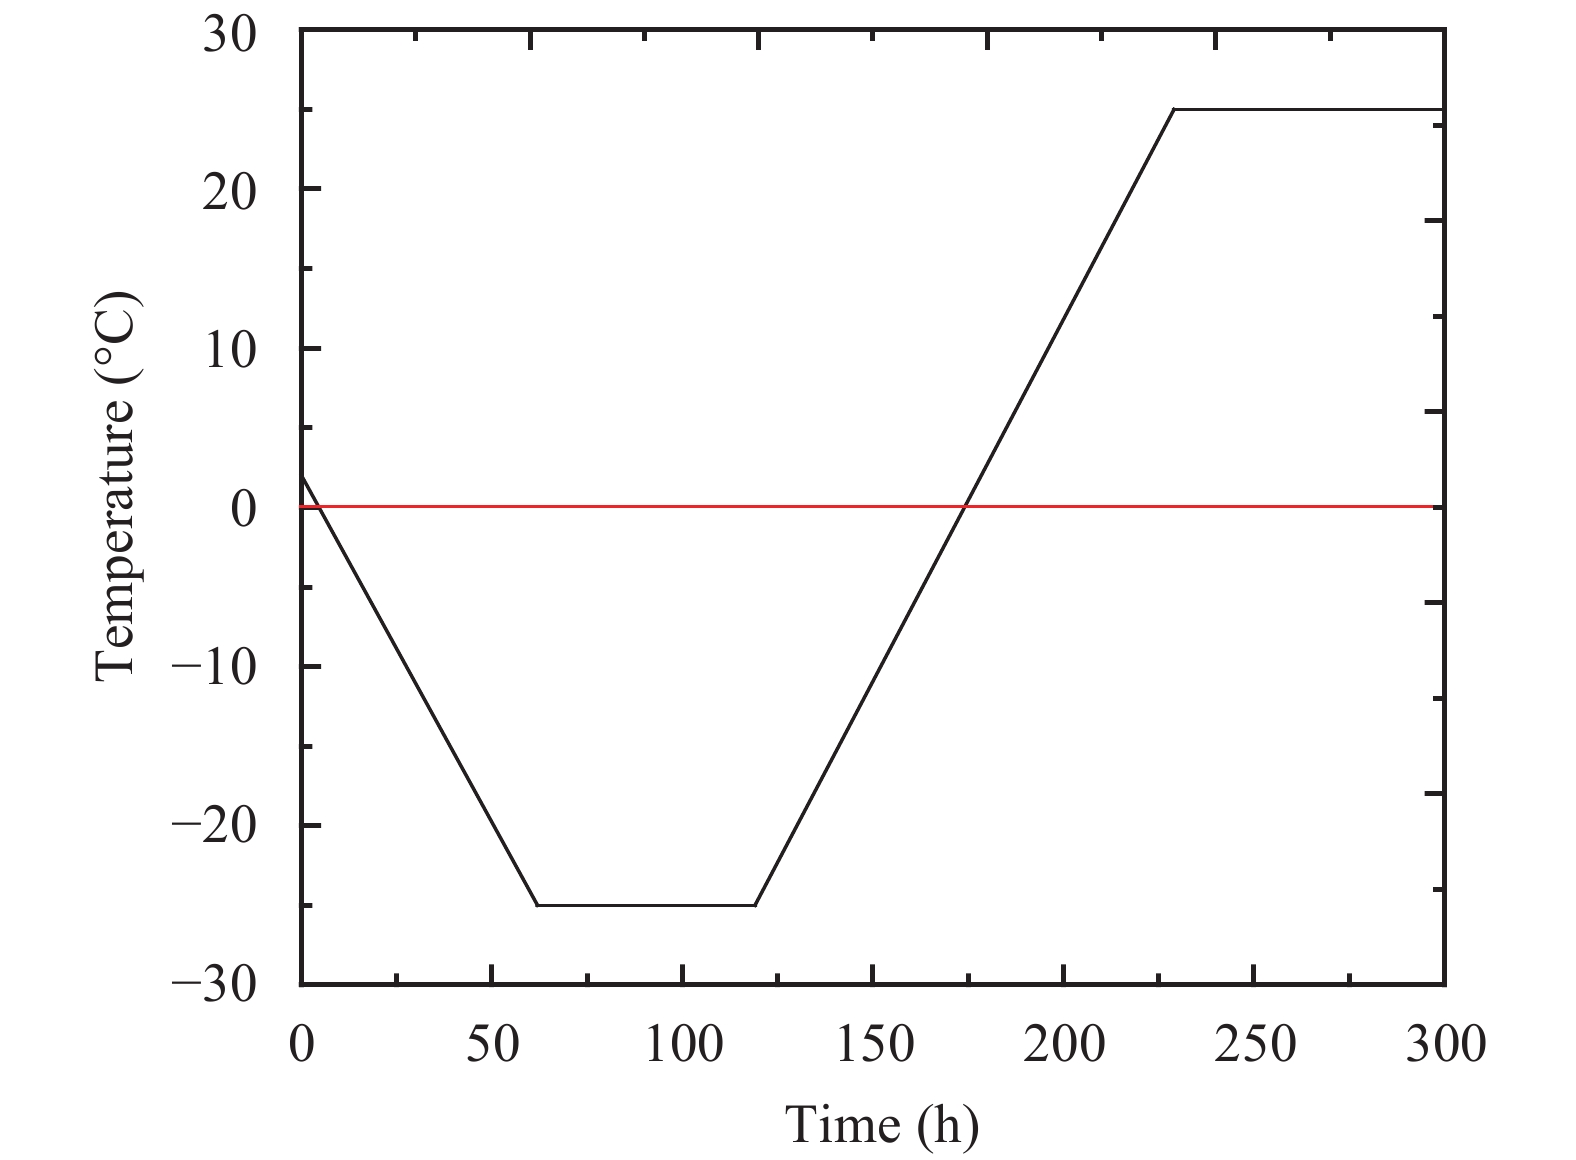
After careful preparation of the scaled canal and installation of various sensors, the model was filled with liquid water long enough to saturate it. Non-pressure water was always supplied at the bottom surface. Finally, the temperature of the scaled canal model was controlled at 8 °C; and the canal was continually cooled down until uniform temperature distribution was reached. The environmental temperature was controlled with great care to follow the evolution process, lasting for 282 hours, as shown in Figure 9. The temperature and the time scales were adopted as 1:1.5 and 1:16.7, respectively.
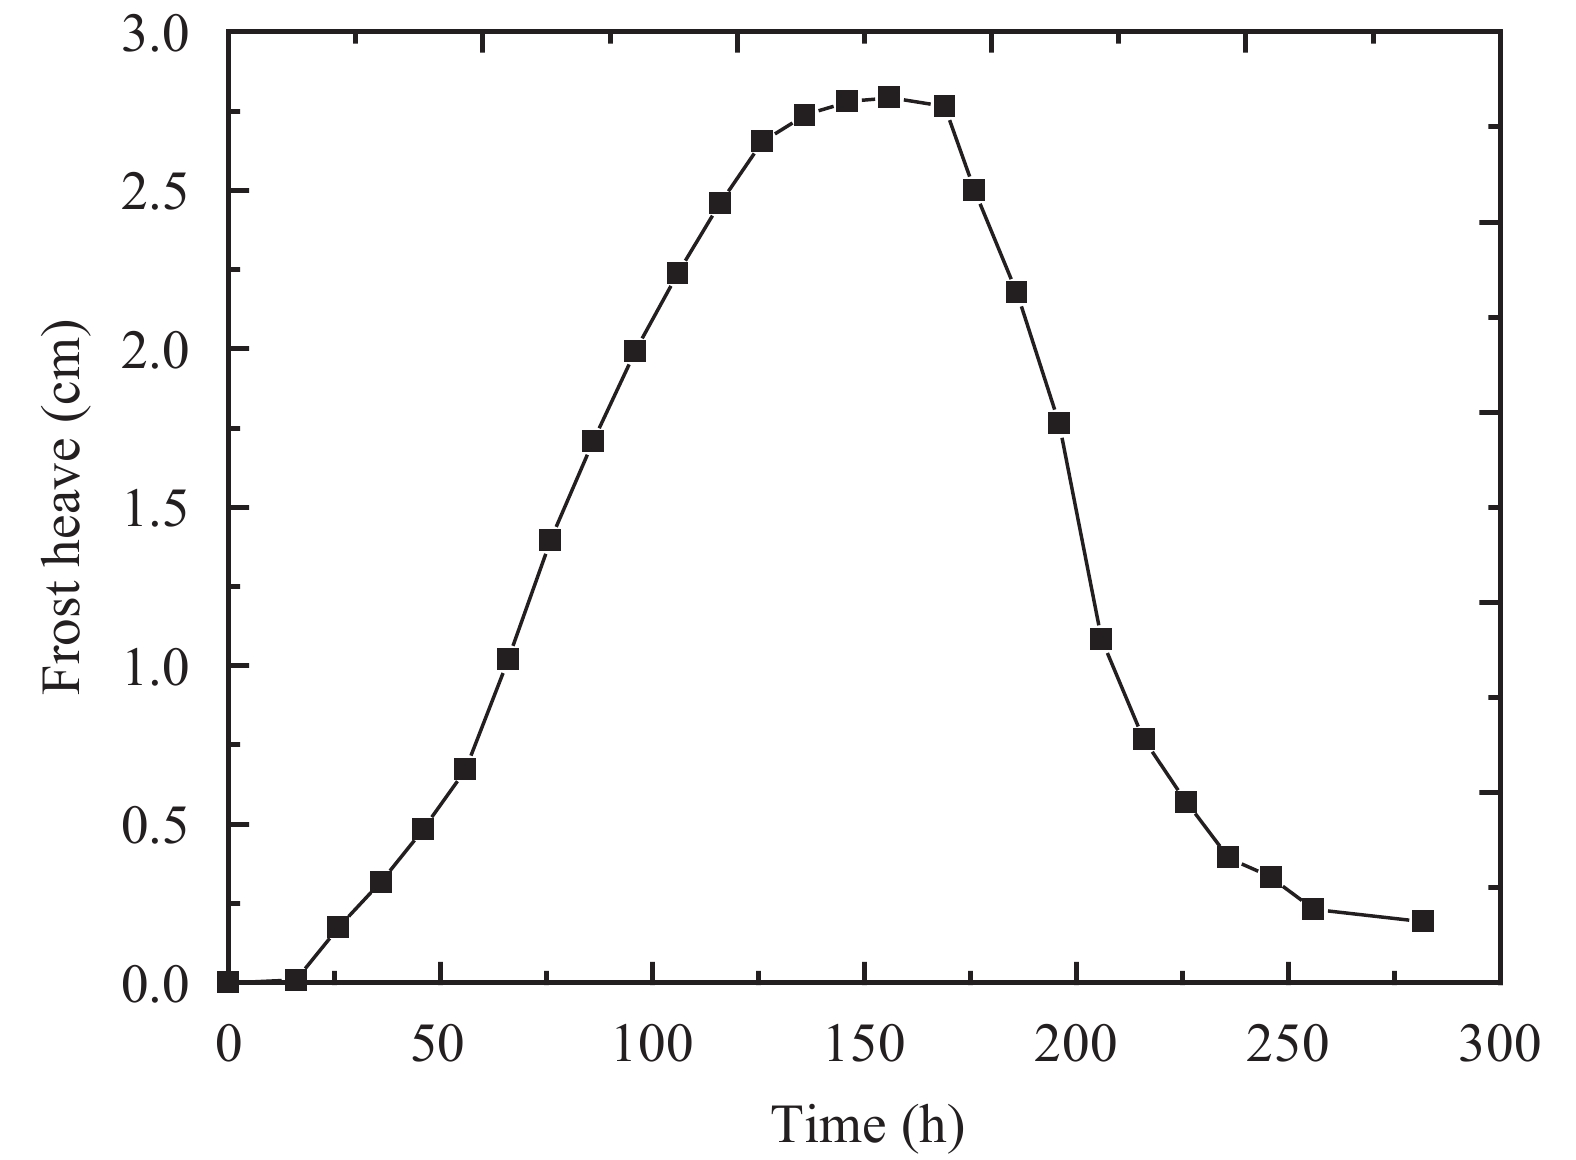
4.2 Numerical analysis for the model testThe calculated dynamic frost heave for the scaled model is shown in Figure 10. The simulated maximum frost heave is 2.79 cm, which is rather close to the measured value of 2.91 cm.
To validate the newly proposed model of coupled moisture and temperature, both the experimentally monitored and the numerically simulated temperature distribution at three critical times are shown in Figures 11 to 13. It is indicated that the simulated temperature agrees well with the test data at the bottom of the scaled canal. However, the value from numerical simulation is to some extent different from the test data at the top of the canal. This difference is caused by an inadequate water supply, leaving the top part of soil unsaturated. The lower the water content is, the less energy is released.
The initial temperature distribution was kept steady. Right after the top surface of the scaled canal was cooled for 119 h and the frost heave appeared maximum, the transition to another warming process lasted for 41 h. The warming continued; the frozen layer became thinner but still existed in the middle and bottom of the model, as shown in Figure 13. Not long afterwards, the ice melted completely, which implied that the thawing states would appear soon.
|
| Figure 8 Sensor-arrangement plan (units: cm) |
|
| Figure 9 Controlled evolution of environmental temperature |
|
| Figure 10 Frost-heave changes with time at the canal bottom |

|
| Figure 11 The experimentally observed and simulated temperature distribution at the beginning of cooling (unit: °C) |

|
| Figure 12 The experimentally observed and simulated temperature distribution when the maximum frost heave is reached (unit: °C) |

|
| Figure 13 The experimentally observed and simulated temperature distribution at the beginning of melting (unit: °C) |
To understand the complicated process of moisture-heat coupling, a simple coupled model was proposed and then validated by an experimental test on a soil column. The experimental test on a scaled canal model was further carried out in one freezing-and-thawing cycle. The scaled-model test was also numerically simulated by FEM. The following conclusions could be drawn.
(1) Based on the moisture-transport theory, the total water content in the frozen fringe is much higher than that in other zones during the freezing stage. When it begins to melt, the abundant water makes soil strength lower, which brings a negative effect on slope stability.
(2) From the scaled-model test, it can be seen that the temperature distribution was dramatically affected by water content due to the remarkable latent heat. The simulated results of the maximum frozen depth and frost heave are very close to the measured values, which provides a good reference for the design of the canal projects in cold regions.
Acknowledgments:The financial support from the National Natural Science Foundation of China (No. 51478146, No. 51409072) for the research work presented herein is gratefully acknowledged.
| Azmatch TF, Sego DC, Arensonb LU, et al, 2012. New ice lens initiation condition for frost heave in fine-grained soils. Cold Regions Science and Technology, 82: 8–13. DOI: 10.1016/j.coldregions.2012.05.003 |
| Bai QB, Li X, Tian YH, et al., 2015. Equations and numerical simulation for coupled water and heat transfer in frozen soil. Journal of Geotechnical Engineering, 37(7): 131–136. DOI: 10.11779/ CJGE2015S2026. (in Chinese) |
| COMSOL Multiphysics User's Guide (Version:5.1a). Stockholm: COMSOL AB, 2015. |
| Gilpin RR, 1980. A model for the prediction of ice lensing and frost heave in soils. Water Resources Research, 16(5): 918–930. DOI: 10.1029/WR016i005p00918 |
| Harlan RL, 1973. Analysis of coupled heat-fluid transport in partially frozen soil. Water Resource Research, 9(5): 1314–1322. DOI: 10.1029/WR009i005p01314 |
| Konrad M, 1980. A mechanistic theory of ice lens formation in fine-grained soils. Canadian Geotechnical Journal, 17(4): 473–486. DOI: 10.1139/t80-056 |
| Leonid B, 2009. The modelling of the freezing process in fine-grained porous media: Application to the frost heave estimation. Cold Regions Science and Technology, 56(2): 120–134. DOI: 10.1016/j.coldregions.2008.11.004 |
| Li SY, Zhang MY, Tian YB, et al, 2015. Experimental and numerical investigations on frost damage mechanism of a canal in cold regions. Cold Regions Science and Technology, 116: 1–11. DOI: 10.1016/j.coldregions.2015.03.013 |
| Li Z, Liu SH, Feng YT, et al, 2012. Numerical study on the effect of frost heave prevention with different canal structures in seasonally frozen ground regions. Cold Regions Science & Technology, 85(1): 242–249. DOI: 10.1016/j.coldregions.2012.09.011 |
| Liu XD, Wang ZZ, Yan CC, et al., 2011. Exploration on anti-frost heave mechanism of lining canal with double films based on computer simulation. Transactions Chinese Society Agricultural Engineering, 27(1): 29–35. DOI: 10.3969/j.issn.1002–6819.2011.01.005. (in Chinese) |
| Liu Z, Yu X, 2011. Coupled thermo-hydro-mechanical model for porous materials under frost action: theory and implementation. Acta Geotechnica, 6(2): 51–65. DOI: 10.1007/s11440-011-0135-6 |
| Lu N, 2004. Unsaturated Soil Mechanics. John Wiley and Sons, pp. 386–413. |
| Miller RD, 1972. Freezing and heaving of saturated and unsaturated soils. Highway Research Record, 393: 1–11. DOI: 10.1021/ba-1972-0110.ap001 |
| O'Neil K, Miller RD, 1985. Exploration of a rigid-ice model of frost heave. Water Resources Research, 21(3): 281–296. DOI: 10.1029/WR021i003p00281 |
| Shen M, Branko L, 1990. Modeling of coupled heat moisture and stress field in freezing soil. Cold Regions Science and Technology, 14(3): 237–246. DOI: 10.1016/0165-232X(87)90016-4 |
| Tan XJ, Chen WZ, Tian HM, et al, 2011. Water flow and heat transport including ice/water phase change in porous media: Numerical simulation and application. Cold Regions Science and Technology, 68(s1–s2): 74–84. DOI: 10.1016/j.coldregions.2011.04.004 |
| Taylor GS, Luthin JN, 1978. A model for coupled heat and moisture transfer during soil freezing. Canadian Geotechnical Journal, 15(4): 548–555. DOI: 10.1139/t78-058 |
| Thomas HR, Cleall PJ, Li YC, et al, 2009. Modelling of cryogenic processes in permafrost and seasonally frozen soils. Géotechnique, 59(3): 173–184. DOI: 10.1680/geot.2009.59.3.173 |
| Yuan C, Yang CS, Zhang LH, 2014. Mechanisms discussion of frost heave and test verifications of moisture migration. Sciences in Cold and Arid Regions, 6(5): 447–454. DOI: 10.3742/SP.J.1226.2014.00447 |
| Zhang S, Teng JD, He ZY, et al, 2016. Importance of vapor flow in unsaturated freezing soil: a numerical study. Cold Regions Science and Technology, 126: 1–9. DOI: 10.1016/j.coldregions.2016.02.011 |
| Zhang ZX, Kushwaha RL, 1998. Modeling soil freeze-thaw and ice effect on canal bank. Canadian Geotechnical Journal, 35(4): 655–665. DOI: 10.1139/cgj-35-4-655 |
| Zhong H, Wang XF, Zhang B, 2013. Research on hydraulic soil slope frost heaving damage model test. Applied Mechanics and Materials, 256–259: 422–426. DOI: 10.4028/www.scientific.net/AMM.256–259.422 |
| Zhou JZ, 2012. Study on moisture-heat-stress interaction in freeze-thaw process of soil. Beijing: Chinese Academy of Science, pp. 27–33. (in Chinese) |
| Zhou JZ, Li DQ, 2012. Numerical analysis of coupled water, heat and stress in saturated freezing soil. Cold Regions Science and Technology, 72: 43–49. DOI: 10.1016/j.coldregions.2011.11.006 |
| Zhou JZ, Wei CF, Li DQ, et al, 2014. A moving-pump model for water migration in unsaturated freezing soil. Cold Regions Science and Technology, 104–105: 14–22. DOI: 10.1016/j.coldregions.2014.04.006 |
 2017, 9


