Article Information
- ZuoYue He, JiDong Teng, Sheng Zhang, DaiChao Sheng . 2017.
- Moisture transfer and phase change in unsaturated soils: an experimental study of two types of canopy effect
- Sciences in Cold and Arid Regions, 9(3): 243-249
- http://dx.doi.org/10.3724/SP.J.1226.2017.00243
Article History
- Received: November 25, 2016
- Accepted: December 25, 2016
2. National Engineering Laboratory for High-Speed-Railway Construction, Central South University, Changsha, Hunan 410075, China;
3. ARC Centre of Excellence in Geotechnical Science and Engineering, the University of Newcastle, Australia
Significant frost-heave damage was reported to airfield runways at an airport in northwestern China, with runways broken down or even shattered at some places. It was found that a weak zone of subgrade soil formed along the centreline of the runway where the water content was observed to be close to full saturation (Li et al., 2014 ). The airport is located in cold and arid northwestern China. The typical annual precipitation in this region is as low as 328 mm, and the annual evaporation can be as high as 1,438 mm. Moisture accumulation due to rainwater infiltration was considered unlikely, as the pavement was pretty much intact and impervious during the previous rainy season (summer). The annual minimum and maximum temperatures are around −20 °C and 35 °C, respectively. The groundwater table remains more than 20 m beneath the surface, eliminating the possibility of capillary action influence on the water content of the surface soil. Canopy effect in plant biology refers to the phenomenon in which crowns of individual trees or of a forest act as a special layer of absorption for energy from sunlight and water from tree roots. Significant water is consequently stored in the tree leaves for photosynthesis. This biological terminology is borrowed in this paper to describe the phenomenon whereby moisture accumulates underneath an impervious cover (Zhang et al., 2016 ). According to the differences of boundary conditions and internal mechanisms, canopy effect can be divided into two types: the first type for a relatively high groundwater table where capillary action is the dominant mechanism of moisture transfer and the second type for a low groundwater table where vapour transfer is the dominant mechanism (Zhang et al., 2016 ).
For the first type of canopy effect, experimental study about evaporation, condensation, and coupled liquid water and vapour transfer in unsaturated soils is rich in the literature. Smith (1943) found that moisture would transfer from a high-temperature side to a low-temperature side, and liquid-water transfer dominated. However, moisture transfer in unsaturated soils was complex (Gurr et al., 1952 ). Jackson (1964) found that vapour diffusion would also dominate when the initial water content was low. Similar results were obtained by Miyazaki (1976), Dobchuk et al. (2004) , and Wang et al. (2005) as well.
Field observations found that the second type of canopy effect can occur in relatively dry, frozen soils where the groundwater table is deep and can lead to full saturation of the soil immediately underneath an impervious cover (Zhang et al., 2016 ). Heat and water flow in freezing soils has been experimentally studied by Guymon and Luthin (1974) and Taylor and Luthin (1978). However, none of these tests considered vapour flow, which has been demonstrated to be important to overall moisture transfer in soil (Eigenbrod and Kennepohl, 1996; Guthrie et al., 2006 ; Sakai et al., 2009 ). Tests of unsaturated soil seepage so far also mainly focus on soils with above-freezing temperatures (Sakai et al., 2009 ), and few of these tests are used for freezing soils where ice formation and frost heave may occur. Therefore, it can be concluded that there are few tests to validate this type of canopy effect.
In this paper, to validate experimentally these two types of canopy effect and to reveal their mechanisms, moisture-migration experiments were then carried out, using a newly developed laboratory apparatus for unsaturated frozen soils. The effects of freezing conditions, temperature, and initial water content on vapour transfer are also analysed.
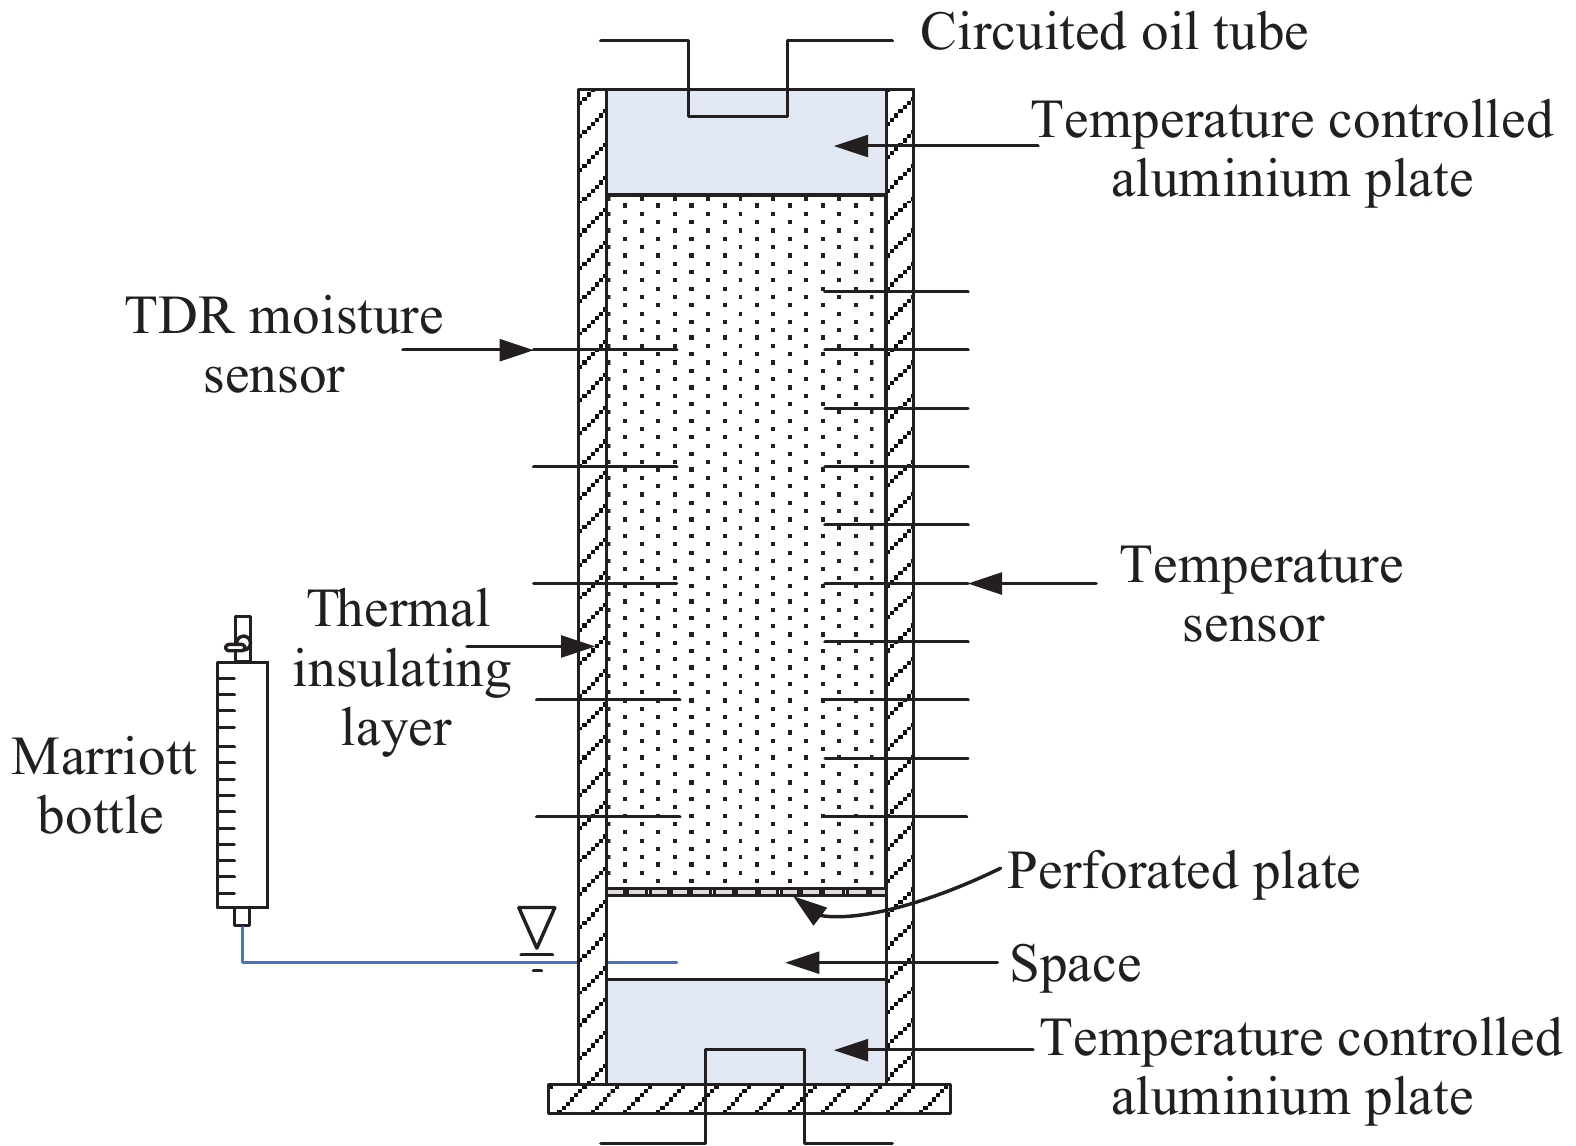
2 Test procedureTo reproduce experimentally the two types of canopy effect, a laboratory device (shown in Figure 1) was designed and patented at Central South University. The design of the device is primarily based on the concepts discussed above. A soil sample is placed in a transparent polypropylene cylinder 10 cm in diameter and 20 cm in height. Two aluminium plates are installed at the top and base of the cylinder. The temperatures of the aluminium plates are controlled by circuiting oil to independent thermostats. The range of temperature control is approximately −30~90 °C, with an accuracy of 0.1 °C. The top end of the sample is sealed against vapour and liquid flux with a plastic film. A 2-mm-thick, perforated plate separates the soil sample from the base aluminium plate, leaving a void approximately 3 cm in height. Distilled water is supplied to the void by a Mariotte bottle, forming a 1-cm-deep water reservoir above the top surface of the base aluminium plate. The void between the water reservoir and the soil sample ensures that only vapour is able to enter into the sample. To achieve unidirectional freezing of the sample, the cylinder is insulated with organic cotton along the cylinder walls to minimize lateral heat transfer.
|
| Figure 1 Schematic diagram of the test apparatus |
Moisture content and temperature along the sample height are monitored using time-domain reflectometer transducers and thermistors, respectively. The entire device, including the data-acquisition system and the graphical display system, is then placed in a temperature-controllable chamber, as shown in Figure 1. The bottom plate, the water reservoir, and the chamber are usually subjected to the same (super-freezing) temperature; and the top plate is subjected to a different (usually subfreezing) temperature. In a step-freezing mode, the top-plate temperature is fixed during the test, whereas in a ramped freezing mode, the top-plate temperature is continuously decreased.
A type of calcareous sand was used in this study, with particle sizes varying in the range of 0.5~2 mm. The basic physical parameters are shown in Table 1. A constant-head test of the sand was conducted, therein obtaining a hydraulic conductivity of 6.11×10⁻⁴ cm/s. The oven-dried sample was first mixed with a certain amount of water to produce samples of different initial water contents. The sample was then packed into a sealed plastic bag and left at room temperature for 24 h, until the moisture condition stabilized. Thereafter, the material was placed into the cylinder by lightly compacting layers approximately 2 cm in thickness. The final height of the sample was controlled at 13.5 cm, with a dry density of approximately 1.30 g/cm3. During the process of packing samples, three water-moisture probes and seven thermistors were inserted into the cylinder at certain depths. Temperatures and volumetric water content were continuously measured throughout the testing period and recorded with an automatic data logger. In addition, water content at different depths was checked before and after the completion of the test.
| e0 | Apparent density (g/cm3) | Bulk density (g/cm3) | D60 (mm) |
| 1.091 | 2.635 | 1.26 | 1.5 |
| D30 (mm) | D10 (mm) | Cu | Cc |
| 1.05 | 0.53 | 3.98 | 0.99 |
The boundary condition remarkably influences moisture transfer in unsaturated soils. To reproduce and investigate the two types of canopy effect, six conditions were applied, as shown in Table 2. Two initial gravity water contents were chosen, namely, 5% and 0%. The bottom and top temperature were fixed over the entire testing period, except for case 6. In the first three cases, the top temperatures were all greater than 0 °C, which represented the first type of canopy effect. In the second three cases, the top temperatures were all less than 0 °C, which represented the second type of canopy effect. In case 6, the top temperature was decreased in steps, approximating a ramped freezing mode. For each case, the test duration was 7 days. The boundary temperatures in Table 2 were the values set for the circulating fluids. They may differ from the actual temperatures at the case ends, due to the room-temperature effect (approximately 20 °C during the test) and a small radial heat flux.
| Case | Initial gravity water content (%) | Set temperature at the bottom boundary (°C) | Set temperature at the top boundary (°C) |
| 1 | 0 | 20.5 | 0.5 |
| 2 | 5 | 20.5 | 0.5 |
| 3 | 5 | 20.5 | 10.5 |
| 4 | 0 | 10.0 | −10.0 |
| 5 | 5 | 10.0 | −10.0 |
| 6 | 5 | 10.0 | −3.0 (2d), 6.0 (2d), 10.0 (3d) |
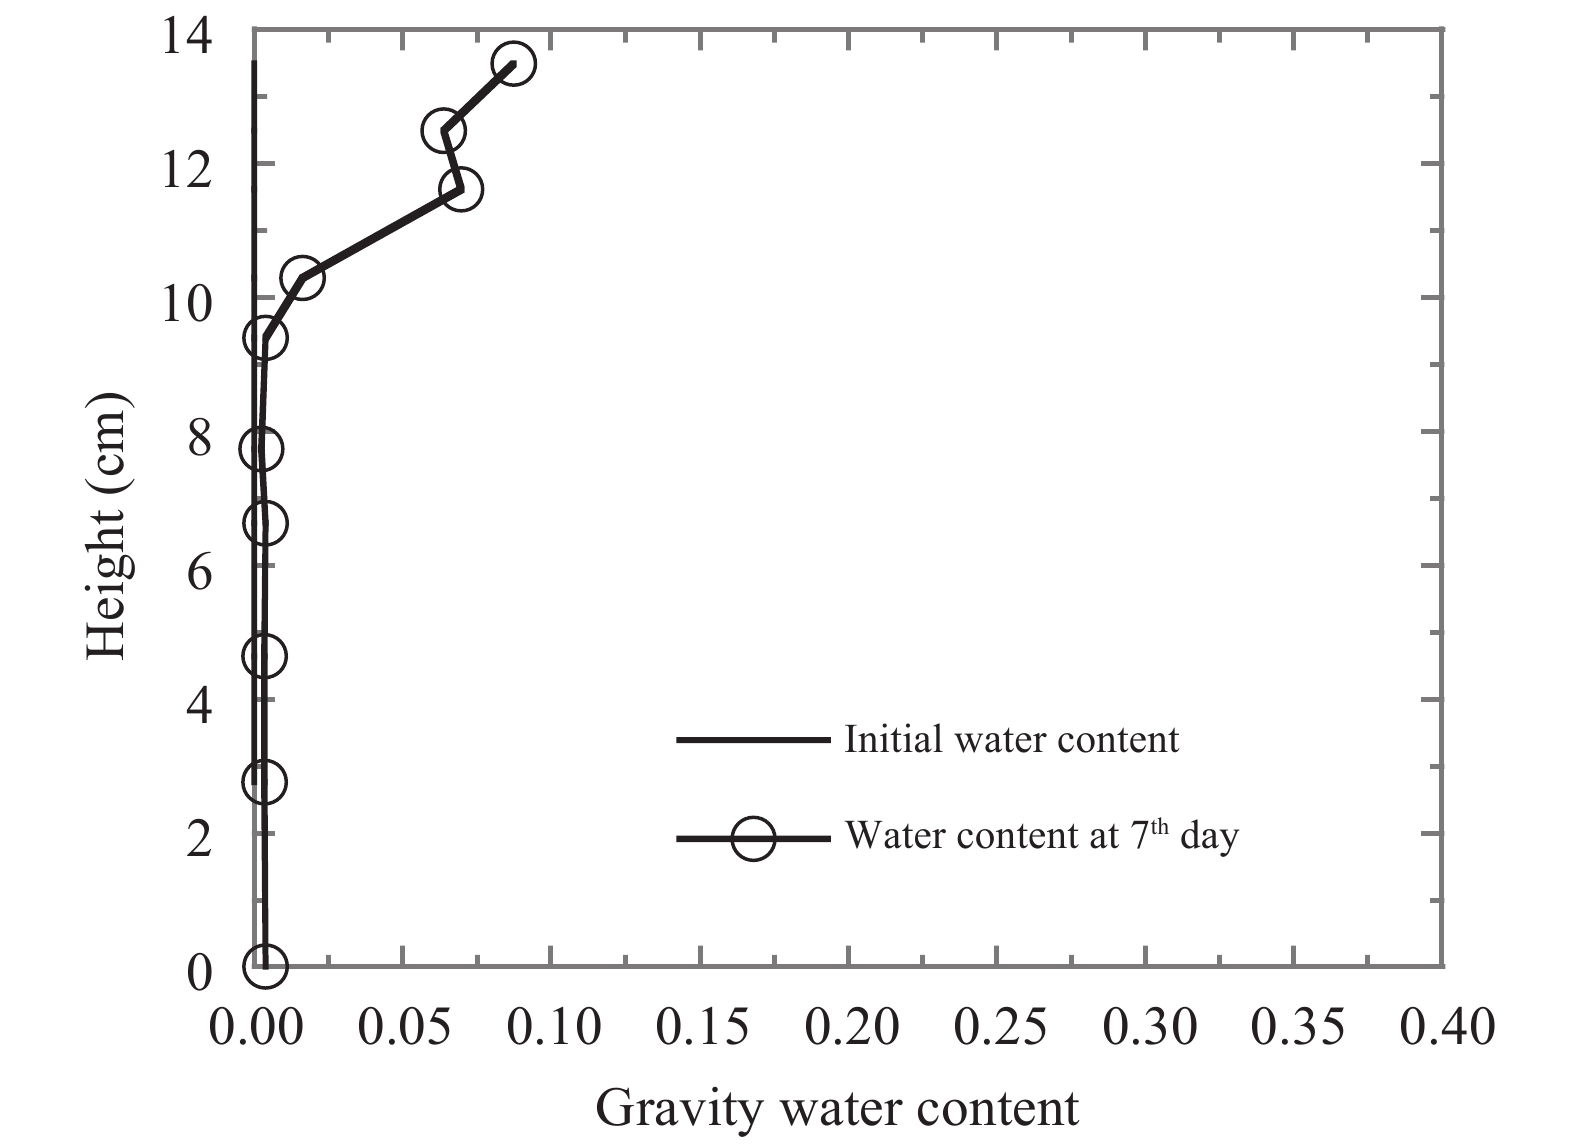
The initial water content of case 1 was 0%. The top and bottom boundary temperatures were constantly maintained at 0.5 °C and 20.5 °C, respectively, which means the temperature gradient was 1.48 °C/cm. The whole sample was unfrozen during the entire experiment period. The water-content profile of case 1 is shown in Figure 2. It can be seen that the increment of water content at the top was only around 7.5%. The original state of this case was dry, so the water-content increment must have been caused by transfer and condensation of water vapour.
|
| Figure 2 The water-content profile at day 7, case 1 |
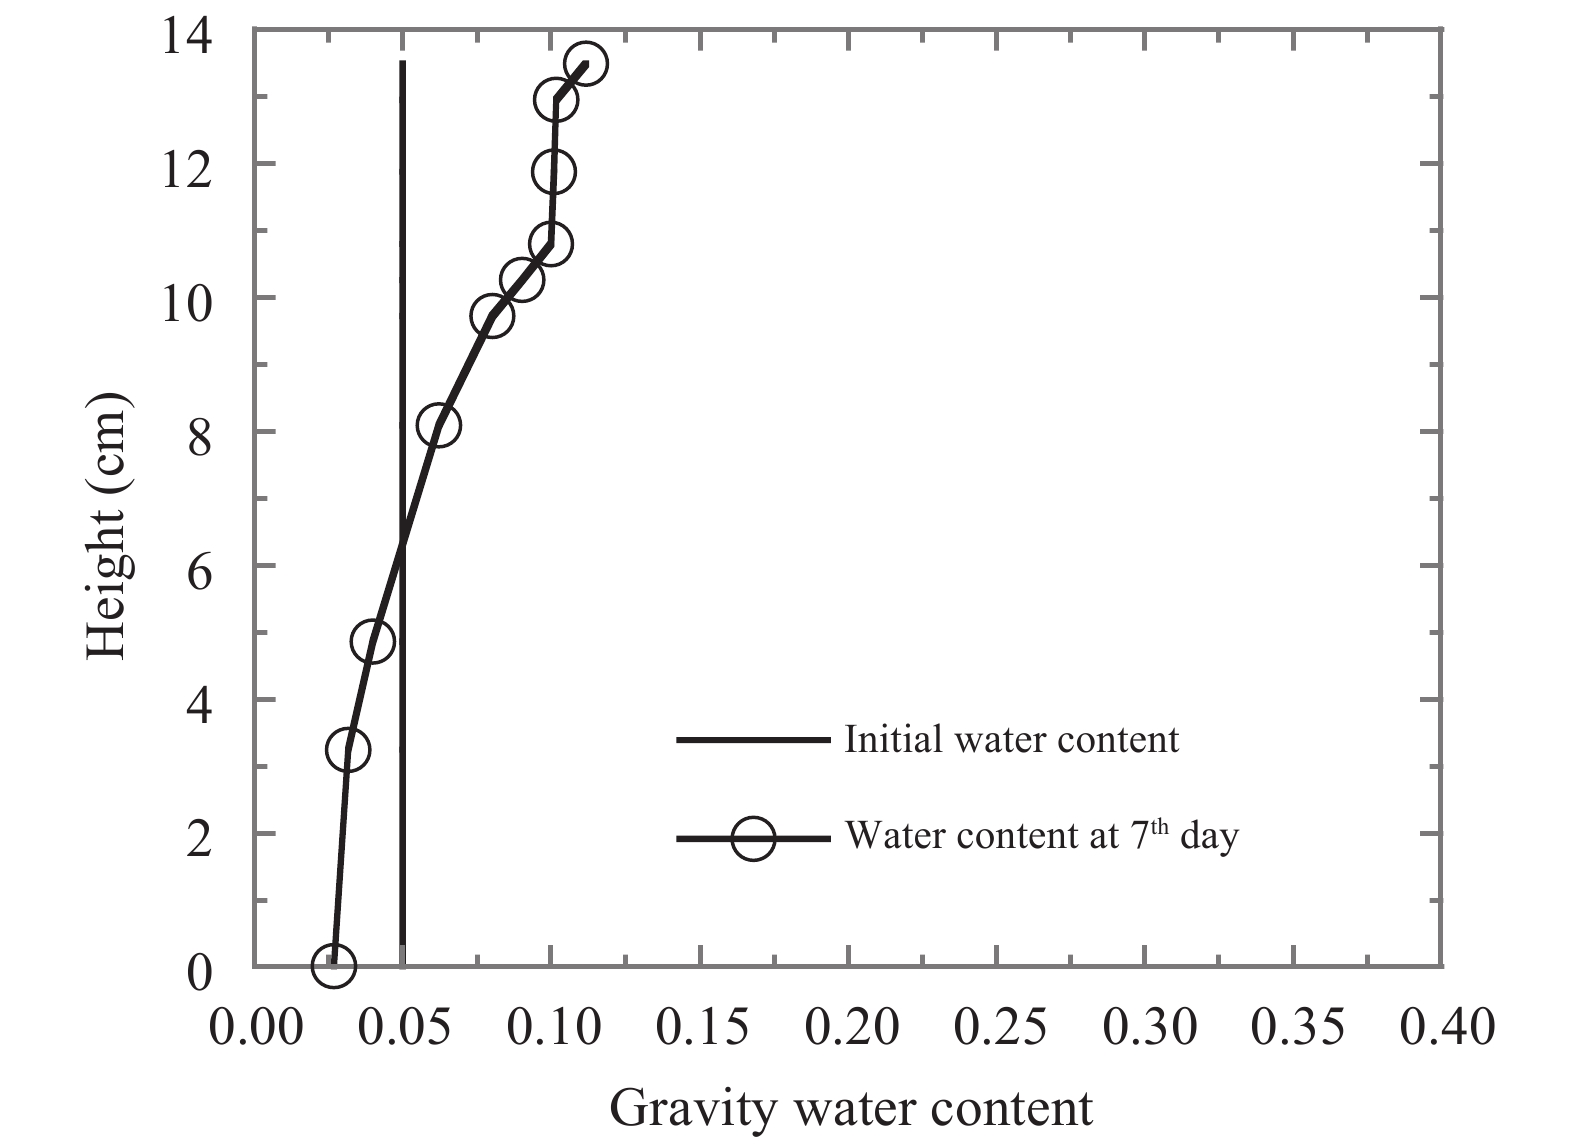
The water-content profile of case 2 is shown in Figure 3. The initial water content of this case was 5%, and the boundary temperature was the same as that of case 1. It can be seen that the initial water-content increase increased the water content at the top, but the increment was relatively small. However, the water content at the bottom was less than the initial water content. The reason is that free energy in the cold region was lower, and the liquid water could move from a region of higher free energy to a region of lower free energy.
|
| Figure 3 The water-content profile at day 7, case 2 |
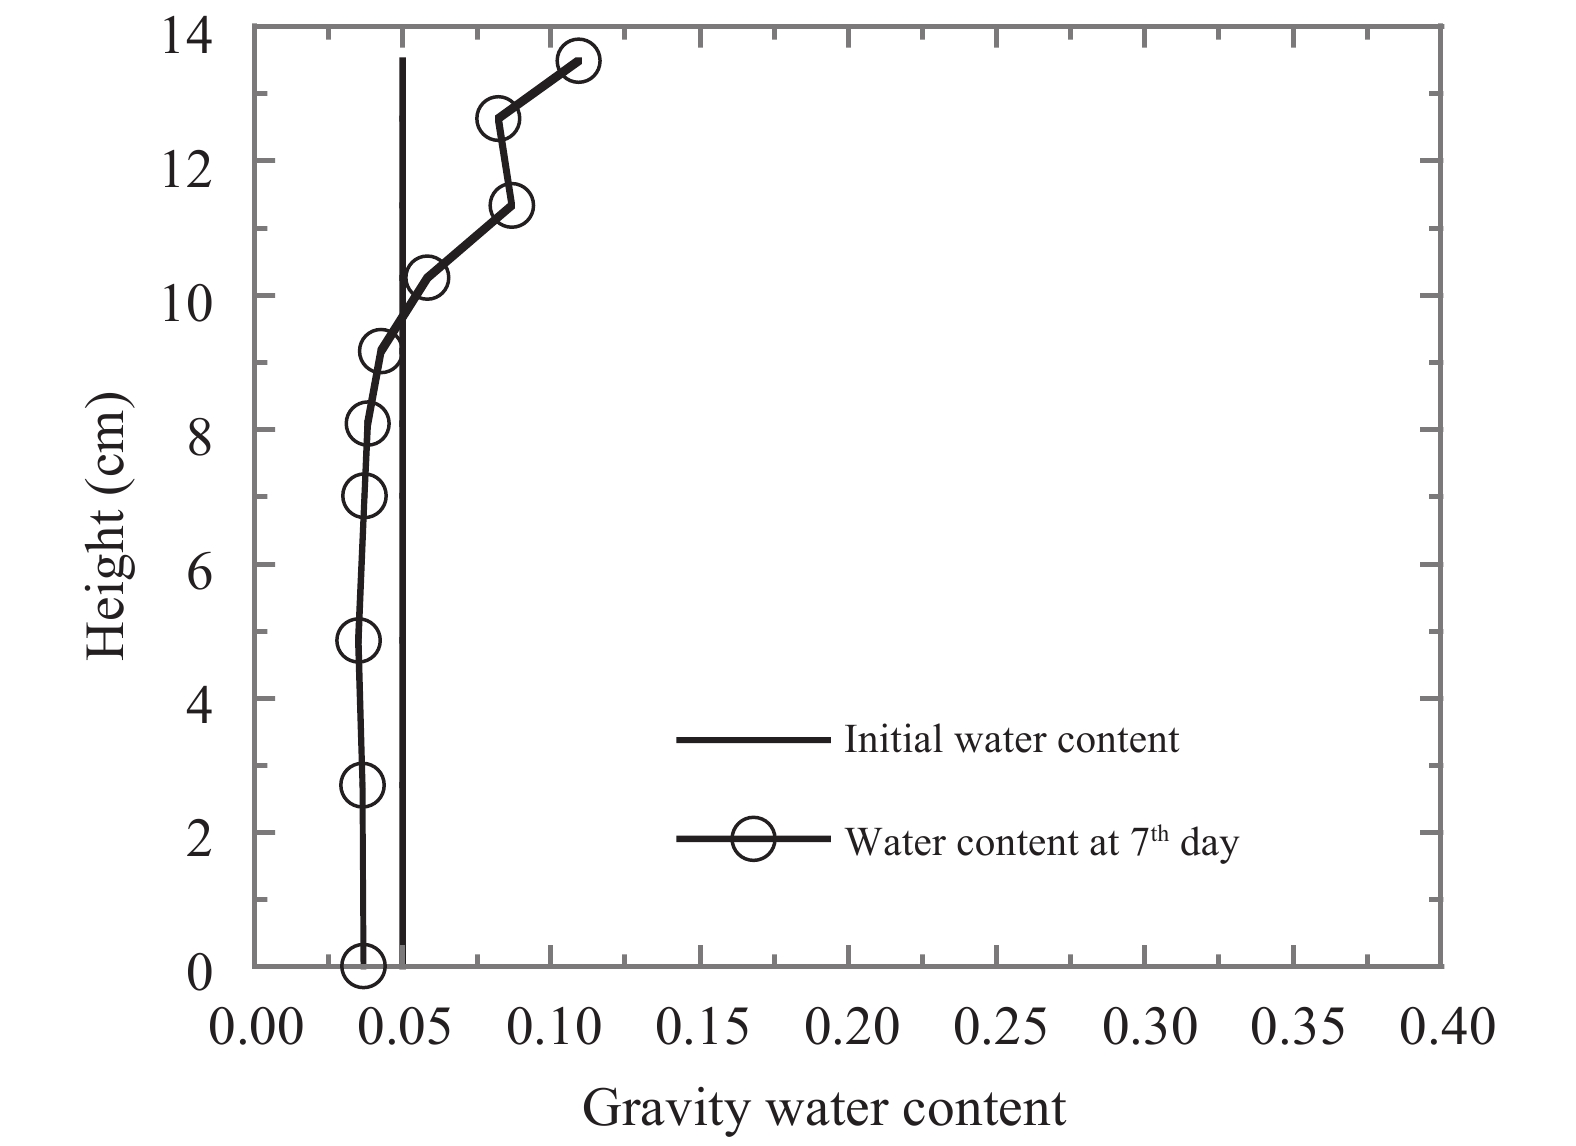
Figure 4 shows the water-content profile of case 3. The top boundary temperature was 10.5 °C, so the temperature gradient was 0.74 °C/cm, which is less steep than that of either case 1 or case 2. The initial water content was the same as that of case 2. It can be seen that water content at the top was similar to that of case 2, and the water content at the bottom was also less than the initial water content for the same reason as mentioned above. And what's more, the region where water content increased was smaller than that of case 2, which means that a less steep temperature gradient decreased the total water-content increment.
|
| Figure 4 The water-content profile at day 7, case 3 |
In addition, these three cases all showed that the maximum water content was about 7%~12% and located at the top. This means that when the top temperature was greater than the freezing point, the water-content increment at the top was very limited. Therefore, the top layer of the soil column may not reach the liquid limit or full saturation, which experimentally validated the first type of canopy effect.
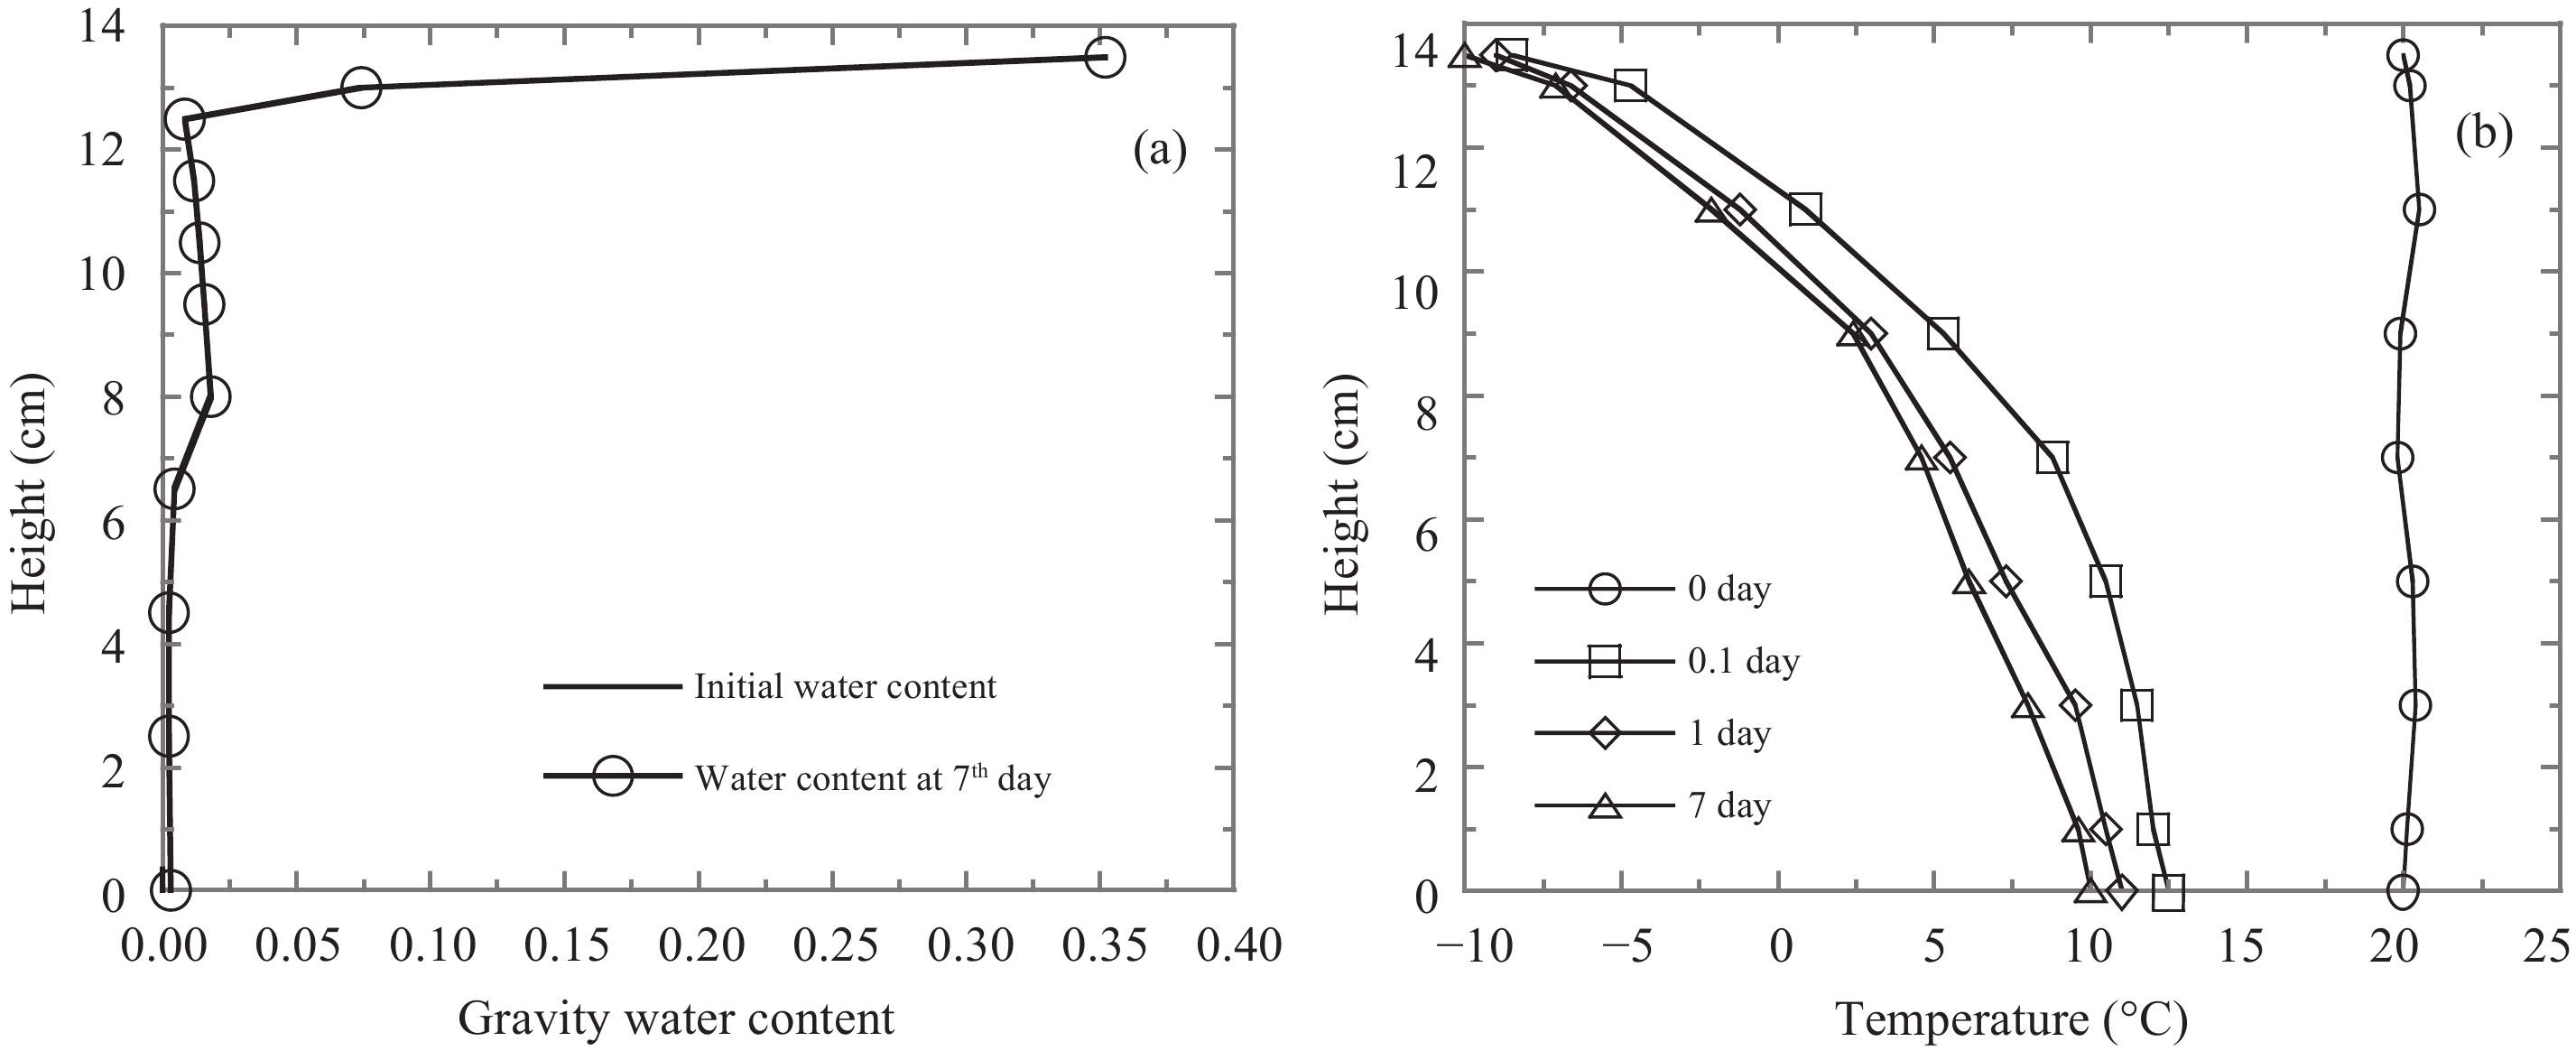
3.2 The second type of canopy effectThe initial water content of case 4 was 0%, and the top and bottom boundary temperatures were −10 °Cand 10 °C, respectively. The water-content profile and the temperature profile of this case are shown in Figure 5. It can be seen that water content increased in the whole case after 7 days' freezing; and the water content at the top increased dramatically to 35%, which is much larger than that of case 1. This is because the top temperature was maintained at −10 °C, and vapour constantly transferred from the warm region and then froze and gathered in the cold region. However, for case 1, vapour condensation balanced the humidity gradient and then restrained vapour transfer in the frozen, unsaturated soil. The experiment's results also show that the top temperature had a remarkable effect on the water-content profile. If the top boundary temperature was lower than the freezing point, this effect would be more notable. Figure 5b shows that the water content at the zone whose height is between 8 cm and 11 cm was around 2%, and the profile shape barely changes. In referring to the temperature profile, it can be seen that the temperature was already steady after the first day. After 7 days, the height of freezing front (0 °C) was around 10 cm, which corresponded to the peak of water-content profile. This is because desublimation of vapour continuously takes place at the freezing front, and little vapour can pass through the freezing front. Figure 5 demonstrates that vapour transfer can dramatically increase water content even though the original sample is dry, which validates the second type of canopy effect.
|
| Figure 5 The water-content (a) and temperature (b) profiles at day 7, case 4 |
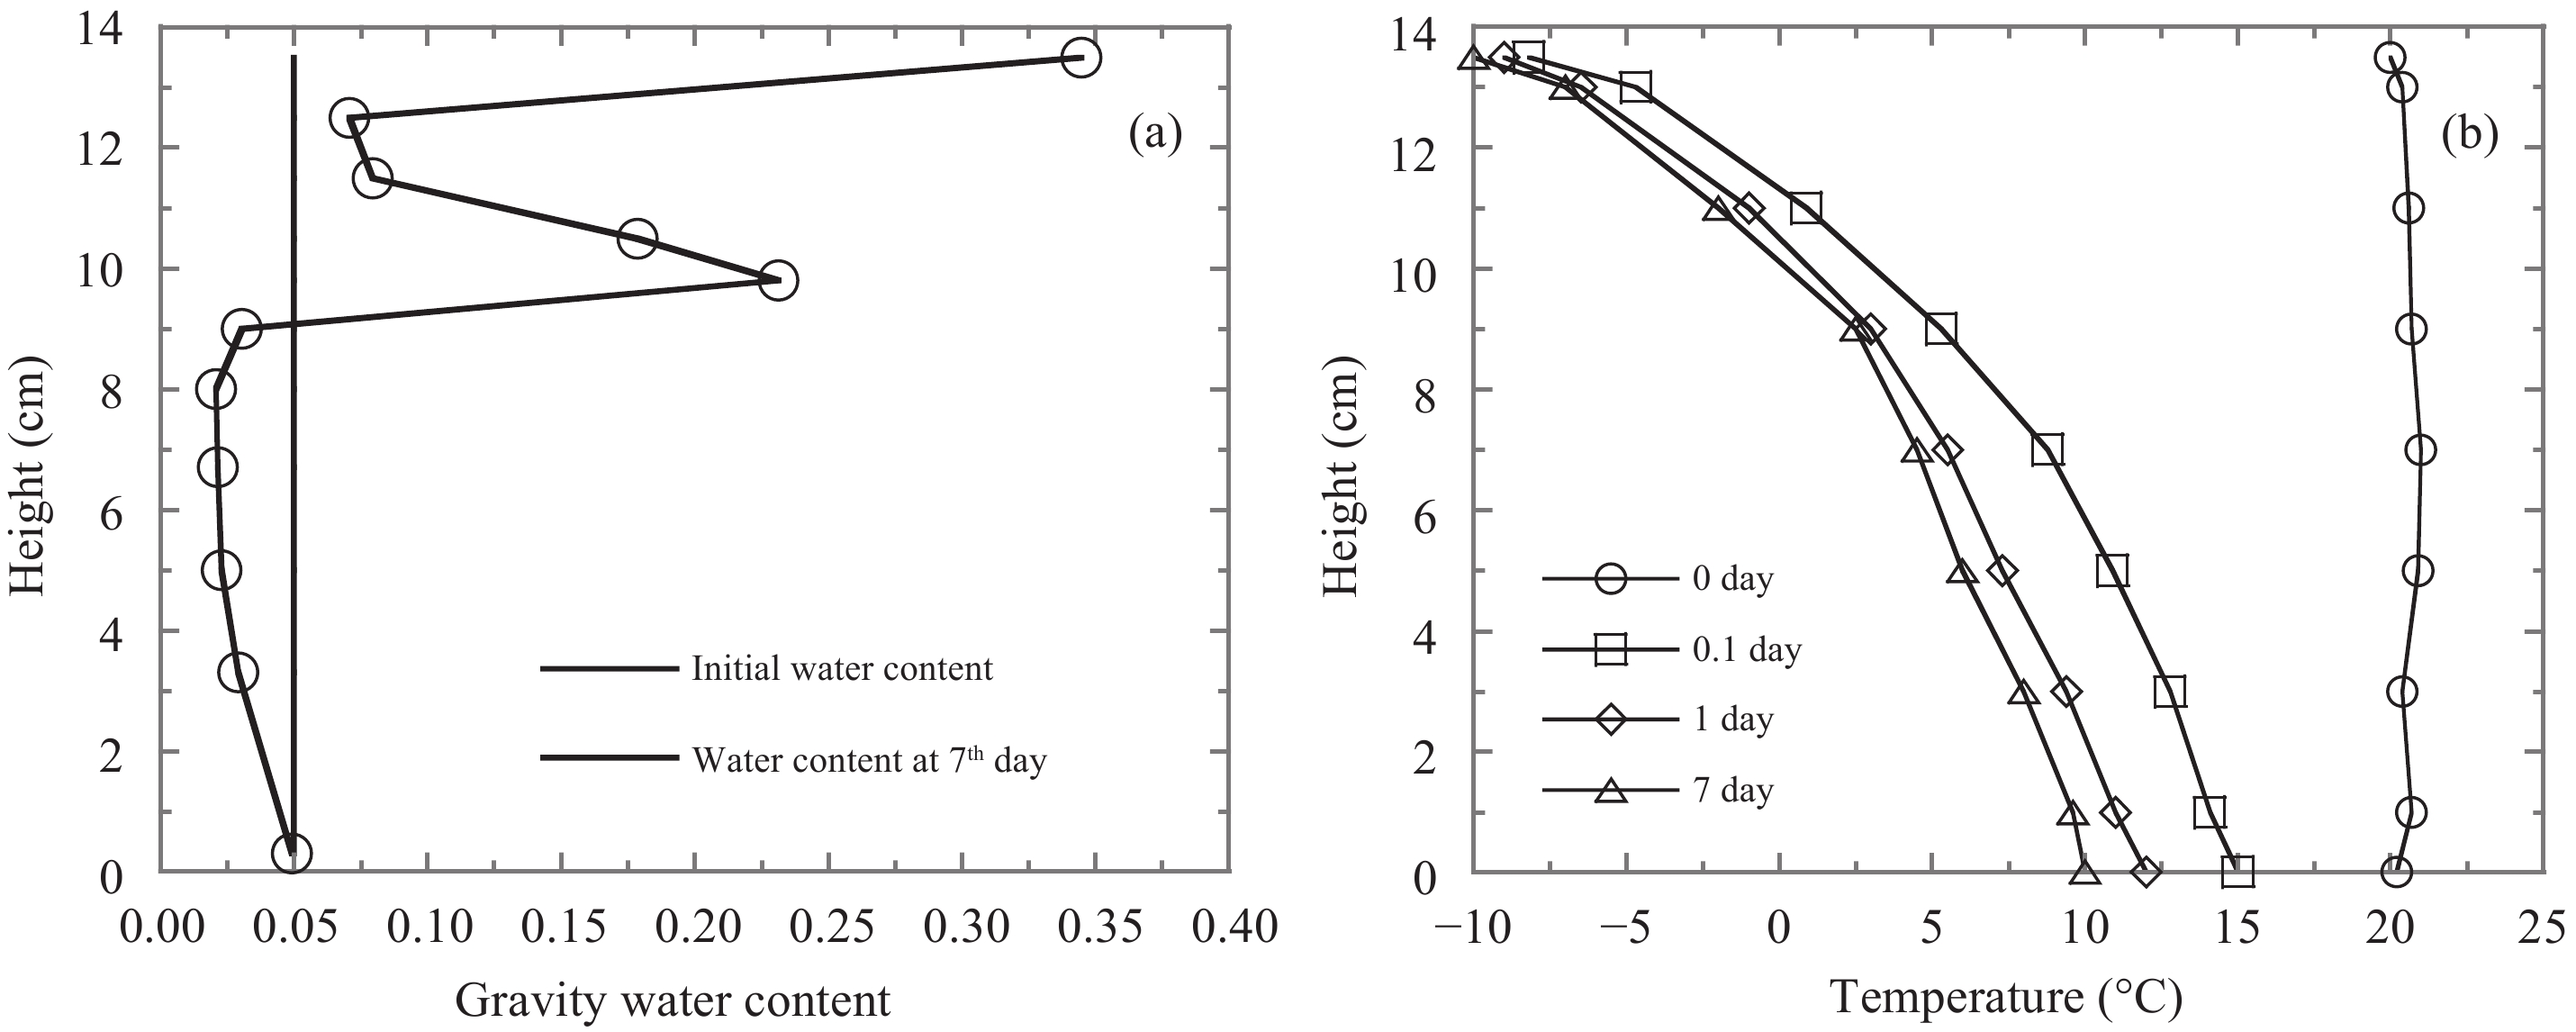
The initial water content of case 5 was 5%, and the temperature boundary conditions were the same as those of case 4. The water-content profile and the temperature profile of this case are shown in Figure 6. It can be seen that after 7 days, the water content at the top was around 34.8%, which was much greater than the initial water content. There was a peak in the water-content profile, whose value was approximately 22.5%, which was also greater than the initial water content. However, the water content in the lower portion of this case was less than the initial water content, which corresponded to a temperature greater than the freezing point. With freezing, vapour and liquid water continuously transferred upward to the freezing front, which caused the decrease of water content in the lower position. Moreover, the position of the water-content peak was also in line with the freezing front at day 7. It can be concluded from Figures 5 and 6 that a higher initial water content can lead to a substantial increase of water content at the freezing front. However, the water content in the upper portion seldom changes.
|
| Figure 6 The water-content (a) and temperature profiles (b) at day 7, case 5 |
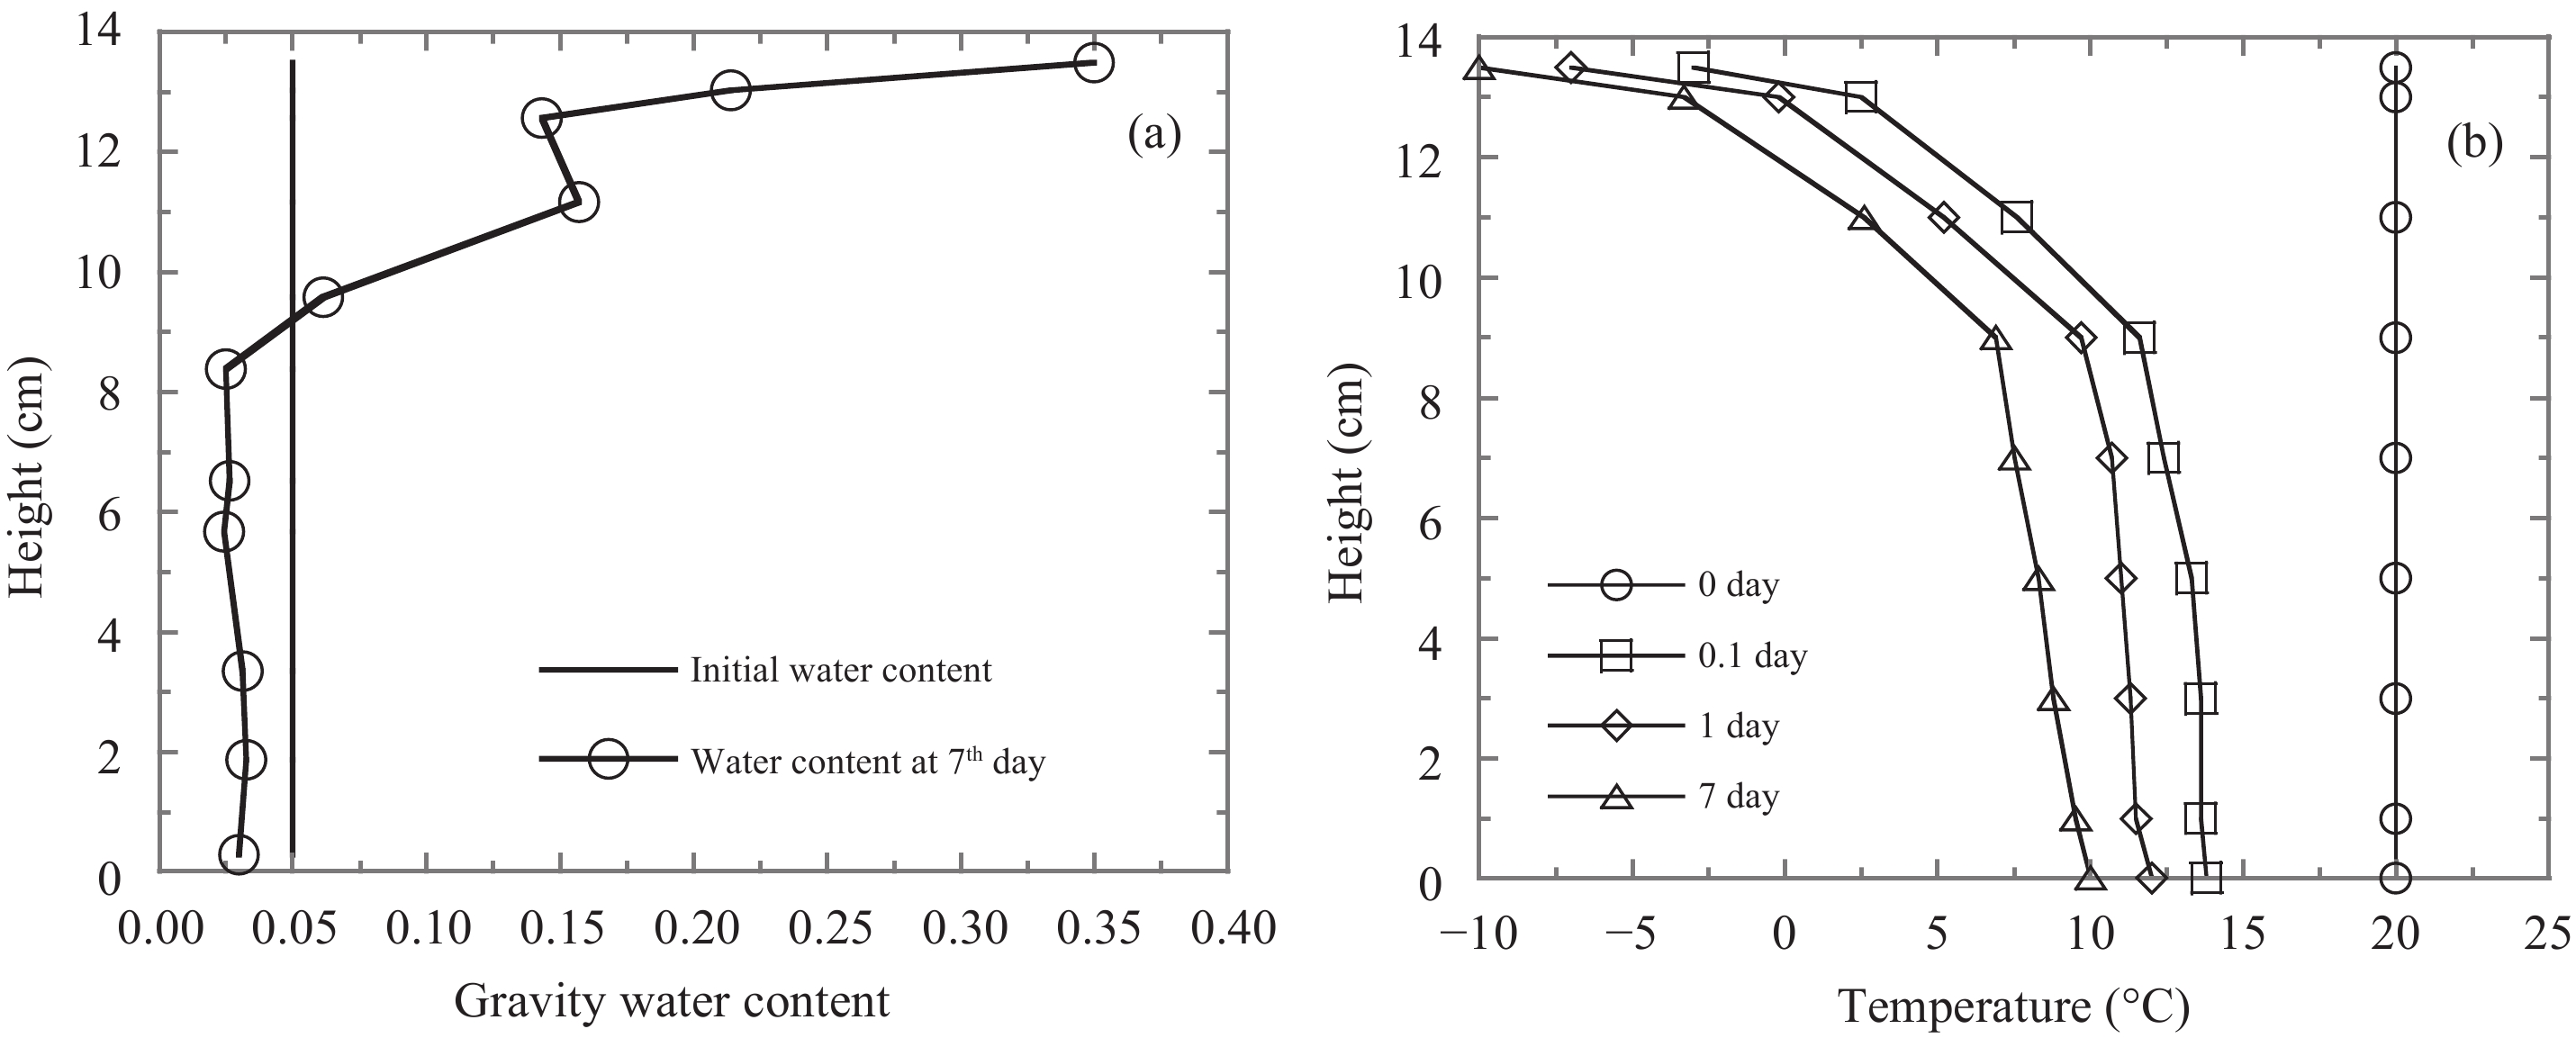
The top temperature was set at −3 °C (2 days), −6 °C(2 days), and −10 °C (2 days), respectively; and the bottom temperature was maintained at 10 °C. This temperature setting belongs to the second freezing mode, which means a specific cooling rate was applied to freeze the sample (Sheng et al., 2013 ). The initial water content of this case was the same as that of case 5. The water-content profile and the temperature profile of this case are shown in Figure 7. It can be seen that that water content in the upper portion was around 35%, which was roughly the same as those of cases 4 and 5. The water content at the freezing front was around 15%, which was greater than the initial water content, although this increment is relatively small as compared with case 5.
|
| Figure 7 The water-content (a) and temperature profiles (b) at day 7, case 6 |
Figure 8 shows the water accumulation that was captured at the top and the freezing front after the experiment. It can be seen that a thin ice layer occurred at the top, and ice particles also conglutinated sand particles at the freezing front. It is noticeable that such phenomenon takes place in cases 4, 5, and 6. It indicates that vapour can continuously transfer and accumulate in the cold region, which leads to the second type of canopy effect.

|
| Figure 8 After freezing: (a) the top of the case, (b) the freezing front (after Zhang et al., 2016 ) |
The comparisons of water content at the top, water content at the freezing front, and average water content in the end are shown in Figure 3. It can be seen that for the first type of canopy effect, the largest water content at the top is 11.8%, much less than that of the second type of canopy effect (35%), which means that the top does not reach full saturation. The freezing front does also not exist in the first type of canopy effect because the soil sample is not frozen. However, water content at the freezing front is greater than the initial water content in the case of the second type of canopy effect. In a word, the water-content increment at the top with freezing is much larger than that without freezing, which means that the first type of canopy effect would have a more serious damage to engineering. Therefore, in terms of practical engineering, the effect of vapour transfer in frozen, unsaturated soils should be paid far more attentions to. Prevention and control measures for the second type of canopy effect also need further research.
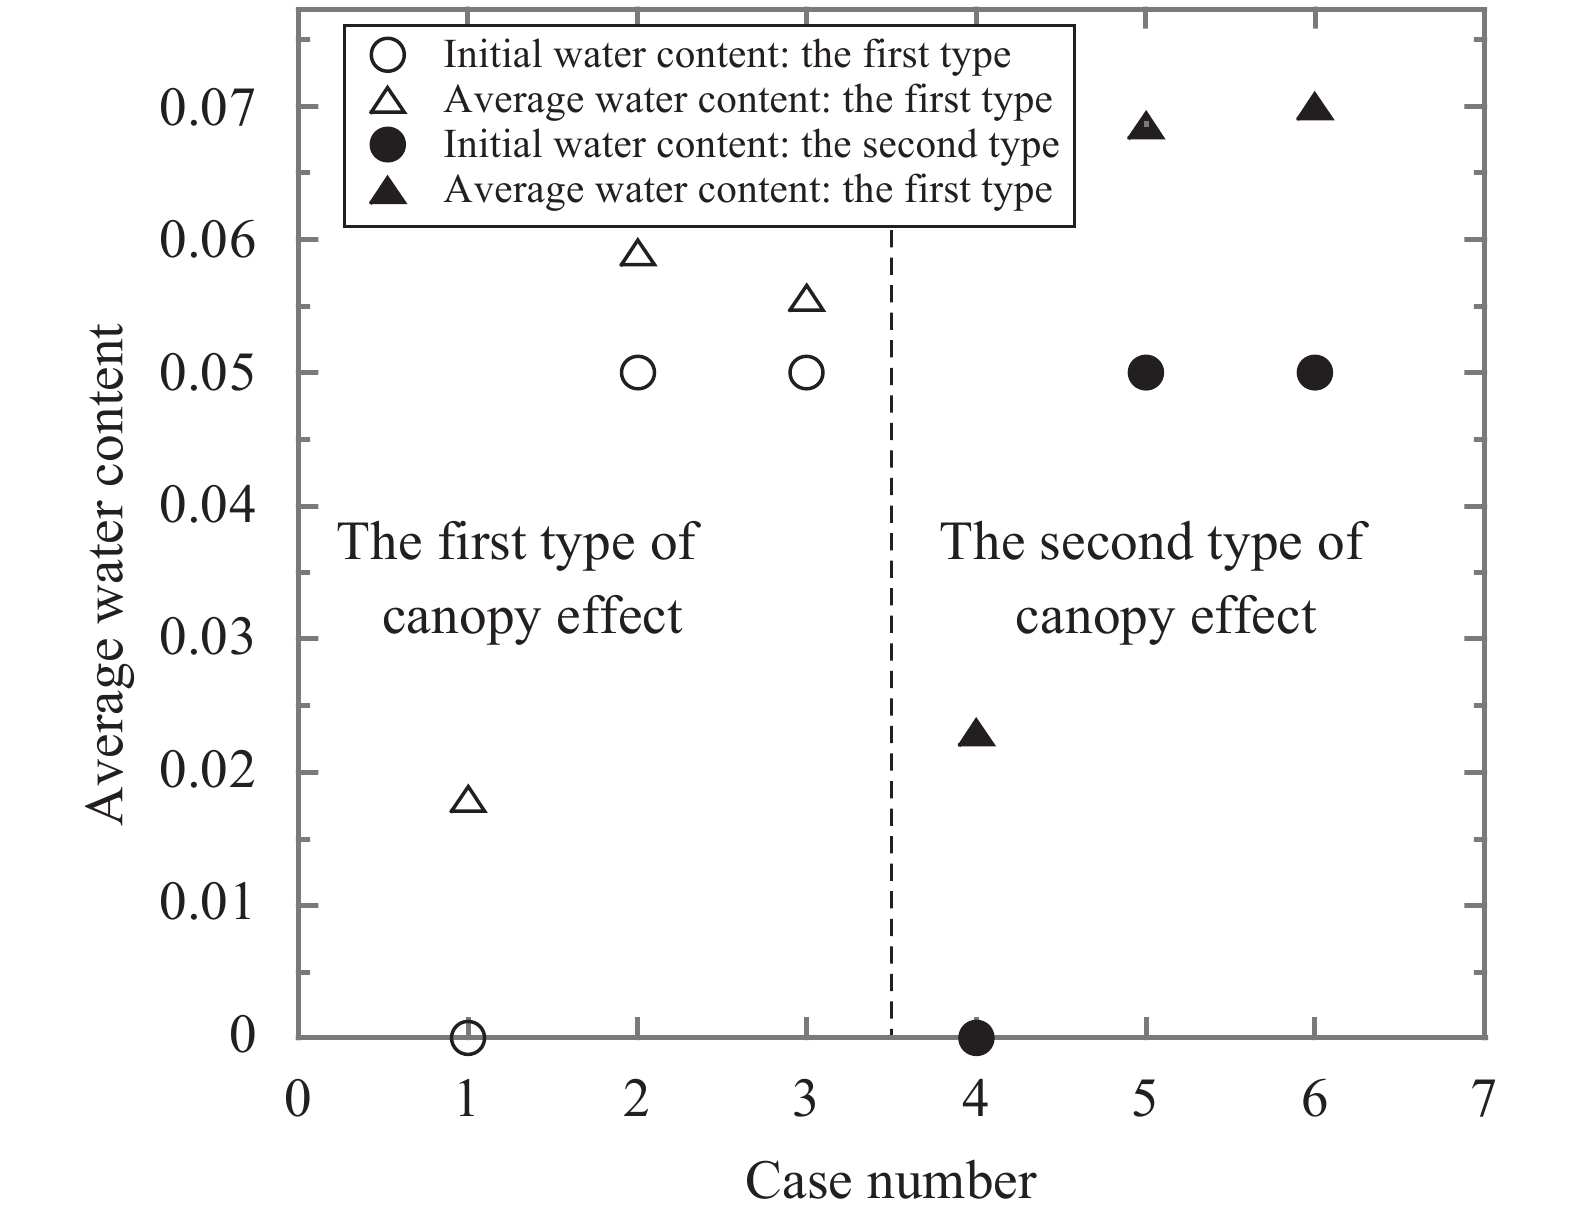
The comparison between the average water content and the initial water content of the two types of canopy effect is shown in Figure 9. It can be seen that the average water content increases in both types of canopy effect. However, the increment of the average water content is much larger in the second type of canopy effect. The average water content increment decreases with the initial water content, increasing in both types. For the first type of canopy effect, the average water content increment also decreases with the temperature gradient lessening. This finding is obvious because the effect of temperature gradient on vapour transfer is remarkable. For the second type of canopy effect, the average water-content increment also increases with decreases in the cooling rate, which also corresponds with classical frost-heave theories.
|
| Figure 9 The comparison between the average water content by the end of the test and the initial water content |
| Type | Test condition | Number | Initial water content, % | Water content at the top, % | Water content at the freezing front, % | Average water content at the top, % | Remarks |
| The first type of canopy effect | Unfrozen | 1 | 0 | 7.5 | – | 1.80 | 1. The increment of the average water content at the top is lower than that of the second type of canopy effect. |
| 2 | 5 | 11.8 | – | 5.90 | 2. The average water content increases with increases in the initial water content, but the increment decreases. | ||
| 3 | 5 | 11.8 | – | 5.56 | 3. Temperature gradient has few effects on the water content at the top. | ||
| The second type of canopy effect | Freezing | 4 | 0 | 35.0 | 2.0 | 2.30 | 1. The effects of initial water content and cooling rate on the water content at the top are not obvious. |
| 5 | 5 | 34.8 | 22.5 | 6.86 | 2. The water content at the freezing front increases remarkably with increase in the initial water content. | ||
| 6 | 5 | 35.0 | 15.0 | 7.00 | 3. The water content at the freezing front decreases with decreases in the cooling rate. | ||
To validate experimentally the two types of canopy effect and to reveal their mechanisms, moisture-migration experiments were carried out, using a newly developed laboratory apparatus, for an unsaturated unfrozen and frozen type of calcareous sand. It can be concluded that vapour transfer can increase the water content at the top, but this increment is limited without freezing. However, this increment will be remarkable with freezing. For the first type of canopy effect, the initial water-content increase will increase the water content at the top; but this increment is limited. The effect of the temperature gradient on the water content at the top is also negligible. For the second type of canopy effect, a peak of the water-content profile occurs at the freezing front. The initial water-content increase will remarkably increase the water content at the freezing front. The temperature-gradient decrease will decrease the water content at the freezing front. However, the initial water content and temperature gradient hardly influence the water content at the top. By the end of the experiment, the average water content will increase in both types of canopy effect; but the increment of the second type is greater. However, the initial water-content increase will decrease the average water-content increment of both types. Moreover, for the first type of canopy effect, the temperature-gradient decrease will decrease the average water-content increment, with this increment being greater for the second type of canopy effect.
Acknowledgments:This research was supported by National Basic Research Program of China (No. 2014CB047001) and National Natural Science Foundation of China (No. 51508578).
| De Vries DA, 1958. Simultaneous transfer of heat and moisture in porous media. Transactions American Geophysical Union, 39(5): 909–916. DOI: 10.1029/TR039i005p00909 |
| Dobchuk BS, Barbour SL, Zhou J, 2004. Prediction of water vapor movement through waste rock. Journal of Geotechnical and Ge-oenvironmental Engineering, 130(3): 293–302. DOI: 10.1061/(ASCE)1090-0241(2004)130:3(293) |
| Eigenbrod K, Kennepohl G, 1996. Moisture accumulation and pore water pressures at base of pavements. Transportation Research Record, 1546: 151–161. DOI: 10.3141/1546-17 |
| Gurr CG, Marshall TJ, Hutton JT, 1952. Movement of water in soil due to a temperature gradient. Soil Science, 74(5): 335–346. DOI: 10.1097/00010694-195211000-00001 |
| Guthrie W, Hermansson A, Woffinden K, 2006. Saturation of granular base material due to water vapor flow during freezing: Laboratory experimentation and numerical modeling. Cold Regions Engineering, 29(11): 1–12. DOI: 10.1061/40836(210)66 |
| Guymon GL, Luthin JN, 1974. A coupled heat and moisture transport model for Arctic soils. Water Resources Research, 10(5): 995–1001. DOI: 10.1029/WR010i005p00995 |
| Jackson RD, 1964. Water vapor diffusion in relatively dry soil: I. Theoretical considerations and sorption experiments. Soil Science Society of America Journal, 28(2): 172–176. DOI: 10.2136/sssaj1964.03615995002800020014x |
| Li Q, Yao YP, Han LM, et al, 2014. Pot-cover effect of soil. Industrial Construction, 44(2): 69–71. |
| Miyazaki T, 1976. Condensation and movement of water vapour in sand under temperature gradient. Transactions of the Japanese Society of Irrigation, Drainage and Reclamation Engineering. |
| Sakai M, Toride N, Šimůnek J, 2009. Water and vapor movement with condensation and evaporation in a sandy column. Soil Science Society of America Journal, 73(3): 707–717. DOI: 10.2136/sssaj2008.0094 |
| Sheng DC, Zhang S, Yu ZW, et al, 2013. Assessing frost susceptibility of soils using PC Heave. Cold Regions Science & Technology, 95(11): 27–38. |
| Smith WO, 1943. Thermal transfer of moisture in soils. Eos Transactions American Geophysical Union, 24(2): 511–524. DOI: 10.1029/TR024i002p00511 |
| Taylor GS, Luthin JN, 1978. A model for coupled heat and moisture transfer during soil freezing. Canadian Geotechnical Journal, 15(4): 548–555. DOI: 10.1139/t78-058 |
| Wang TH, He ZQ, Zhao SD, et al, 2005. Experimental study on vaporous water transference in loess and sandy soil. Chinese Journal of Rock Mechanics and Engineering, 24(18): 3271–3275. |
| Zhang S, Teng JD, He ZY, et al, 2016. Canopy effect caused by vapour transfer in covered freezing soils. Géotechnique, 66(11): 927–940. DOI: 10.1680/jgeot.16.P.016 |
 2017, 9


