Article Information
- Bin Luo, Hao Lai, Tatsuya Ishikawa, Tetsuya Tokoro . 2017.
- Frost heave analysis of ballasted track above box culvert and its influence on train vibration
- Sciences in Cold and Arid Regions, 9(3): 229-235
- http://dx.doi.org/10.3724/SP.J.1226.2017.00229
Article History
- Received: November 22, 2016
- Accepted: December 22, 2016
2. Faculty of Engineering, Hokkaido University, Sapporo 060-8628, Japan;
3. National Institute of Technology, Tomakomai College, Tomakomai 059-1275, Japan
In seasonally frozen regions, transportation infrastructure such as railways is exposed to climatic change, which may lead to frost heave of the roadbed and highly influence driving safety and comfort. It is reported that 76% of roadbed is subjected to frost heave in the Haerbin-Dalian High-Speed Railway, and more than half the roadbed length experience frost heave larger than 5 mm (Yu, 2013). For roadbed located above a culvert, the unique thermal condition may cause uneven frost heave of subgrade soil, which has been observed for decades. Field monitoring was conducted to investigate the temperature distribution around a culvert passing through a roadbed (Niu et al., 2014 ). A simulation study on the thermal regime in a roadbed-culvert transition section was performed, and the influence of culvert shape on temperature field is also discussed (Liu et al., 2014 ). The effect of different insulation materials, laying position and thickness on frost depth underneath a culvert was verified (Zhang et al., 2015 ). The ground temperature and roadbed deformation of a bridge approach were measured during two freeze-thaw cycles, the proportion of frost heave in the graded gravel layer is about 40%, and the slope of this differential deformation along the railway is less than limit 0.001 rad (Zhang et al., 2016 ). As mentioned above, many types of research focused on temperature distribution and insulation technique for the culvert. However, little attention has been paid to water migration in these freezing processes, let alone the quantitative prediction of frost heave. Uneven frost heave of subgrade soil appears above the culvert induced by the particular thermal regime, which often causes rail track irregularity. The presence of this irregularity enhances dynamic interaction between rail structure and train, causing severe train vibration. In this paper, a coupled thermal-hydro-mechanical (THM) analysis (Ishikawa et al., 2014 ) was carried out to model the deformation characteristic of the railway, which is subjected to frost heave and located above a box culvert. The mechanism of this unique uneven frost heave was investigated. Then the influence of this uneven frost heave on train vibration was studied.
2 Governing equationsContinuity of soil pore-water is given as:
| $\begin{split}\frac{\partial }{{\partial {x_i}}} & \left[ { - {k_{ij}}\frac{\partial }{{\partial {x_j}}}\left( {\frac{u}{{{\rho _w}g}} + z} \right)} \right] \\[2pt]=& \left( {\frac{{n{S\!\!_e}}}{{{K_{\rm{w}}}}} - n\frac{{\partial {S\!\!_e}}}{{\partial u}}} \right)\frac{{\partial u}}{{\partial t}} + n{S\!\!_e}{\alpha _{\rm{T}}}\frac{{\partial T}}{{\partial t}} - {S\!\!_e}\frac{{\partial {\varepsilon _v}}}{{\partial t}}\end{split}$ | (1) |
where xi are Cartesian coordinates; kij is hydraulic conductivity of soil; u is pore-water pressure; ρw is mass density of water; g is gravitational acceleration; z is elevation head; n is porosity; Se is the effective degree of saturation; Kw is bulk modulus of pore-water; t is time; αT is the thermal expansion coefficient of water; T is temperature; and εv is volumetric strain.
Energy conservation is expressed as:
| $C\rho \frac{{\partial T}}{{\partial t}} = - \frac{\partial }{{\partial {x_i}}}\left({{\lambda _T}\frac{{\partial T}}{{\partial {x_j}}}} \right) + {C_w}{\rho _w}\frac{{\partial {\kern 1pt} \left({{v_i}T} \right)}}{{\partial {x_i}}}$ | (2) |
where C is specific heat of wet soil at a constant volume; ρ is mass density of wet soil; λT is thermal conductivity of wet soil; Cw is specific heat of pore-water at a constant volume; and vi is average velocity of pore-water in coordinate direction.
Accompanying temperature drop is released latent heat, and phase change occurs.
| $T = \Delta q\left({1 - b} \right)t/C\rho $ | (3) |
| $b = \frac{{n{S\!\!_e}{Q_{ls}}}}{{{T_f}C\rho + n{S\!\!_e}{Q_{ls}}}}$ | (4) |
where Δq is the influx of heat added to an infinitesimal soil element per unit time; b is the ratio of latent heat to total outflow heat; Qls is latent heat per unit volume of saturated soil; and Tf is final freezing temperature of the soil.
The hydraulic conductivity of freezing soil is shown as:
| ${k_{ij}} = {k_{ij0}}\left({1 - \Delta qbt/{Q_l}} \right)$ | (5) |
where kij0 is hydraulic conductivity of unfrozen soil.
According to Bishop's effective stress theory, and considering the other two strain components caused by thermal expansion and frost expansion, volumetric strain can be obtained as:
| $\frac{{\partial {\varepsilon _v}}}{{\partial t}} = \frac{1}{{{K_d}}}\frac{{\partial {\sigma _m}}}{{\partial t}} - \frac{{{S_e}}}{{{K_d}}}\frac{{\partial u}}{{\partial t}} + {\beta _T}\frac{{\partial T}}{{\partial t}} + \frac{{\partial {\varepsilon _f}}}{{\partial t}}$ | (6) |
where σm is mean total stress; Kd is bulk modulus of drained soil; βT is thermal expansion coefficient of soil; and εf is the strain of frost expansion.
Based on the results of the frost heave test, the strain of frost heave (εf) and strain of thaw contraction (εt) can be given as:
| ${\varepsilon _f} = \kappa \left({\frac{{{\varepsilon _{f {\rm max}}}{S\!\!_{e0}}}}{{\varsigma {{\sigma '}_n} + 1}}\Delta qbt/{Q_l} + 1.09{m_w}} \right)$ | (7) |
| ${\varepsilon _t} = \omega {\varepsilon _f} \times \Delta q'bt/{Q_l} = \left({c + d\ln {\sigma _n}} \right){\varepsilon _f} \times \Delta q'bt/{Q_l}$ | (8) |
where εfmax is maximum frost expansion strain of saturated soil without overburden pressure; Se0 is initial effective degree of saturation; σ'n is effective stress at the direction of heat flow; Ql is heat per unit volume of soil consumed for solidification of water; mw is the ratio of water absorbed into an infinitesimal soil; κ and ς are constants; ω is the coefficient of thaw contraction; σn is total stress at the direction of heat flow; Δq' is quantity of inflow heat in unit time; c and d are constants.
3 Numerical modelFigure 1 shows the transverse section of a simulated culvert as well as the boundary condition and Finite Element (FE) mesh. The mesh consists of quadrilateral elements with linear elastic stress-strain behavior and non-linear unsaturated water retention relationship. A typical track structure in Hokkaido was modeled which consists of ballast, roadbed (graded gravel), and subgrade (anti-frost fill and frost-susceptible fill). As the unit weight of rail and sleeper is much smaller than dead weight of soil above the frost-susceptible fill, the rail and sleeper are not modeled. However, the existence of stiff rail may adjust differential deformation to some extent. All these simplifications may slightly overestimate the uneven frost heave accordingly. As one-dimension frost expansion occurs in the thermal gradient direction, deformation on the interface between the culvert and surrounding fill is considered to be continuous, neglecting the relative motion in the tangential direction. The ballast, graded gravel, and anti-frost fill are considered not to cause any frost heave, and we only consider the frost heave of frost-susceptible fill. As this paper is a preliminary study, the influence of temperature on thermal conductivity and heat capacity is neglected for simplification. This assumption may underestimate the frost penetration depth and potential uneven frost heave. Alternatively, the model can contemplate the module of soil before and after freeze-thaw, so that, the changes due to different temperature state can be considered. However, the change of module is not taken into account to simplify this complex multiphase analysis process. The input parameters of various materials in this study are obtained from frost heave test and some common values used in previous research (Ishikawa et al., 2015 ; Tokoro et al., 2016 ), as listed in Table 1.

|
| Figure 1 Boundary condition and finite element mesh of simulated culvert |
| Parameters | Description | Frost-susceptible fill | Anti-frost fill | Ground | Graded gravel | Ballast | Concrete |
| E (MPa) | Deformation modulus | 40 | 100 | 25 | 180 | 300 | 21,700 |
| υ | Poisson's ratio | 0.35 | 0.35 | 0.35 | 0.35 | 0.35 | 0.20 |
| kij (m/s) | Soil permeability | 1.0E–8 | 1.0E–5 | 1.0E–8 | 5.0E–5 | 5.0E–4 | 1.0E–10 |
| λT (W/(m·°C)) | Thermal conductivity | 1.61 | 1.97 | 1.90 | 0.60 | 1.70 | 1.50 |
| Cd (J/(m3·°C)) | Specific heat of dry soil | 9.9E+5 | 2.0E+6 | 2.7E+6 | 1.8E+6 | 1.7E+6 | 2.5E+6 |
| βT (°C−1) | Thermal expansion coefficient | 1.2E–5 | 1.0E–5 | 1.0E–5 | 1.0E–5 | 1.0E–5 | 1.0E–5 |
| ρd (kg/m3) | Dry density of soil | 1,400 | 1,600 | 1,400 | 2,000 | 1,700 | 2,300 |
| n | Porosity | 0.450 | 0.390 | 0.470 | 0.260 | 0.320 | 0.050 |
| κ | Constants (Equation (7)) | 0.872 | – | – | – | – | – |
| εfmax | 0.067 | – | – | – | – | – | |
| ς (MPa−1) | 13.48 | – | – | – | – | – | |
| c | Constants (Equation (8)) | 0.085 | – | – | – | – | – |
| d (MPa−1) | 1.343 | – | – | – | – | – |
For the temperature boundary, a sinusoidal function (Andersland and Ladanyi, 2004) was used to approximate the annual variation in air temperature Ta, and the fitting parameters Tm, A, p and φ employed in Equation (6) of this approximation were obtained through typical meteorological data in Hokkaido.
| ${T_s} = {T_m} + A \cdot \sin \left({\frac{{2\text{π} t}}{p} + \varphi } \right) + \Delta T$ | (10) |
where Tm is mean annual air temperature, 5.5 °C; A is air temperature amplitude, 16.3 °C; t is time (day), and p is a corresponding period, 365 days; and φ is an initial phase, −2.75 rad.
The surface temperature (Ts) of ballast and the inner surface of the culvert (Liu et al., 2014 ) are given as:
| ${T_s} = {T_m} + A \cdot \sin \left({\frac{{2\text{π} t}}{p} + \varphi } \right) + \Delta T$ | (10) |
where ΔT is the increment of temperature induced by boundary layer, considered to be 3 °C for ballast surface and 0 °C for culvert surface. At the bottom of the model, the ground temperature (Tz) is expressed as:
| ${T_\textit{z}} \!=\! {T_m} + A \cdot \exp (- \textit{z}\sqrt {\frac{\text{π} }{{{\alpha _u}p}}}) \cdot \sin \left({\frac{{2\text{π} t}}{p} + \varphi \!-\! \textit{z}\sqrt {\frac{\text{π} }{{{\alpha _u}p}}} } \right)$ | (11) |
where z is depth below the air temperature boundary, 7 m; αu is thermal diffusivity of ground soil, 3.82E−7 W/(m2·°C); and heat flow from the earth's interior is assumed to be negligible. Initial temperature distribution was obtained through a ten years' heat transfer governing by Equations (10) and (11). Then 250 days (6,000 hours) freeze-thaw process was performed.
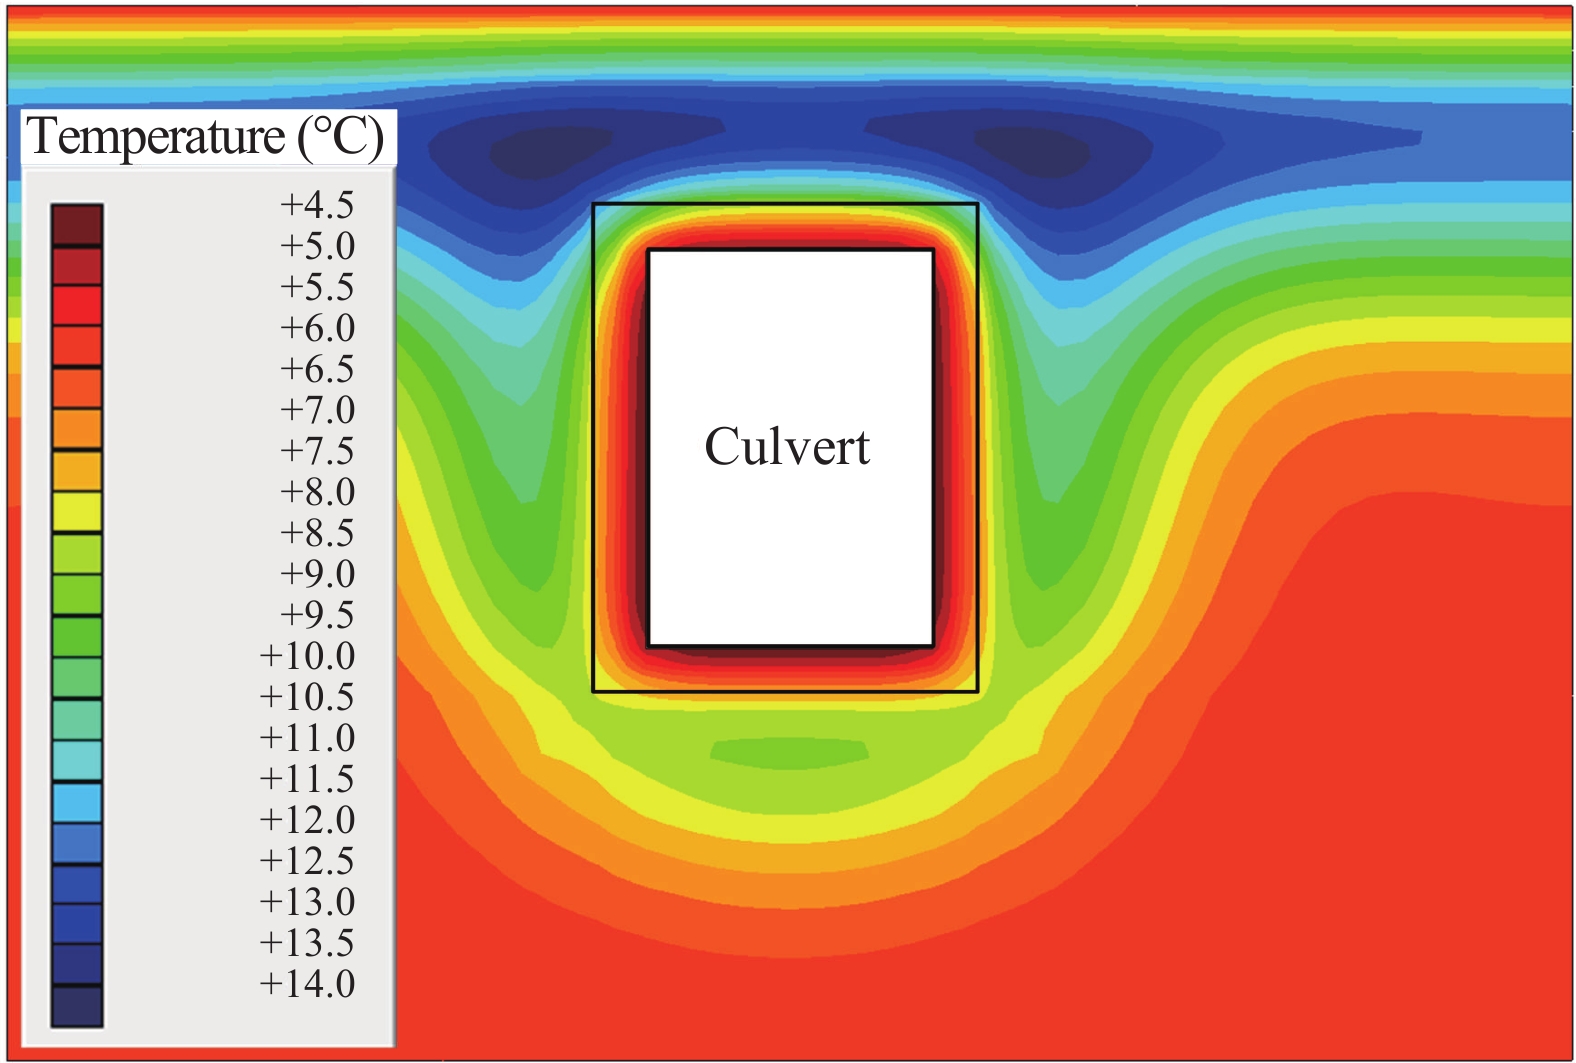
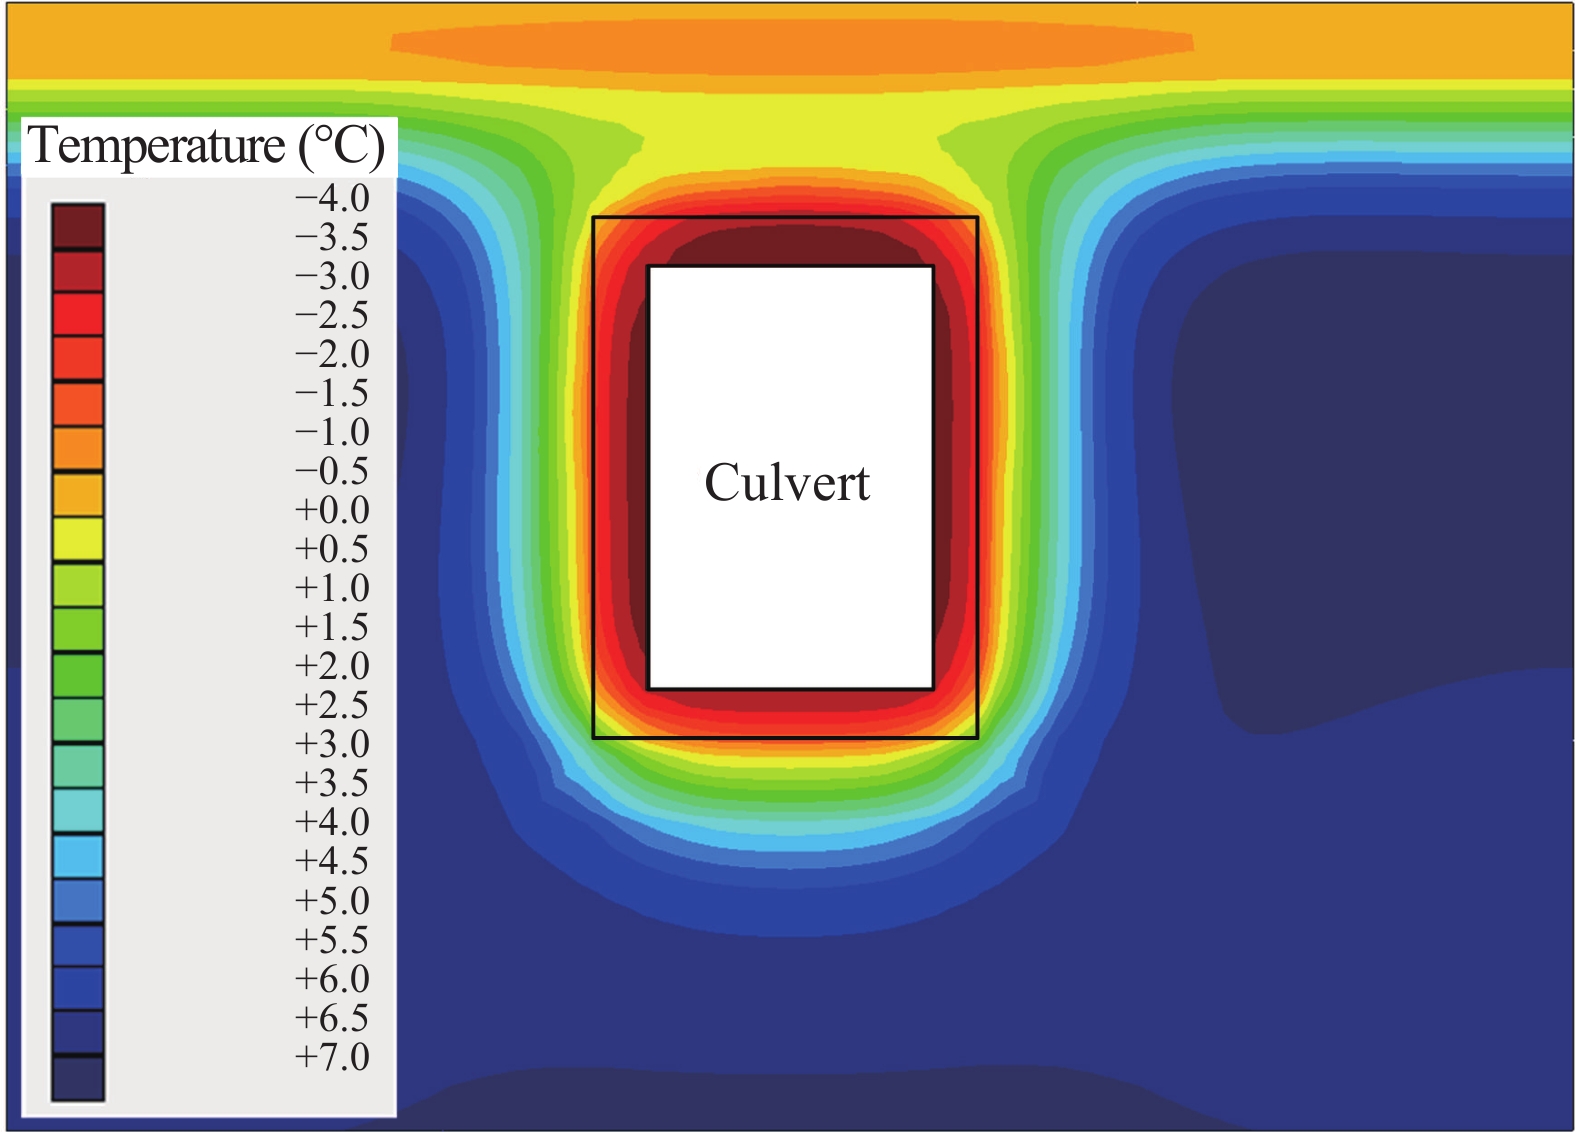
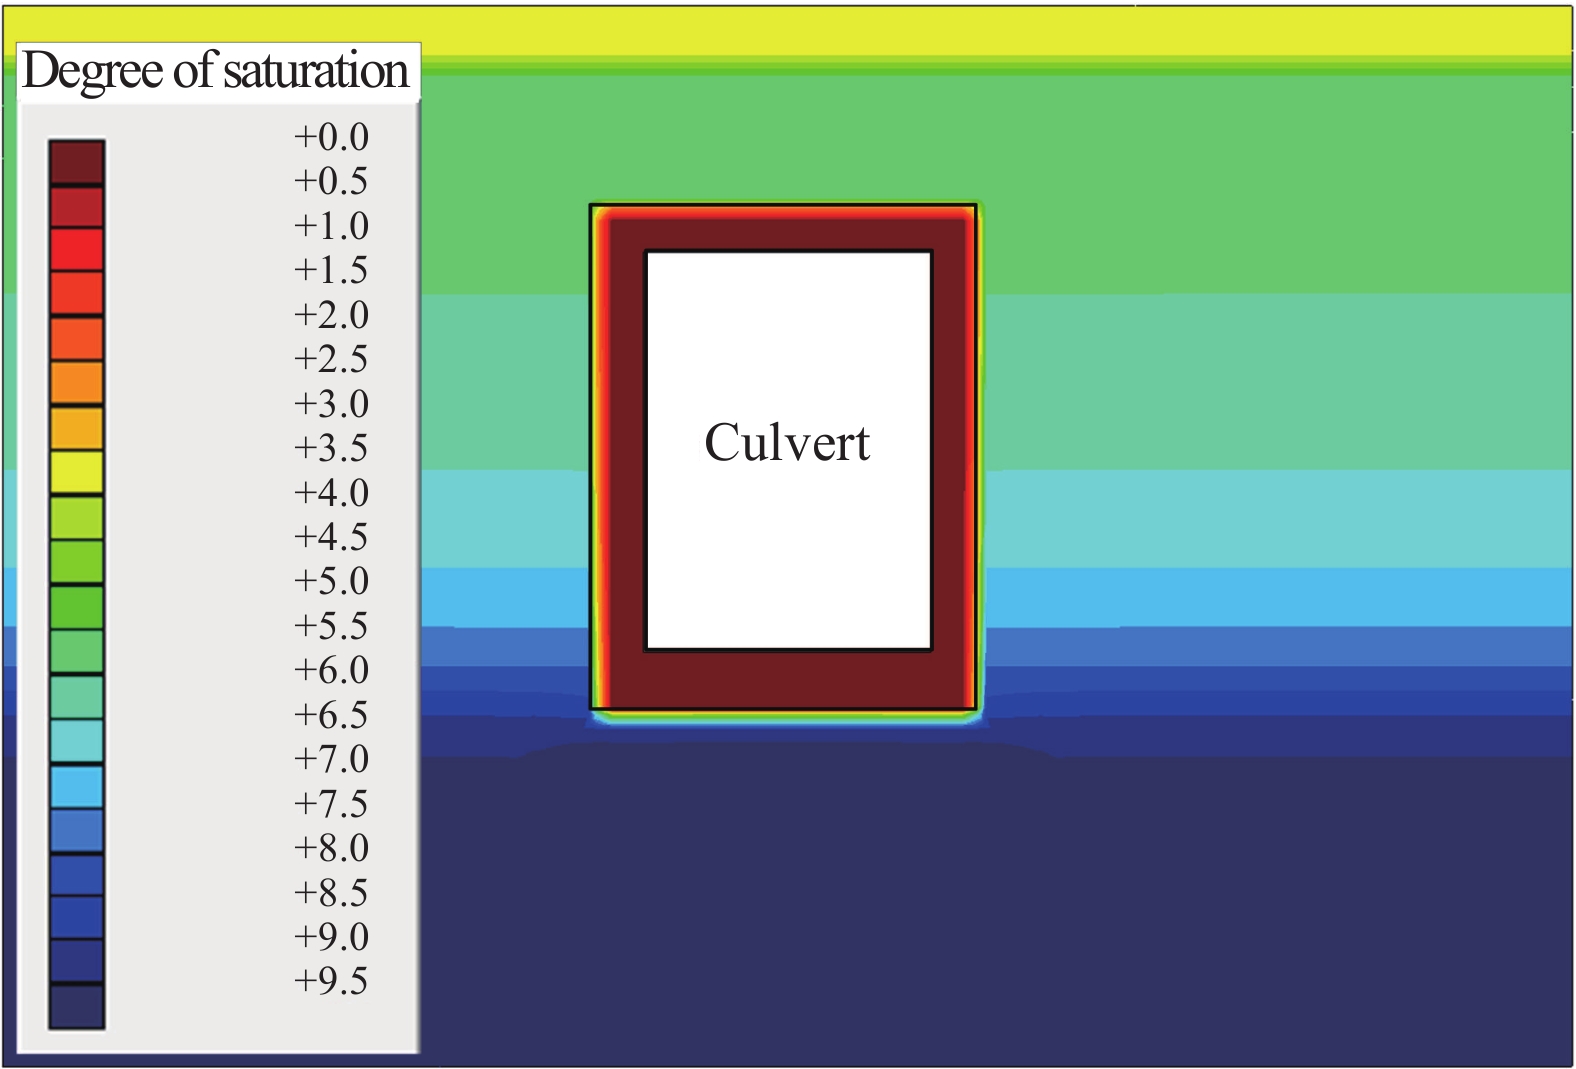
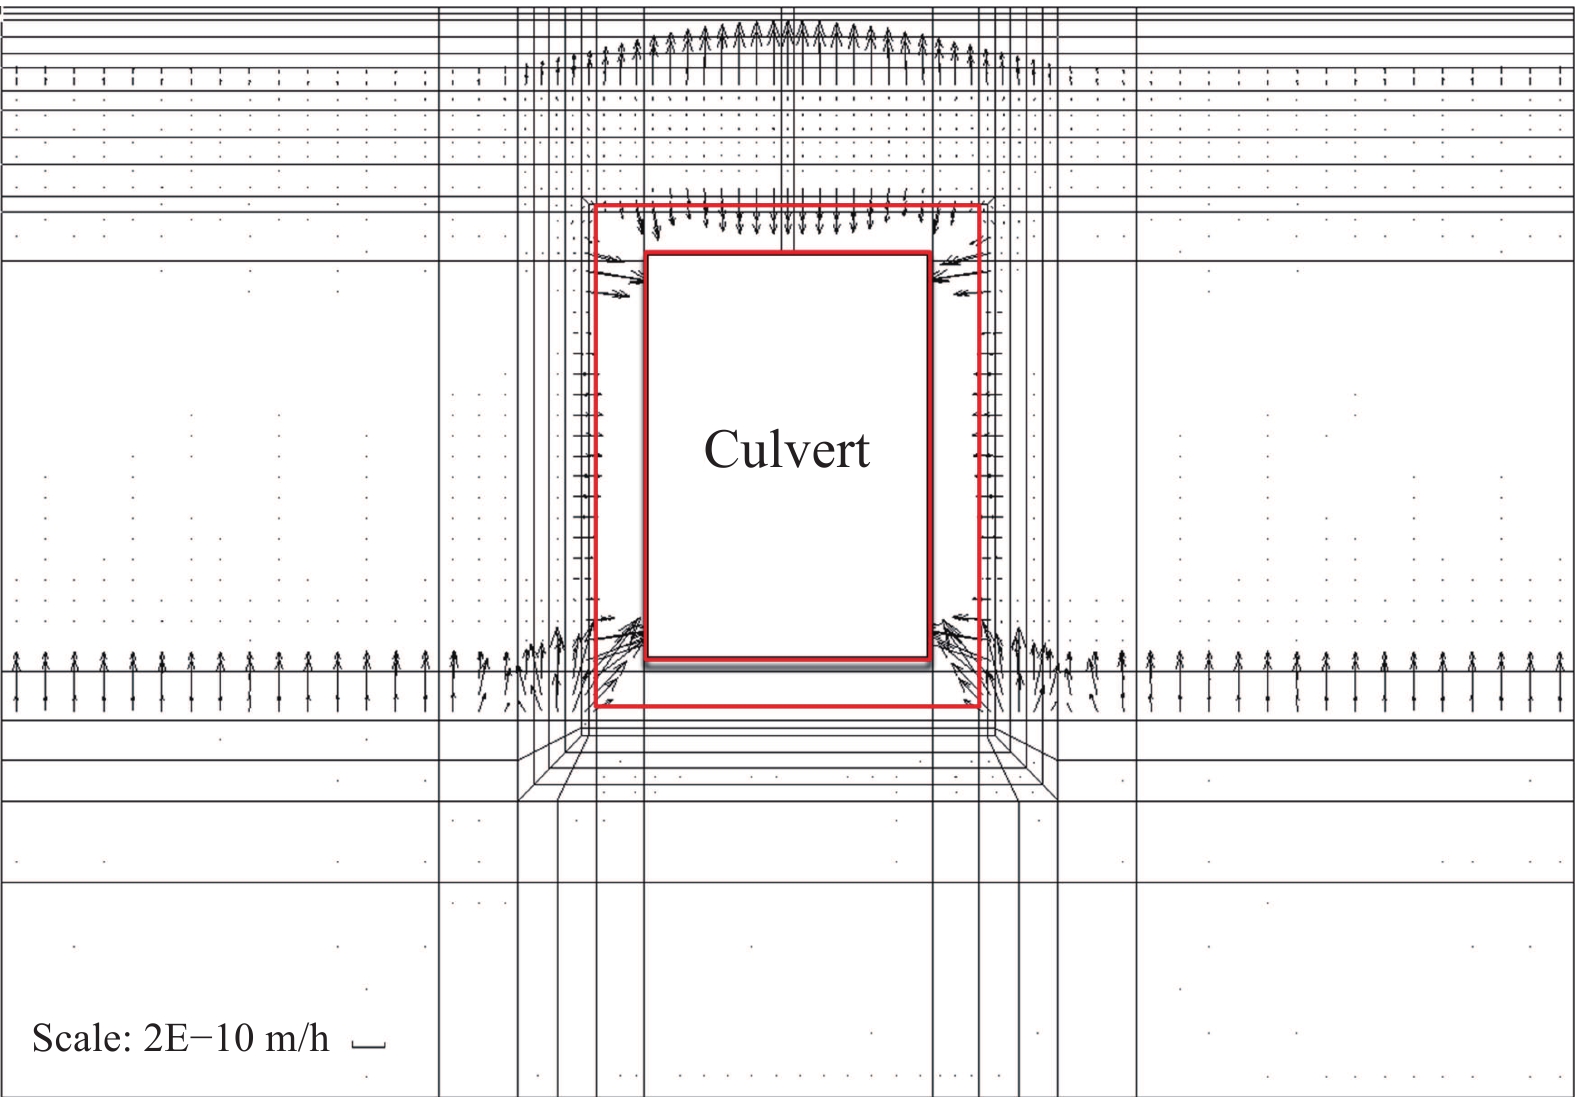
4 Thermal and hydraulic characteristicFigure 2 shows the initial temperature field. As the subgrade right above the culvert is subjected to cooling from both the ballast surface and the inner side of culvert simultaneously, the thermal regime around the culvert changes and the frost penetration depth above the culvert is deeper than adjacent zone, as presented in Figure 3. Figure 4 illustrates the initial distribution of the degree of saturation, and the fill around the culvert is unsaturated. The phase change of pore-water causes suction, then water in subgrade above the culvert migrates towards the freezing front which advances from both the ballast surface and culvert inner surface. Also, water only flows upwards in the adjacent zone which undergoes top-down single-sided cooling, as presented in Figure 5.
|
| Figure 2 Initial temperature field |
|
| Figure 3 Temperature distribution (3,000 hours) |
|
| Figure 4 Initial distribution of the degree of saturation |
|
| Figure 5 Seepage velocity vector (1,500 hours) |
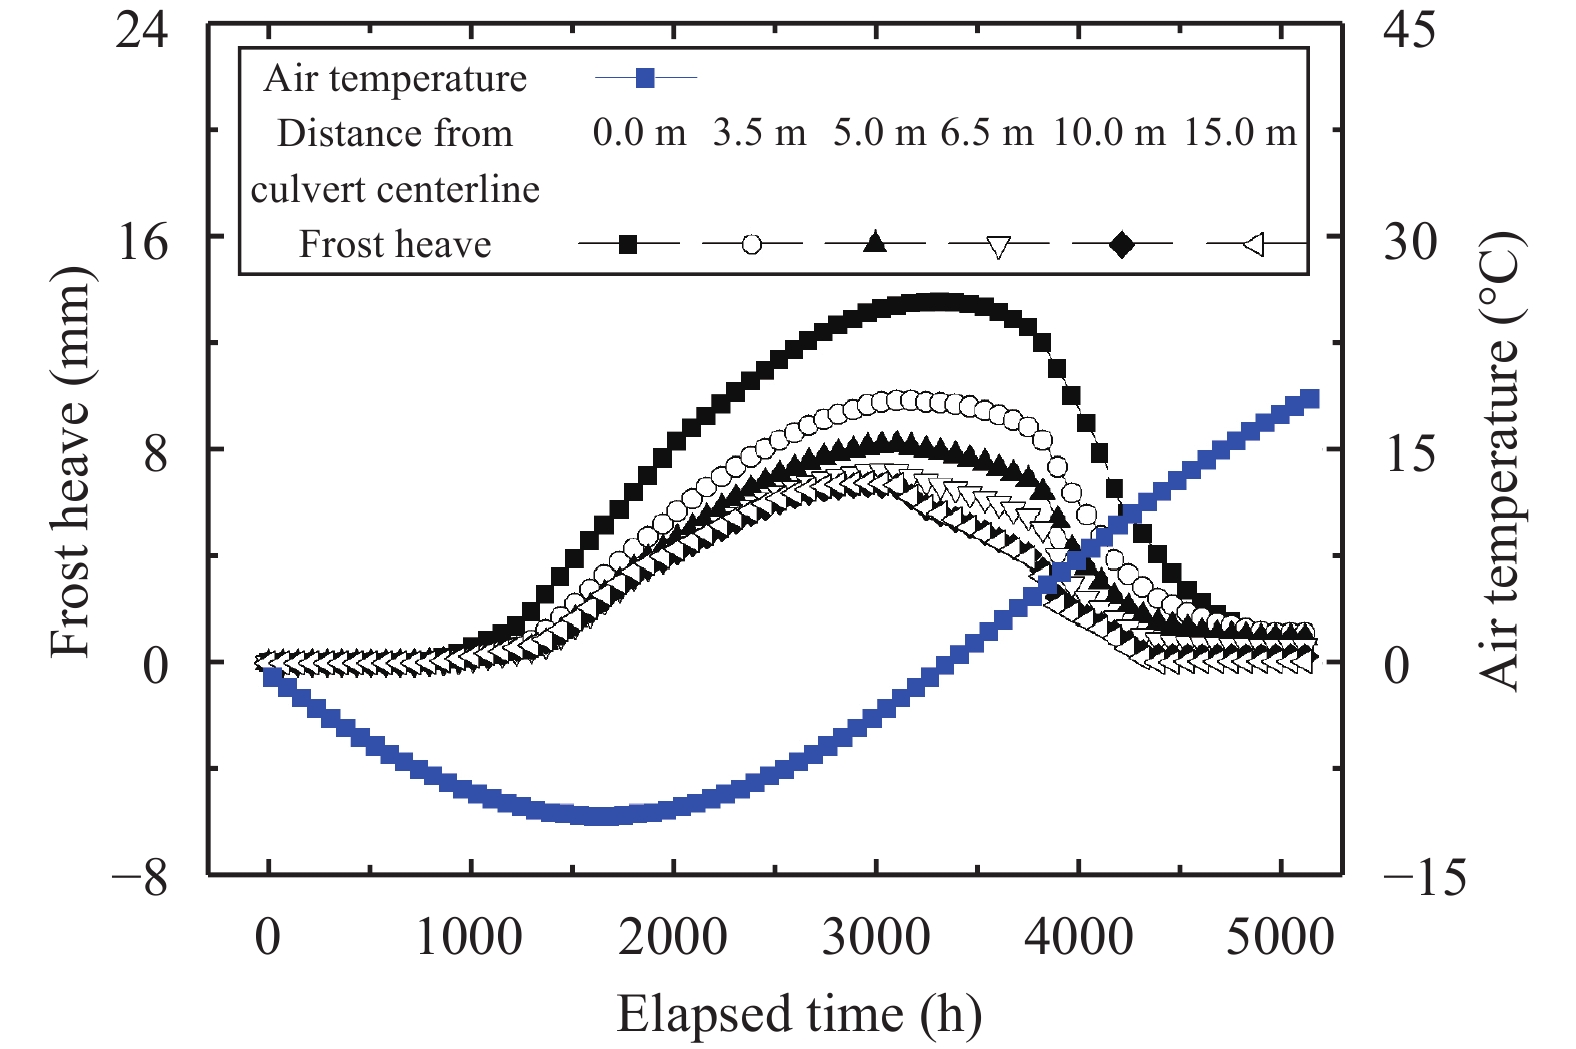
Figure 6 indicates time histories of frost heave on the surface of ballast induced by volume expansion of subgrade soil above the top of the culvert. When the air temperature is below 0 °C, the frost line gradually penetrates into the roadbed. After about 1,000 hours' heat transfer, freezing front reaches frost-susceptible fill, and then frost heave occurs. As mentioned above, the freezing front advances faster above the culvert than adjacent zone, the frost heave at the centerline of the culvert increased faster and decreased with increasing distance from the centerline of the culvert. For the locations, more than 6.5 m away from the centerline of the culvert, namely exceeding the culvert by about 3 m, the difference of frost heave is quite small. That is to say, the impact range of the culvert is about 3 m under this given condition. When the air temperature rises above 0 °C, the frozen fill starts to thaw at all locations. However, the thaw contraction process of soil above the culvert takes more time than adjacent zone, which is a complex nonlinear thermo-hydraulic process. During the freezing process, these soils absorb more water from the surroundings, and phase change of these absorbed water can store more cooling energy which may take a longer time to be released in the subsequent thaw process.
|
| Figure 6 Time histories of frost heave |
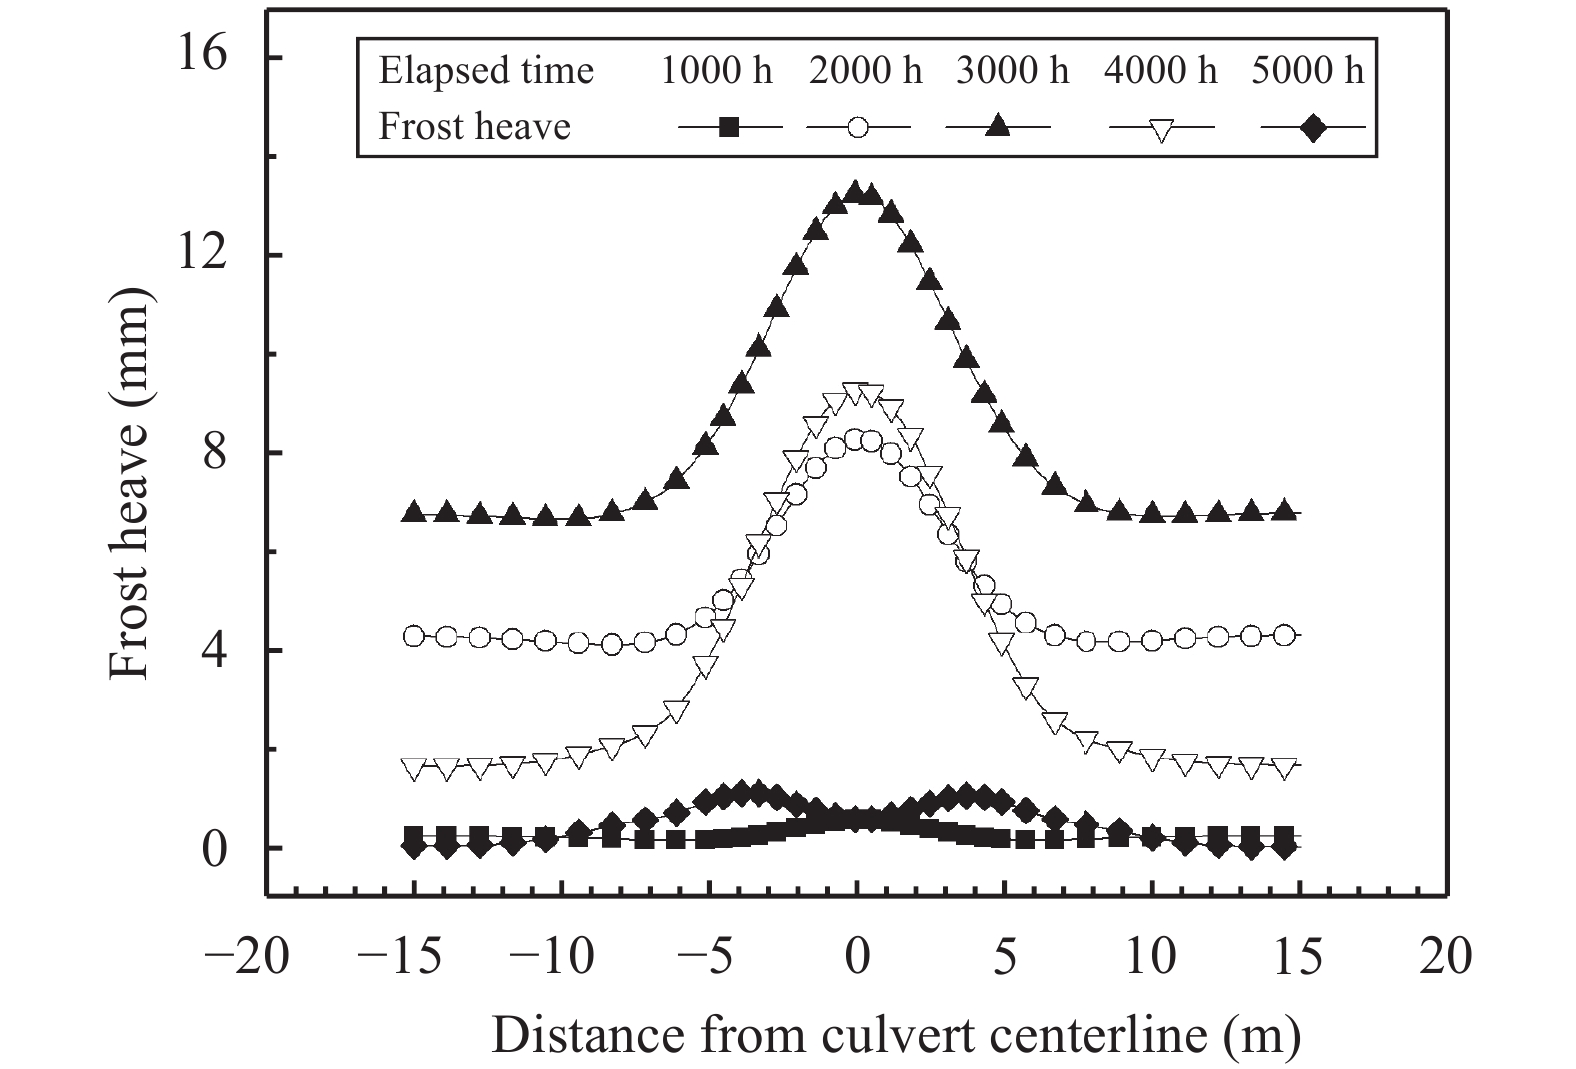
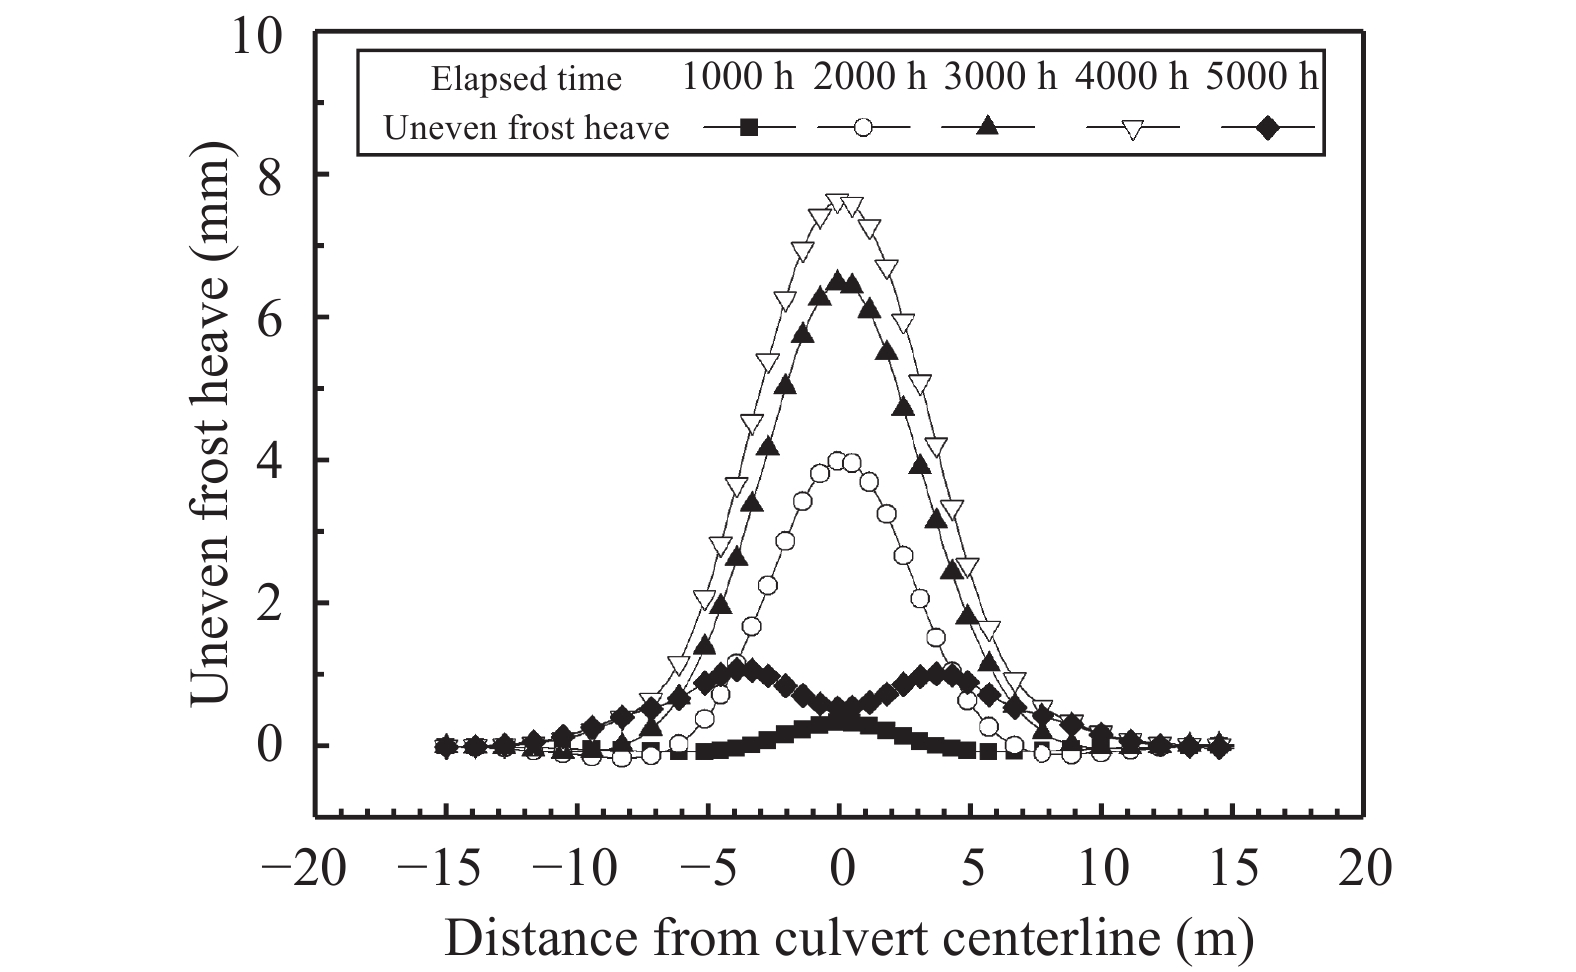
The distribution of frost heave on the ballast surface along the longitudinal direction of the railway is presented in Figure 7. An apparent hump appears above the culvert, while a small dip can be observed in the thawing process. For railway engineering, differential deformation is more important to the smoothness of rail track than total deformation to some extent. Figure 8 gives the distribution of uneven frost heave. A maximum uneven frost heave of 8.87 mm distributes in 10 m, the slope of rail is about 0.9‰ which is close to the limit of allowable slope in transition section (1‰) in Japanese railway design standard (Railway Technical Research Institute, 2012) and may increase maintenance.
|
| Figure 7 Distribution of frost heave |
|
| Figure 8 Distribution of uneven frost heave |
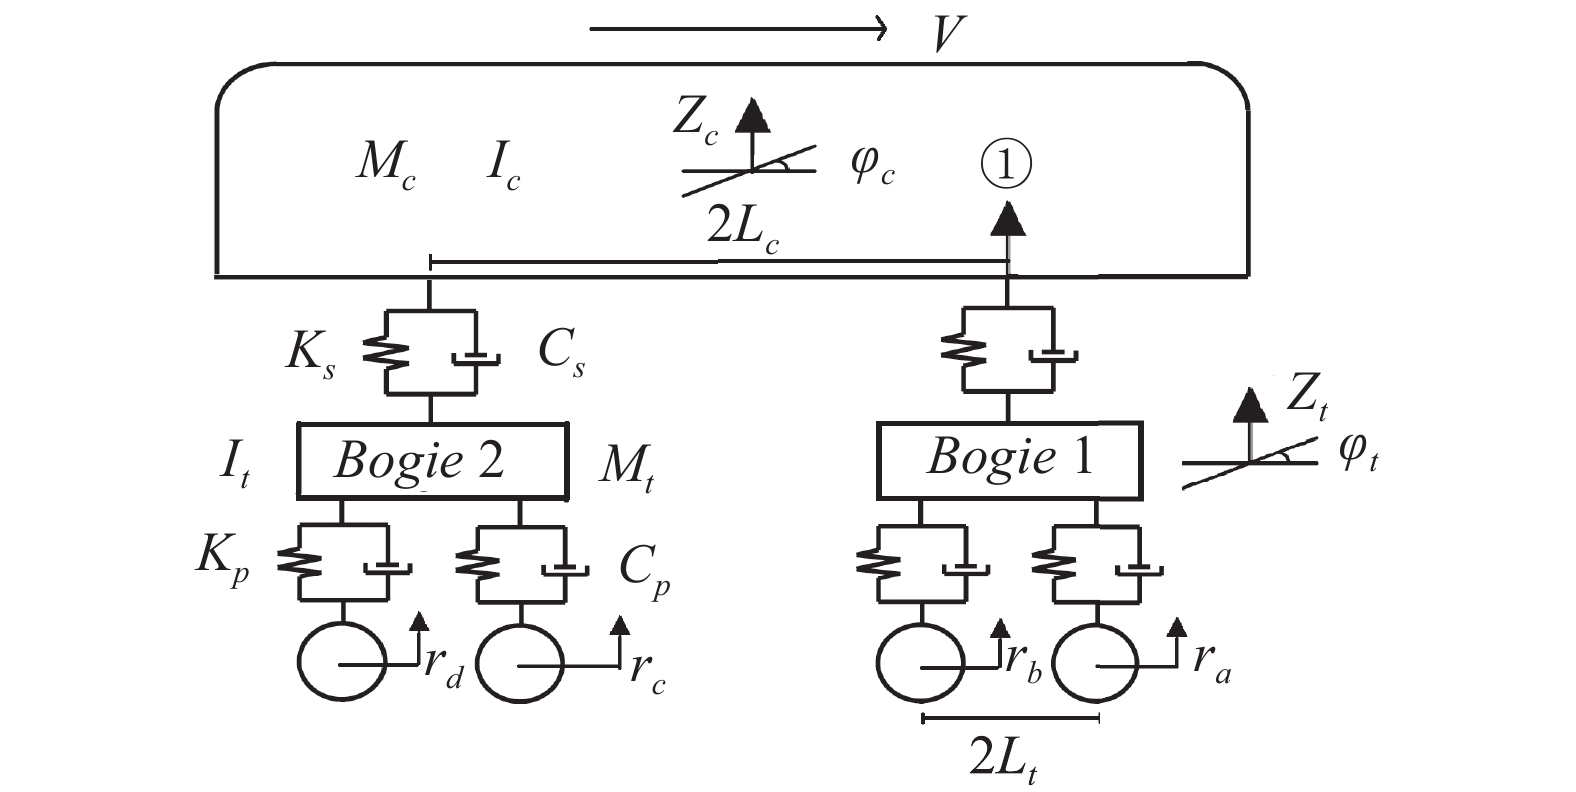
To evaluate train vibration induced by uneven frost heave, vehicle vertical acceleration was predicted through a vibration analysis using a vehicle dynamic model as presented in Figure 9. The model consisted of a conventional low-speed moving railway vehicle on track assumed to move at a constant velocity. The considered vehicle was treated as a 6-degree-of-freedom lumped mass system comprising the car body mass (Mc) and its moment of inertia (Ic), the double-axle frame masses (Mt) and their moment inertia (It). The primary suspension is linked with the car body mass through the secondary suspension. The secondary suspension contains a vertical stiffness (Ks) and a vertical damping (Cs), whereas the primary suspension has two stiffness (Kp) and two damping (Cp). Four wheelsets unsprung are considered as rigid bodies. Zc is vertical acceleration at the car body center point, and φc is angular displacement of pitch motion for the car body. Zt and φt are the vertical displacement and angular displacement of pitch motion for the bogie; ri (i=a, b, c, and d) is the vertical displacement for each wheel. As the accelerometer is placed on the groud of the car body right above the first bogie, in this model we calculate the acceleration of the car body at position ① for comparison. Parameters of vehicle dynamic model are summarized (Lei and Noda, 2002) in Table 2.
|
| Figure 9 Vehicle dynamic model |
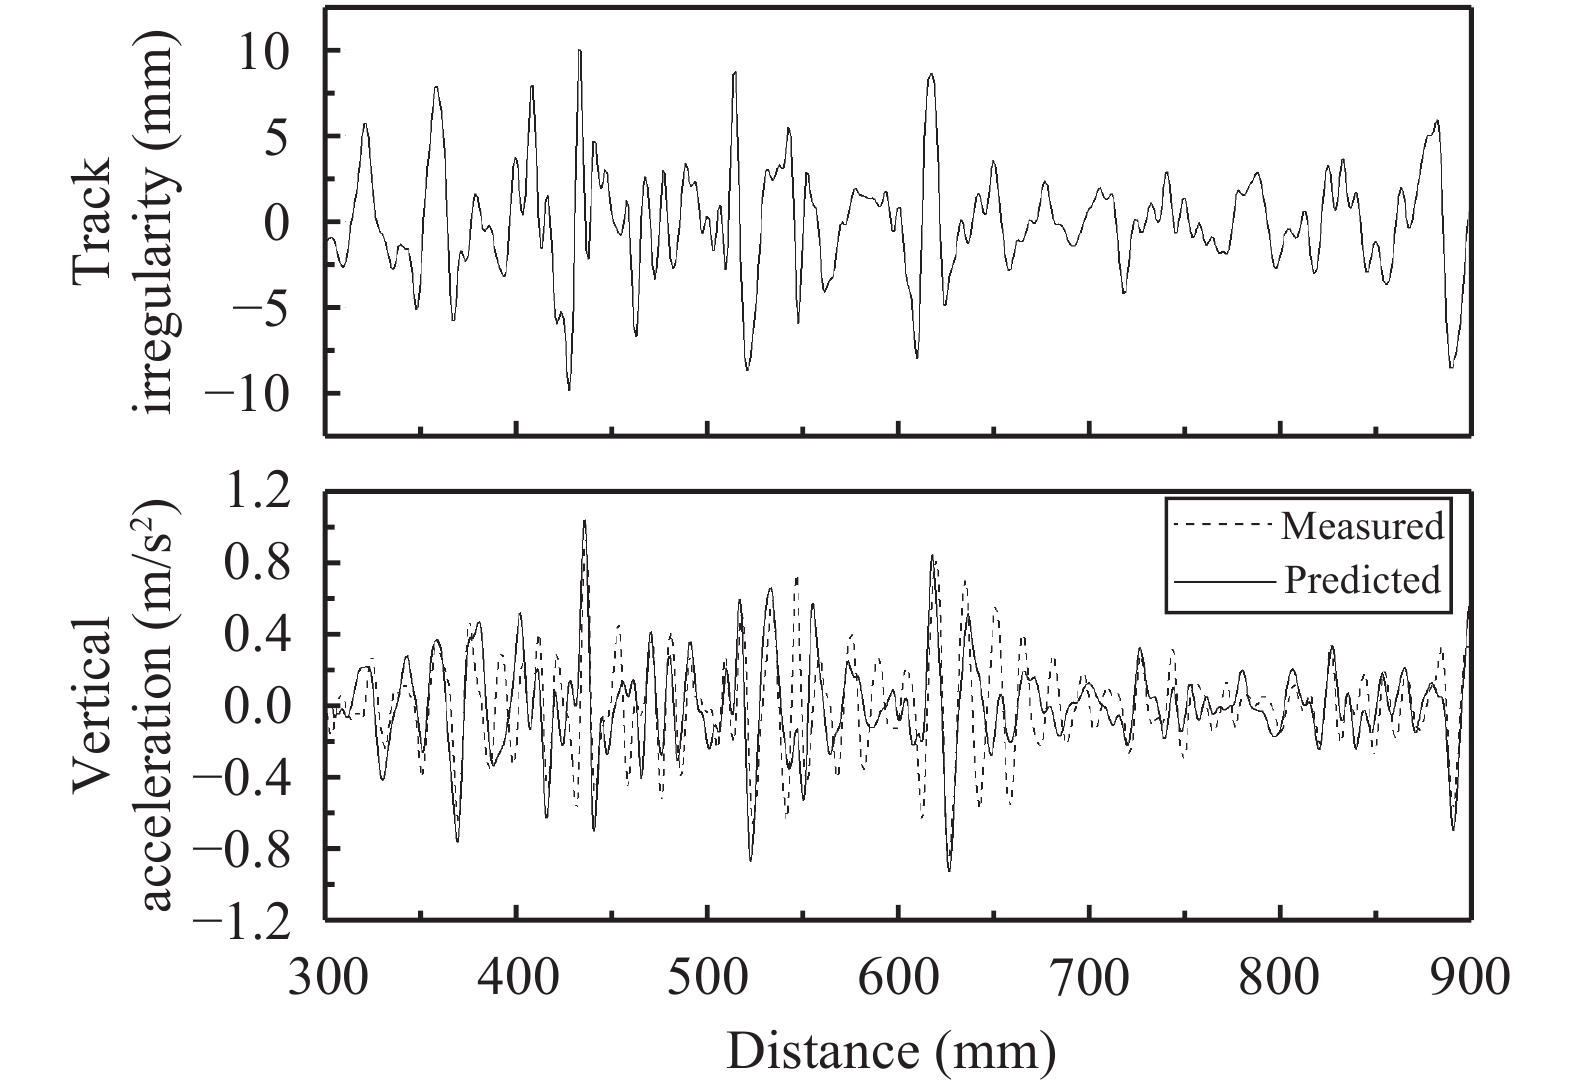
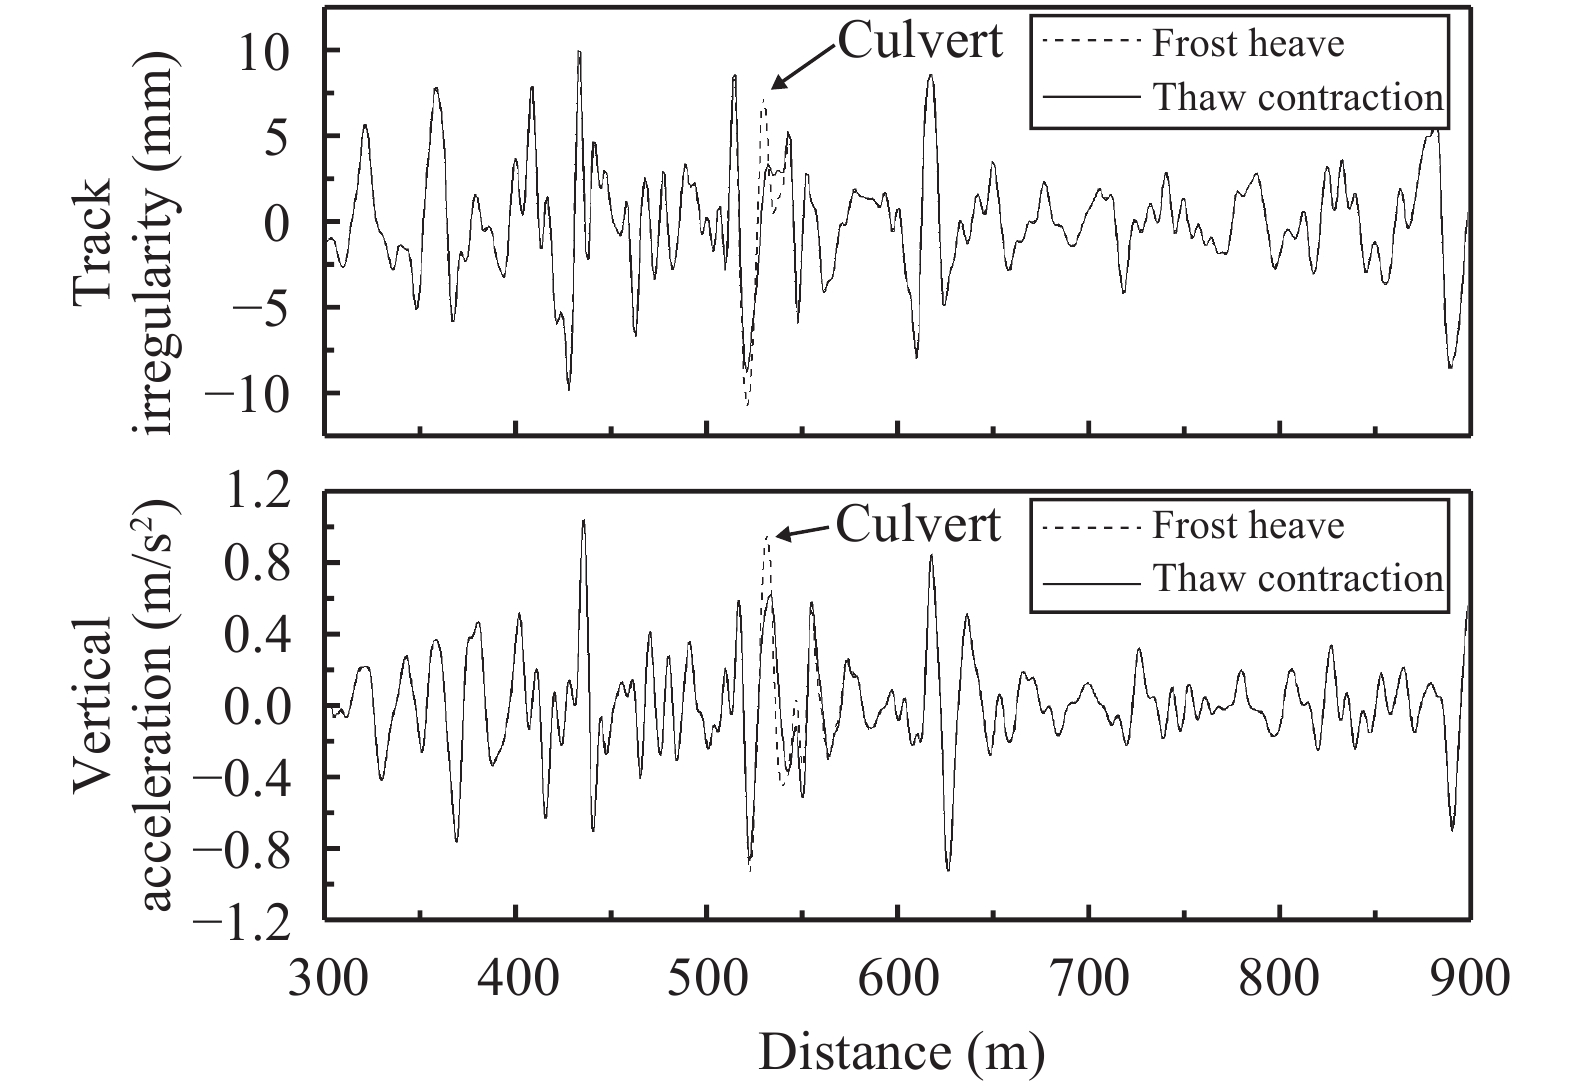
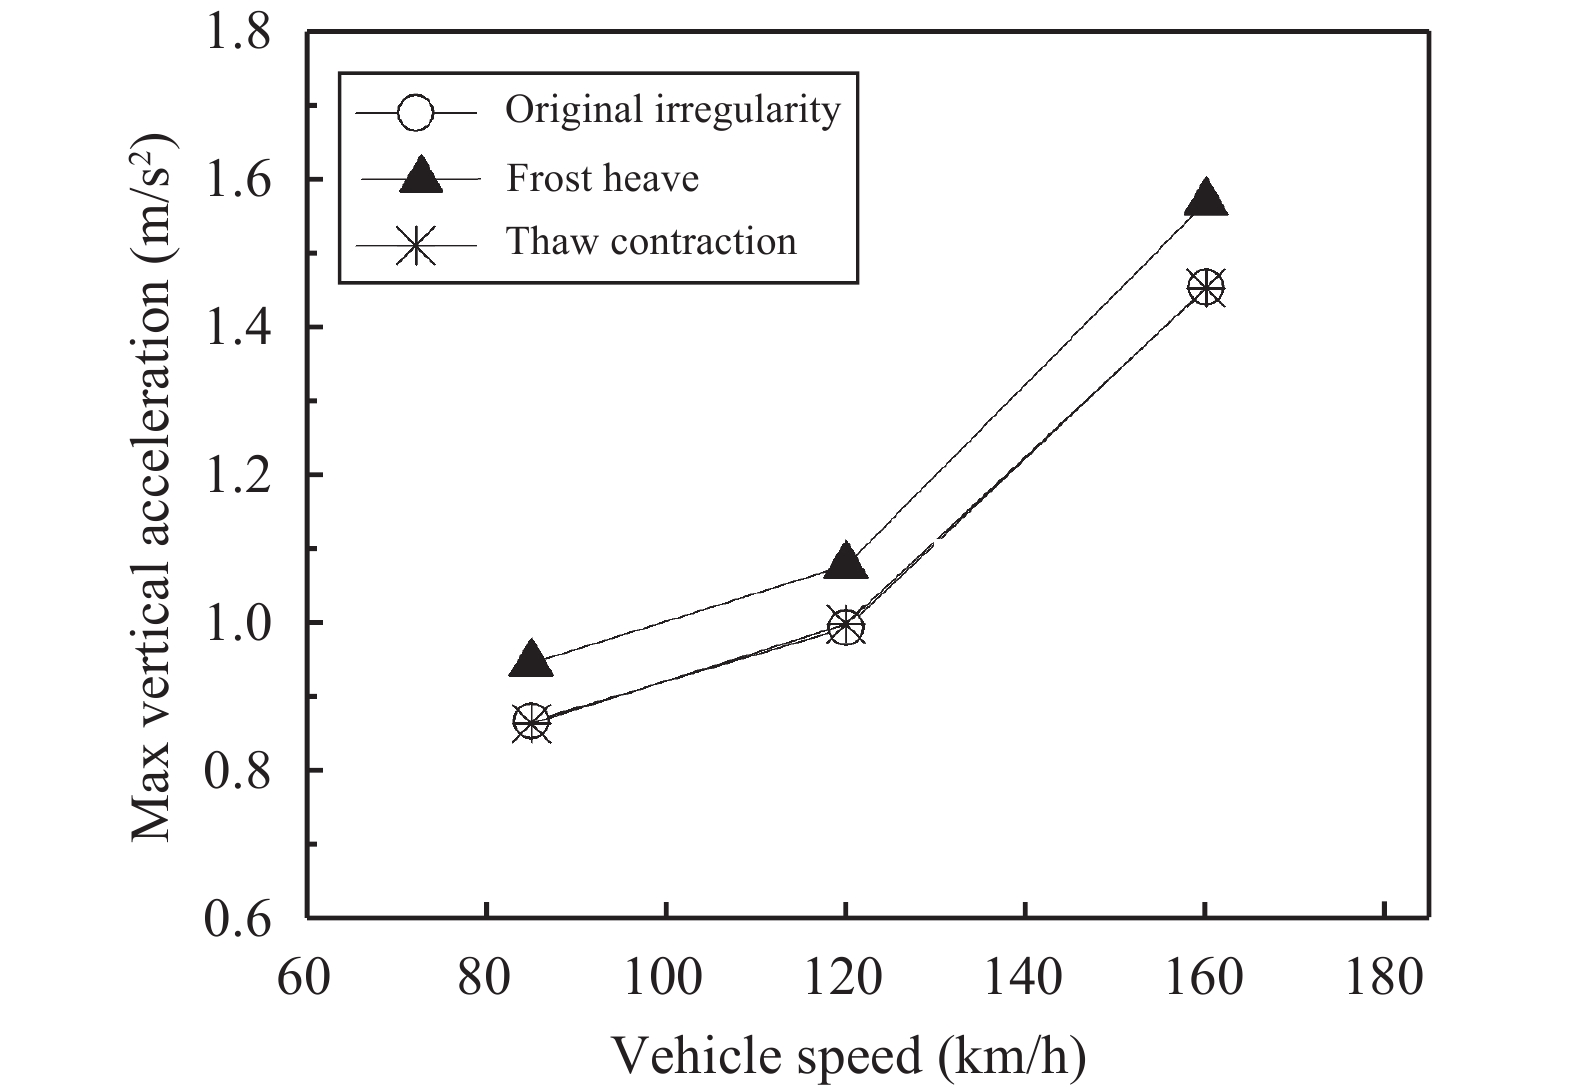
The measured vehicle vertical acceleration and irregularity in Nemuro Main Line in Hokkaido was used to examine the validity of this vehicle dynamic model. The train is at a speed of 85 km/h, and the measured distance-dependent irregularity was converted into time-dependent displacement excitation and input into the model as vertical displacement of each wheel. The comparison of predicted and measured vertical acceleration is presented in Figure 10. The vertical acceleration predicted from the analysis matches reasonably with the measured data, which validates the performance of this model. For simplification, the irregularity converted from uneven frost heave mentioned above and originally measured track irregularity are superposed, as presented in Figure 11. The frost-induced irregularity has a more significant influence on vertical acceleration than that in the thaw process. Figure 12 illustrates the effect of vehicle speed on maximum vertical acceleration. The increment of vertical acceleration induced by uneven frost heave increases with vehicle speed, and the predicted vertical acceleration may exceed the limit of 1.5 m/s2 in Japanese railway design standard (Railway Technical Research Institute, 2012) when the vehicle speed is higher than 160 km/h. The adjustment of track level or speed limit is quite essential to reduce train vibration. As the residual deformation of roadbed after thaw contraction is quite small, the track may go back to the initial state. Therefore, the max vertical acceleration after thaw contraction is almost the same to the one induced by original irregularity.
| Parameters | Description | Value |
| Mc (kg) | Car body mass | 38,700 |
| Mt (kg) | Bogie mass | 5,690 |
| Ic (kg·m2) | Car body mass inertia | 1,744,000 |
| It (kg·m2) | Bogie mass inertia | 3,047 |
| Kp (kN/m) | Primary suspension vertical stiffness | 2,560 |
| Ks (kN/m) | Secondary suspension vertical stiffness | 430 |
| Cp (kN·s/m) | Primary suspension damping | 26.6 |
| Cs (kN·s/m) | Secondary suspension damping | 80 |
| Lt (m) | Half of bogie distance | 1.25 |
| Lc (m) | Half of car body distance | 7.85 |
|
| Figure 10 Variation of vertical acceleration |
|
| Figure 11 Variation of vertical acceleration in freeze-thaw process |
|
| Figure 12 Vertical acceleration vs. vehicle speed |
For railways in cold regions, the thermal regime changes with the presence of culverts, and the frost heave right above the culvert is larger than the adjacent zone. Uneven frost heave in the culvert-roadbed transition section can highly affect track smoothness and enhance train vibration. The frost-induced longitudinal track slope is close to limit (0.9‰), and enhanced vertical acceleration exceeds the limit (1.5 m/s2) in design standard, which may lead to high maintenance and limiting speed.
Acknowledgments:This research was supported in part by Grant-in-Aids for Scientific Research (A) (16H02360) and Research (C) (15K06214) from Japan Society for the Promotion of Science (JSPS) KAKENHI. The support from the China Scholarship Council (CSC) is also greatly acknowledged.
| Andersland OB, Ladanyi B, 2004. Frozen Ground Engineering. Hoboken: John Wiley & Sons. |
| Ishikawa T, Kijiya I, Tokoro T, et al., 2014. Numerical experiments on freeze-thaw of soils with coupled thermo-hydro-mechanical FE analysis. Proceedings of the 14th International Conference of the International Association for Computer Methods and Advances in Geomechanics, Kyoto, Japan, pp. 415–420. |
| Ishikawa T, Tokoro T, Akagawa S, 2015. Frost heave behavior of unsaturated soils under low overburden pressure and its estimation, Proceedings of GEO Quebec 2015, Quebec, Canada, [1/1(USB)792], 2015.9. |
| Lei X, Noda NA, 2002. Analyses of dynamic response of vehicle and track coupling system with random irregularity of track vertical profile. Journal of Sound and Vibration, 258(1): 147–165. DOI: 10.1006/jsvi.5107 |
| Liu H, Niu FJ, Niu YH, et al, 2014. Study on thermal regime of roadbed-culvert transition section along a high speed railway in seasonally frozen regions. Cold Regions Science and Technology, 106: 216–231. DOI: 10.1016/j.coldregions.2014.07.008 |
| Niu FJ, Liu H, Niu YH, 2014. Experimental study on freeze characteristics in roadbed-culvert transition section along a high-speed. Chinese Journal of Rock Mechanics and Engineering, 33(3): 639–646. DOI: 1000–6915(2014)03-0639-08. (in Chinese) |
| Railway Technical Research Institute, 2012. Design Standards for Railway Structures—Track Structure. Tokyo: Maruzen Publishing. (in Japanese) |
| Tokoro T, Kimura K, Ishikawa T, et al., 2016. Temperature dependency of permeability coefficient of frozen soil, Proceedings of GEO Vancouver 2016, Vancouver, Canada. |
| Yu L, 2013. Observation and analysis on frost heaving deformation at subgrade of Harbin-Dalian PDL. Subgrade Engineering, 29(3): 54–58. DOI: 1003–8825(2013)03-0054-05. (in Chinese) |
| Zhang YZ, Du YL, Sun BC, 2016. Roadbed deformation characteristics of roadbed-bridge transition section for high speed railway in seasonal frozen soil region. China Railway Science, 37(1): 39–45. DOI: 10.3969/j.issn.1001-4632.2016.01.06. (in Chinese) |
| Zhang W, Wang JH, Li XM, et al., 2015. Influence of thermal-protective coating on the culvert in deep seasonally frozen region and its optimized. Journal of the China Railway Society, 37(12): 96–105. DOI: 10.3969/j.issn.1001-8360.2015.12.015. (in Chinese) |
 2017, 9


