Article Information
- Won-Taek Hong, Jong-Sub Lee . 2017.
- Application of a nondestructive method to evaluate the active layer in a cold region
- Sciences in Cold and Arid Regions, 9(3): 213-220
- http://dx.doi.org/10.3724/SP.J.1226.2017.00213
Article History
- Received: December 2, 2016
- Accepted: January 2, 2017
For facilitating human habitation in extremely cold regions, the construction of infrastructures such as railways, roadways, and pipelines is essential to support the efficient distribution and transfer of resources. To ensure the safe construction and provision of the infrastructure system in an extremely cold region, the soil behavior needs to be considered (Seppala, 1999). Geological structures in extremely cold regions are commonly composed of an active layer, permafrost, and unfrozen ground at the surface (U.S. Army and Air Force, 1983). While the permafrost maintains a frozen state and a below-zero ground temperature regardless of the seasonal temperature change, the active layer is cyclically frozen and thawed, according to the seasonal temperature change. When the active layer is frozen, frost heave occurs at the active layer and causes risk to the stability of the infrastructures (Kim et al., 2008 ).
The amount and force of the frost heave are mainly affected by soil characteristics such as grain-size distribution and mineralogy (Michalowski and Zhu, 2006; Bronfenbrener and Bronfenbrener, 2010), the volumetric water content, and the thickness of the active layer (Hermansson and Guthrie, 2005). Although the soil characteristics of the active layer can be precisely investigated through sampling and laboratory tests, the accuracy in evaluating the thickness and the volumetric water content is limited due to the disturbance that occurs during the sampling. Therefore, in situ evaluation of the thickness and the volumetric water content of the active layer can enable accurate estimation of the soil behavior in extremely cold regions.
As an estimation method for the volumetric water content of soils, many researchers have suggested determining the relationship between the volumetric water content and the dielectric constant (Topp et al., 1980 ; Ren et al., 1999 ; Vaz and Hopmans, 2001). In laboratory tests, the time-domain reflectometry (TDR) system is commonly adopted to evaluate the dielectric constant of the soils. The TDR generates the guided electromagnetic wave through two or three slender probes and gathers the reflected waves in the time domain. Because the velocity of the electromagnetic wave varies according to the dielectric constant of the soils surrounding the probes, the dielectric constant of the soils can be evaluated from the travel time of the electromagnetic wave (ASTM D6565). However, in the case of field applications, the subsurface should be excavated to the target depth, due to the limited probe length. Ground-penetrating radar (GPR) transmits the electromagnetic wave into the ground and collects the reflected electromagnetic wave to estimate the depth of the interface between the layers with different dielectric properties. However, an exact dielectric constant of the ground is necessary as an input value because the interface depth is calculated using the travel time of the electromagnetic wave and the dielectric constant (Al-Qadi and Lahouar, 2005). Thus, the dielectric constant can be inversely evaluated from the travel time of the electromagnetic wave if the accurate depth of the interface between the layers is known. In addition, the evaluated dielectric constant can be used for estimating the volumetric water content in the target ground by using the relationship between the dielectric constant and the volumetric water content.
In this study, GPR was applied in an extremely cold region to obtain the travel time of the electromagnetic wave in the active layer; and a dynamic cone penetrometer (DCP) was used to evaluate the interface depth between the active layer and the permafrost. In addition, ground temperatures were measured to verify the interface depth. This paper documents the experimental apparatuses, procedure, and evaluation process of the dielectric constant and the thickness of the active layer, using the results of the GPR survey and the DCP test.
2 Ground-penetrating radar (GPR)Ground-penetrating radar (GPR) has been commonly used to survey geological structures and objects buried in the ground, by detecting the reflected electromagnetic wave at an interface between the layers. The GPR system consists of an antenna and a control unit, as shown in Figure 1. An electromagnetic wave from the transmitter is reflected from an interface in the ground, and the reflected electromagnetic wave is gathered by the receiver (ASTM D6432). The gathered reflected electromagnetic waves along the survey line are monitored and saved by the control unit. In the extremely cold region, the depth of the interface (D) between the active layer and the permafrost, as shown in Figure 1, can be estimated as
| $D = \frac{S}{2} = \frac{{v\Delta t}}{2} = \frac{{c\Delta t}}{{2\sqrt {\textit{κ}} }}$ | (1) |
where S and ∆t are the travel distance and travel time, respectively, of the electromagnetic wave in the active layer; v and c are the velocities of the electromagnetic wave in the active layer and a vacuum (2.998×10⁸ m/s), respectively; and κ is the dielectric constant of the active layer.
In the GPR survey, representative dielectric constants were applied for estimating the interface depth according to the ground condition, as summarized in Table 1. Thus, if the accurate depth of the interface is known, the dielectric constant can be inversely calculated, using the travel time of the electromagnetic wave in the ground. In this study, the GPR survey is used to obtain the travel time of the electromagnetic wave reflected at the interface between the active layer and the permafrost, as shown in Figure 1.
| Ground condition | Dielectric constant, κ |
| Sand (dry) | 4~6 |
| Sand (saturated) | 25 |
| Silt (saturated) | 10 |
| Clay (saturated) | 8~12 |
| Ice (freshwater) | 4 |
| Ice (seawater) | 4~12 |
| Permafrost | 4~8 |
| Fresh water | 81 |

|
| Figure 1 Measurement system of ground-penetrating radar. ∆t is the travel time of the electromagnetic wave in the active layer, D is the interface depth between the active layer and the permafrost, and T and R denote the transmitter and receiver in the GPR antenna, respectively |
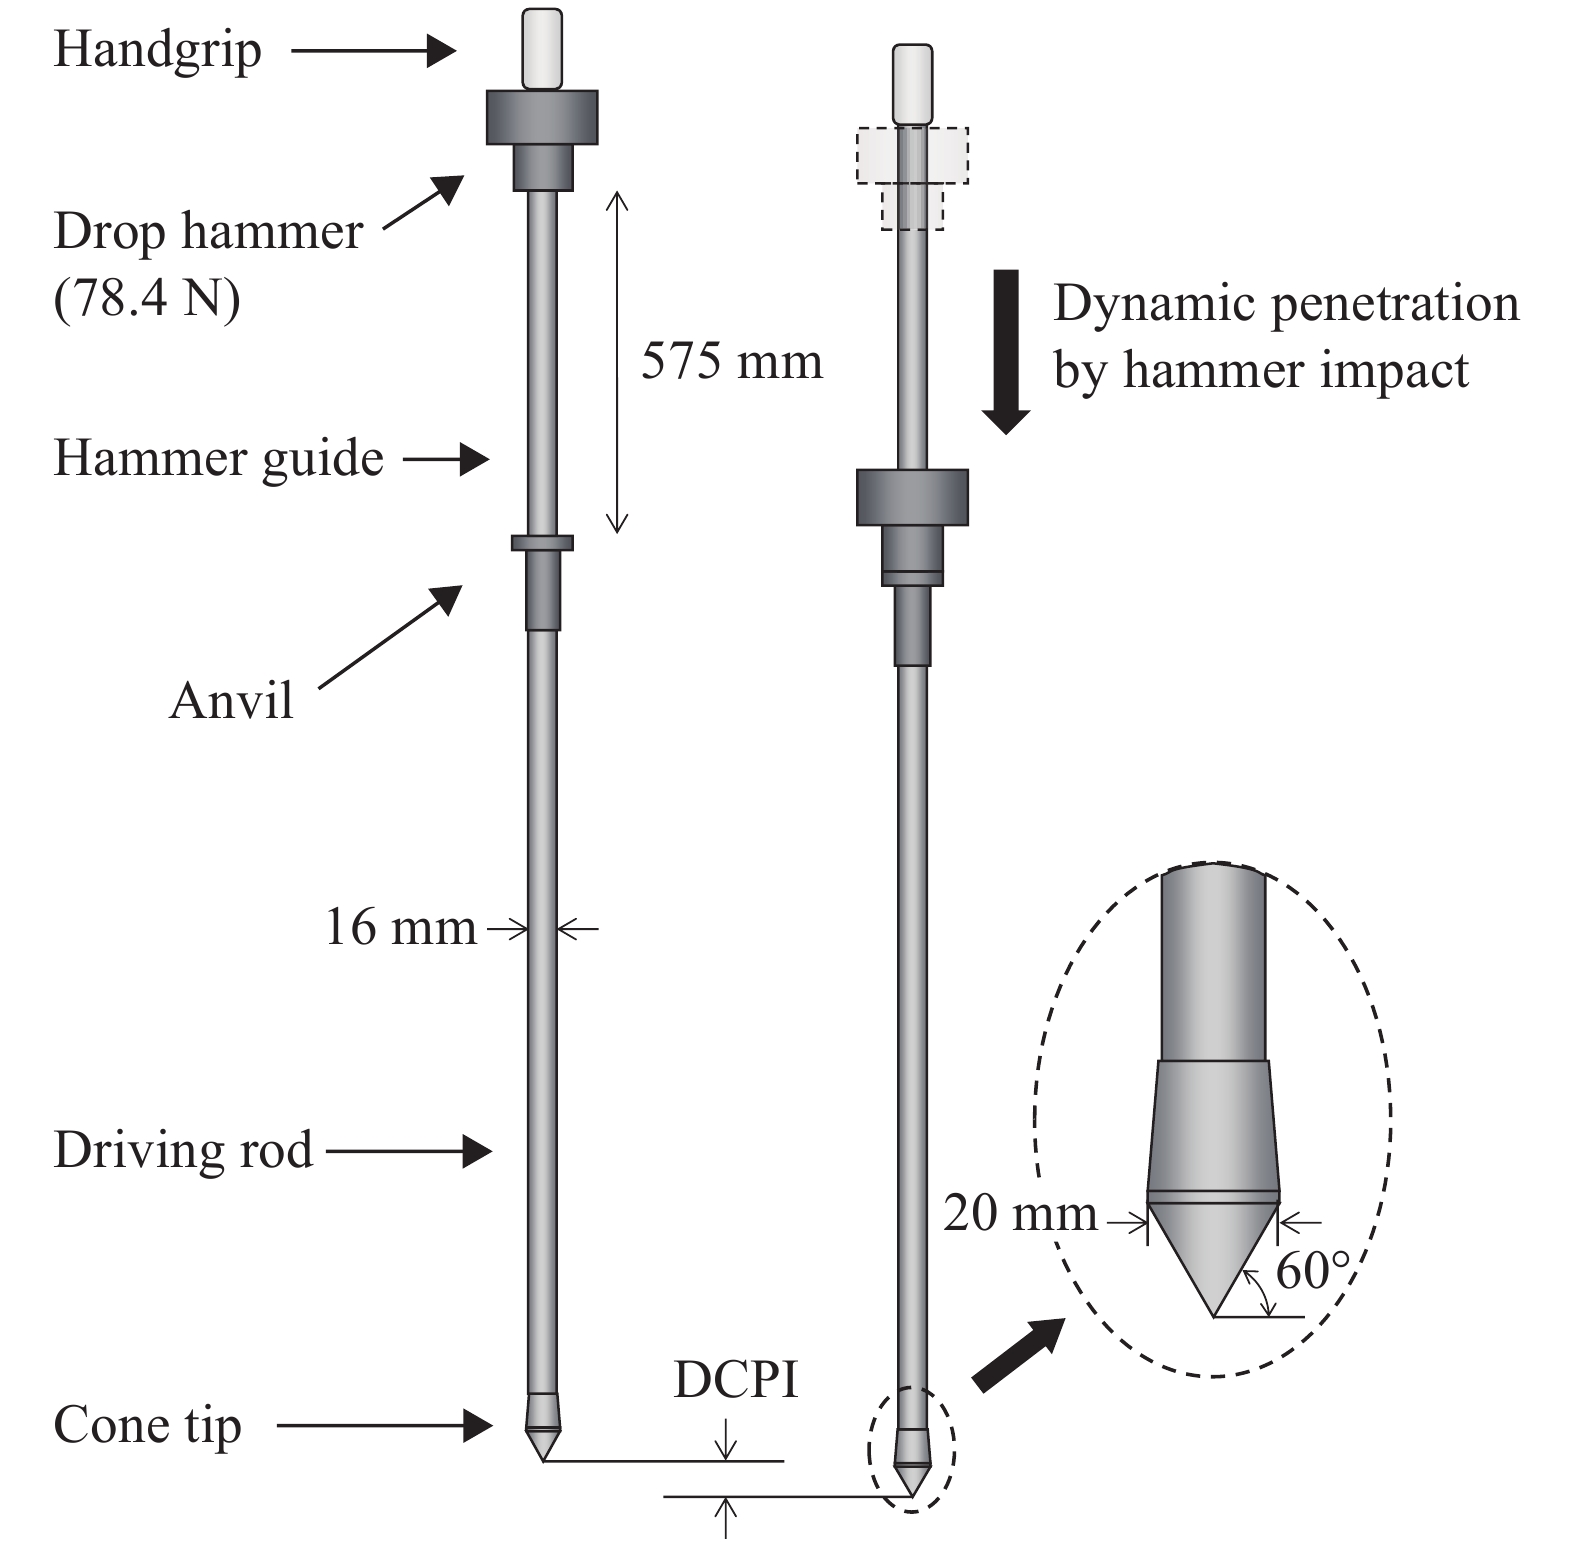
The dynamic cone penetrometer (DCP), introduced by Scala (1956), is a miniaturized in situ penetration equipment developed for characterizing ground strength. Many studies related to the DCP have been conducted, due to the high mobility and simple testing procedure of the DCP test. For applications of the DCP apparatus, Byun and Lee (2013) developed an instrumented dynamic cone penetrometer (IDCP) to characterize the subsurface with high accuracy; this IDCP is applied in extremely cold regions for characterizing the active layer (Byun et al., 2014 ). In addition, DCPs were incorporated with static penetration methods for characterizing railway-track substructures with high resolution (Byun et al., 2015 ; Hong et al., 2016 ). However, because the diameters and the penetration systems of penetrometers differ from those of standard DCP apparatuses, the experimental results are limited, as generally acceptable values cannot be found. The standard dynamic cone penetrometer consists of a cone tip with an apex angle of 60° and a diameter of 20 mm, and a driving rod with a diameter of 16 mm and a length of 1,000 mm, as shown in Figure 2. The DCP is dynamically penetrated into the ground using a hammer with a weight of 78.4 N at the drop height of 575 mm. From the result of the DCP test, a dynamic cone penetration index (DCPI) is obtained, which denotes the penetration depth per blow as follows (ASTM D6951):
| $DCP{I_n}[mm/blow] = {P_n} - {P_{n - 1}}$ | (2) |
where DCPIn is the dynamic cone penetration index at the nth blow, and Pn and Pn–1 are the penetration depths at the nth and n–1th blows, respectively.

|
| Figure 2 Schematic drawing of dynamic cone penetrometer (DCP) |
Although the permafrost remains in a frozen state, the active layer is in a thawed state and is in a very loose condition due to cyclic freezing and thawing. Thus, the strength of the active layer is expected to be less than that of the permafrost (Byun et al., 2014 ). In this study, the DCP is applied in an extremely cold region to evaluate the thickness of the active layer, based on the DCPI values between the active layer and the permafrost, which is the round-trip travel distance of the electromagnetic wave in the active layer obtained by the GPR survey.
4 Experimental setupA field located in midwest Alaska was selected as a study site. The thickness of the permafrost at the study site was reported to be 20~100 m (Jorgenson et al., 2008 ), while the monthly mean temperature of the study site varied from –19.3 °C to 14.6 °C, according to the U.S. Climate Data. The experimental study was conducted during the middle weeks of August, when the average high and low temperatures were 13.3 °C and 6.8 °C, respectively. The depth of the interface between the active layer and the permafrost was mainly affected by the regional latitude and temperature. Note that the study site was covered with vegetation, and a puddle was located near the test location, as shown in Figure 3. As vegetation acts as an insulator, the thickness of the active layer is expected to be less than the thickness of the active layer exposed to the air and the puddle; it is expected that the puddle is part of a stream that flows during the melting season and acts as an accelerant of the heat exchange (Price, 1971; Hinzman et al., 1991 ; Romanovsky and Osterkamp, 1995; Guglielmin et al., 2008 ).

|
| Figure 3 Site description for the experimental study |
The GPR survey was conducted on the surface of the active layer, using a control unit (SIR-3000) and a 400-MHz shielded antenna (50400S) manufactured by Geophysical Survey Systems, Inc. (GSSI), along the survey line at a distance of 1,000 mm (see Figure 4). During the GPR survey, the electromagnetic waves were gathered with a range of 40 ns in to obtain the travel time of the electromagnetic wave reflected at the interface, and the survey distances were recorded using a wheel distance encoder. For the evaluation of the active layer thickness, the DCP tests were conducted at the survey distances of 500 mm (DCP Point-1) and 1,000 mm (DCP Point-2), as shown in Figure 4. In addition, ground temperatures were measured at the depths of 0, 100, 200, 300, 500, and 700 mm in a borehole adjacent to DCP Point-1 and DCP Point-2, as shown in Figure 4.

|
| Figure 4 Experimental setup |
From the result of the GPR survey, a temporal-scaled GPR image was obtained, as shown in Figure 5a. At the travel time of 3.5 ns, a strong reflection was detected from the ground surface. Another strong reflection was then detected from 22 ns to 27.5 ns, which is expected to be the reflection at the interface between the active layer and the permafrost.

|
| Figure 5 Experimental results of ground-penetrating radar survey: (a) GPR image; (b) GPR signal at Point-1; (c) GPR signal at Point-2. ∆t denotes the travel time of the electromagnetic wave in the active layer |
GPR signals at DCP Point-1 and DCP Point-2 were extracted, as shown in Figure 5b and Figure 5c, respectively. Both signals showed the first strong reflections at the travel time of 3.5 ns, which corresponded to the interface between the ground surface and the bottom of the antenna. The second group of strong reflections was detected for DCP Point-1 and DCP Point-2 at the travel times of 23 ns and 27.5 ns, respectively, which could correspond to the interface between the active layer and the permafrost. Therefore, the travel time of the electromagnetic wave in the active layer can be calculated as 19.5 ns and 24 ns for DCP Point-1 and DCP Point-2, respectively.
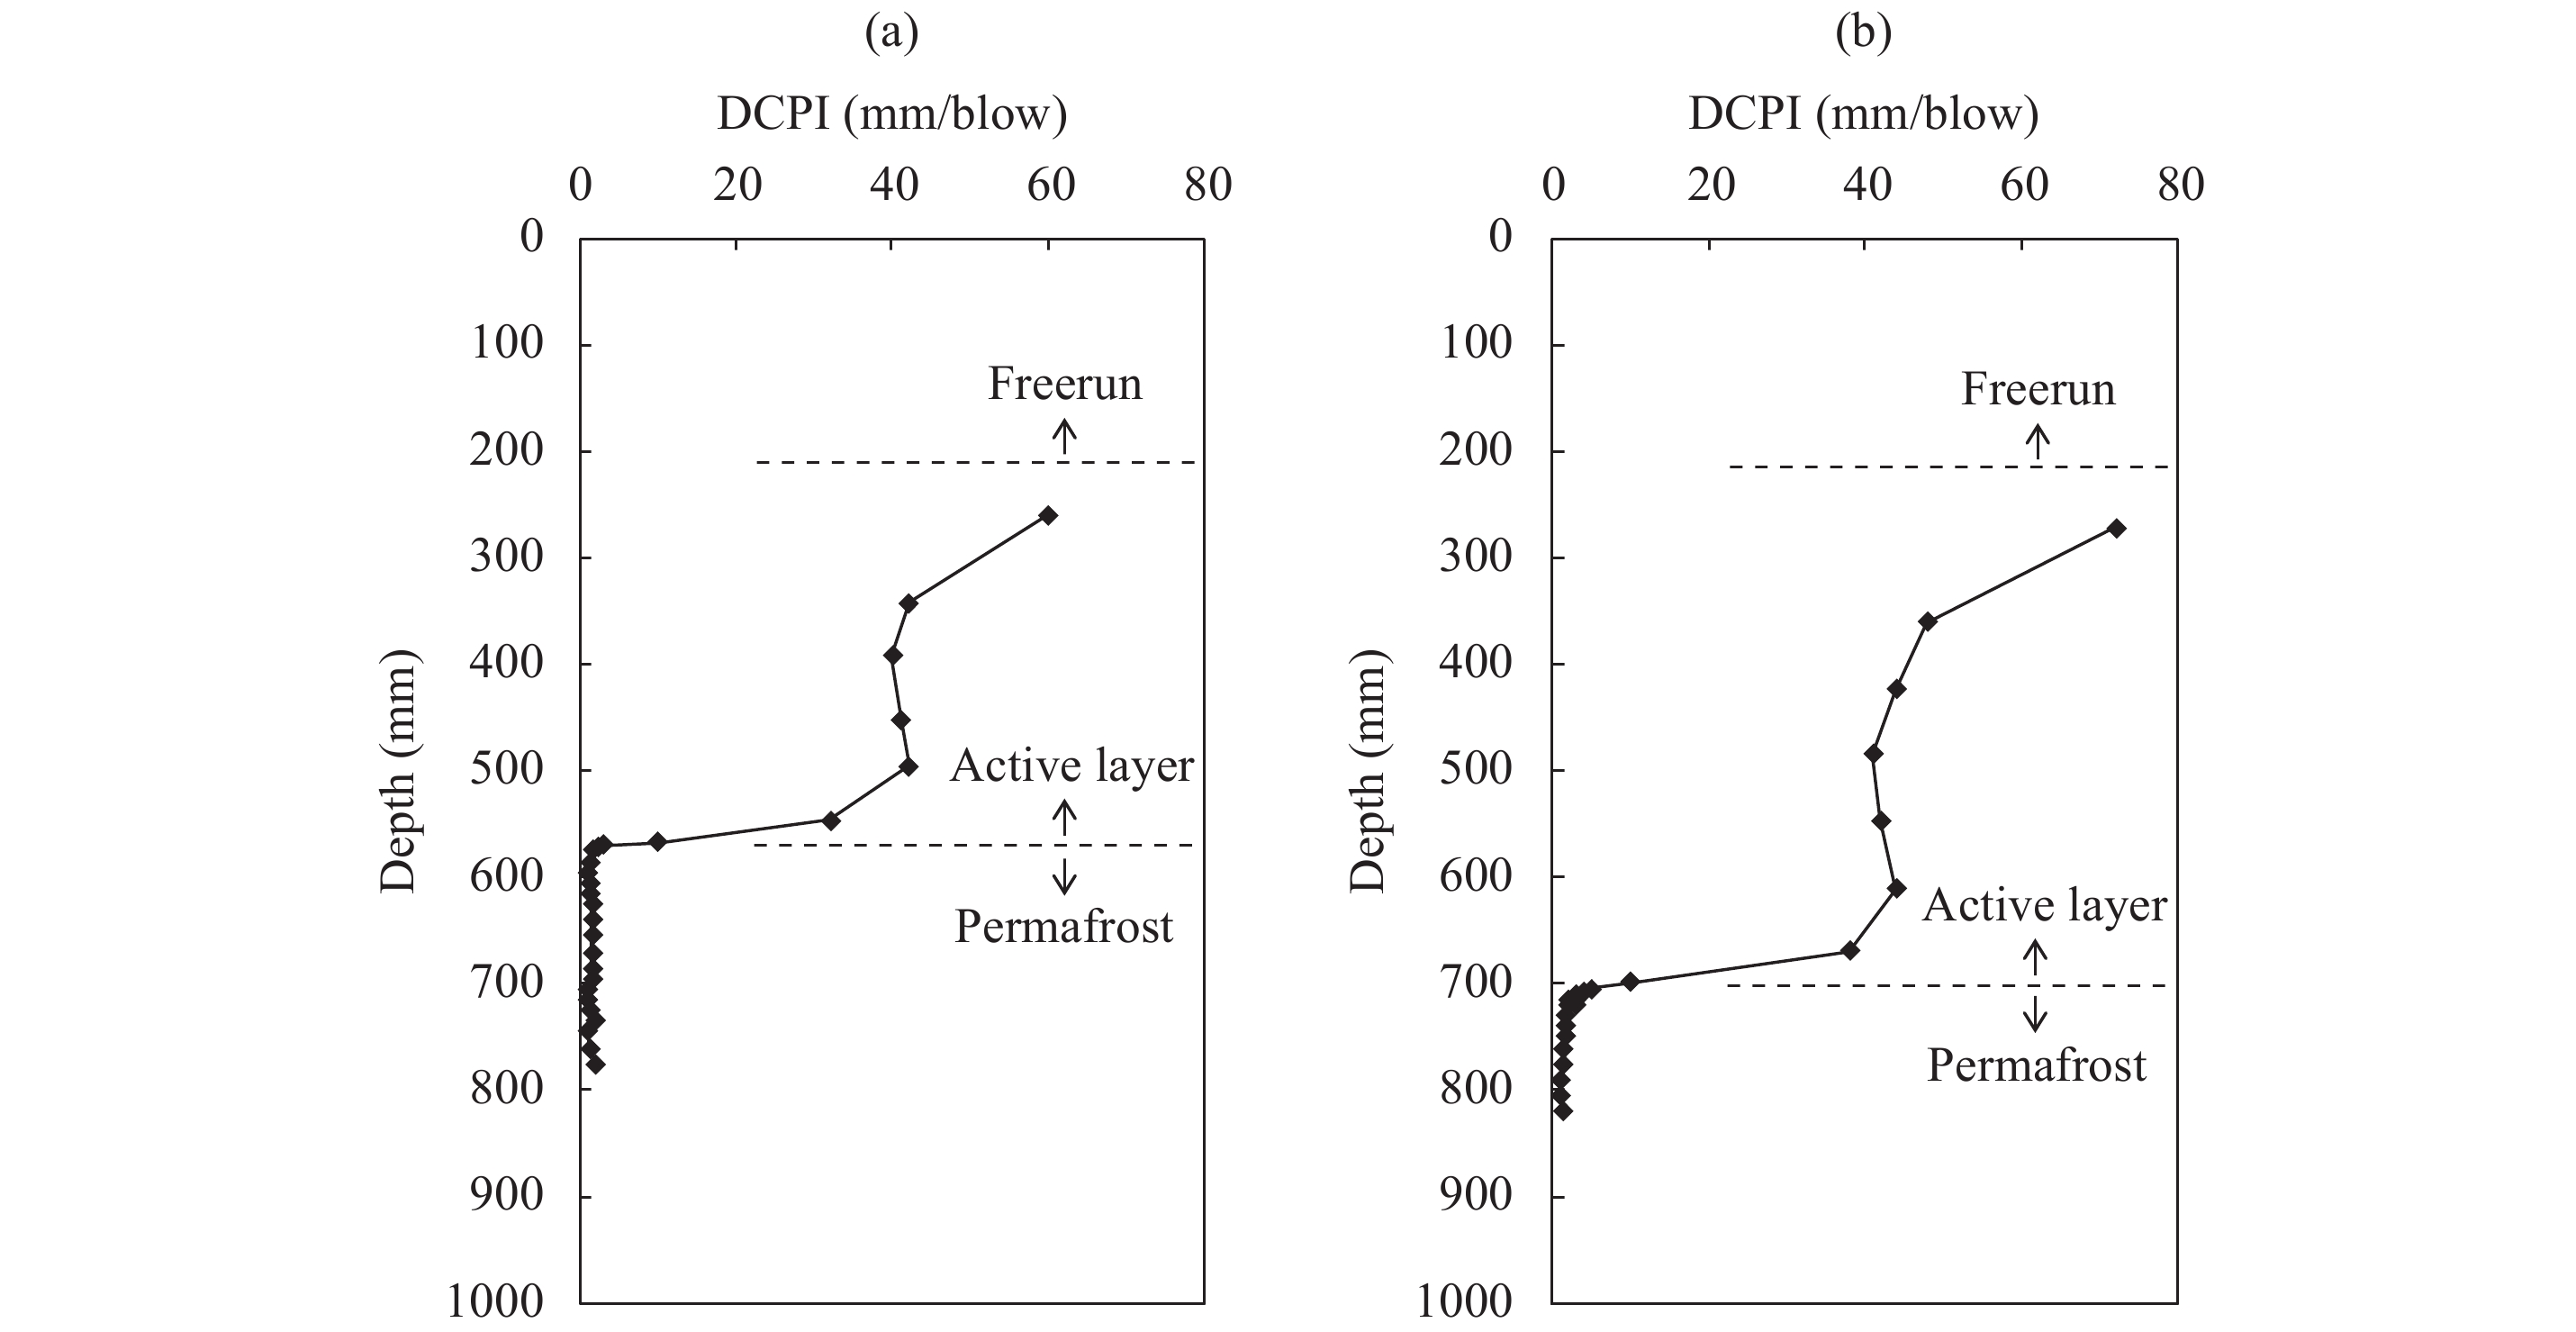
5.2 Dynamic cone penetration testAt DCP Point-1 and DCP Point-2, dynamic cone penetration tests were conducted; and DCPI was profiled along the penetration depth, as shown in Figures 6a and 6b. Near the surface of DCP Point-1, the DCP was penetrated by the self-weight (freerun) to the depth of about 200 mm; and the DCPI was then measured to be about 60 mm/blow, which showed a value larger than the overall trend due to the effect of low confining stress. The DCPI was approximately 40 mm/blow from the depth of 300~500 mm. At the depth of 570 mm, DCPI dramatically decreased and converged to 1~2 mm/blow below the depth of 570 mm.

|
| Figure 6 Experimental results of dynamic cone penetration tests. (a) Point-1; (b) Point-2 |
In the case of DCP Point-2, the DCPI could not be measured near the surface because of the freerun of the DCP and was greater than 60 mm/blow to the depth of 300 mm because of the low confining stress. At the depth of 300~600 mm, DCPI was approximately 40 mm/blow; and the DCPI significantly decreased and converged to 1~2 mm/blow at the depth of 700 mm. The ground temperatures measured at the depths of 500 and 700 mm were 0.2 °C and –0.2 °C, respectively. Therefore, the interface depth between the active layer and the permafrost is considered to be located between the depths of 500 mm and 700 mm. Accordingly, the layer with DCPI of 1~2 mm/blow is considered to be the permafrost. Thus, the thicknesses of the active layer at DCP Point-1 and DCP Point-2 can be determined as 570 mm and 700 mm, respectively.
5.3 Volumetric water contentFrom the result of the GPR survey, the travel times of the electromagnetic wave in the active layer at DCP Point-1 and DCP Point-2 were determined as 19.5 ns and 24 ns, respectively. In addition, the thicknesses of the active layer at DCP Point-1 and DCP Point-2 were determined as 570 mm and 700 mm, respectively, according to the DCP tests and ground-temperature measurements. Thus, the travel distances of the electromagnetic wave at DCP Point-1 and DCP Point-2 were 1,140 mm and 1,400 mm, respectively. By using the relationship between the dielectric constant, travel time, and travel distance of the electromagnetic wave in the active layer, and the velocity of the electromagnetic wave in a vacuum, as described in Equation (1), the dielectric constants at DCP Point-1 and DCP Point-2 were calculated as 26.3 and 26.4, respectively.
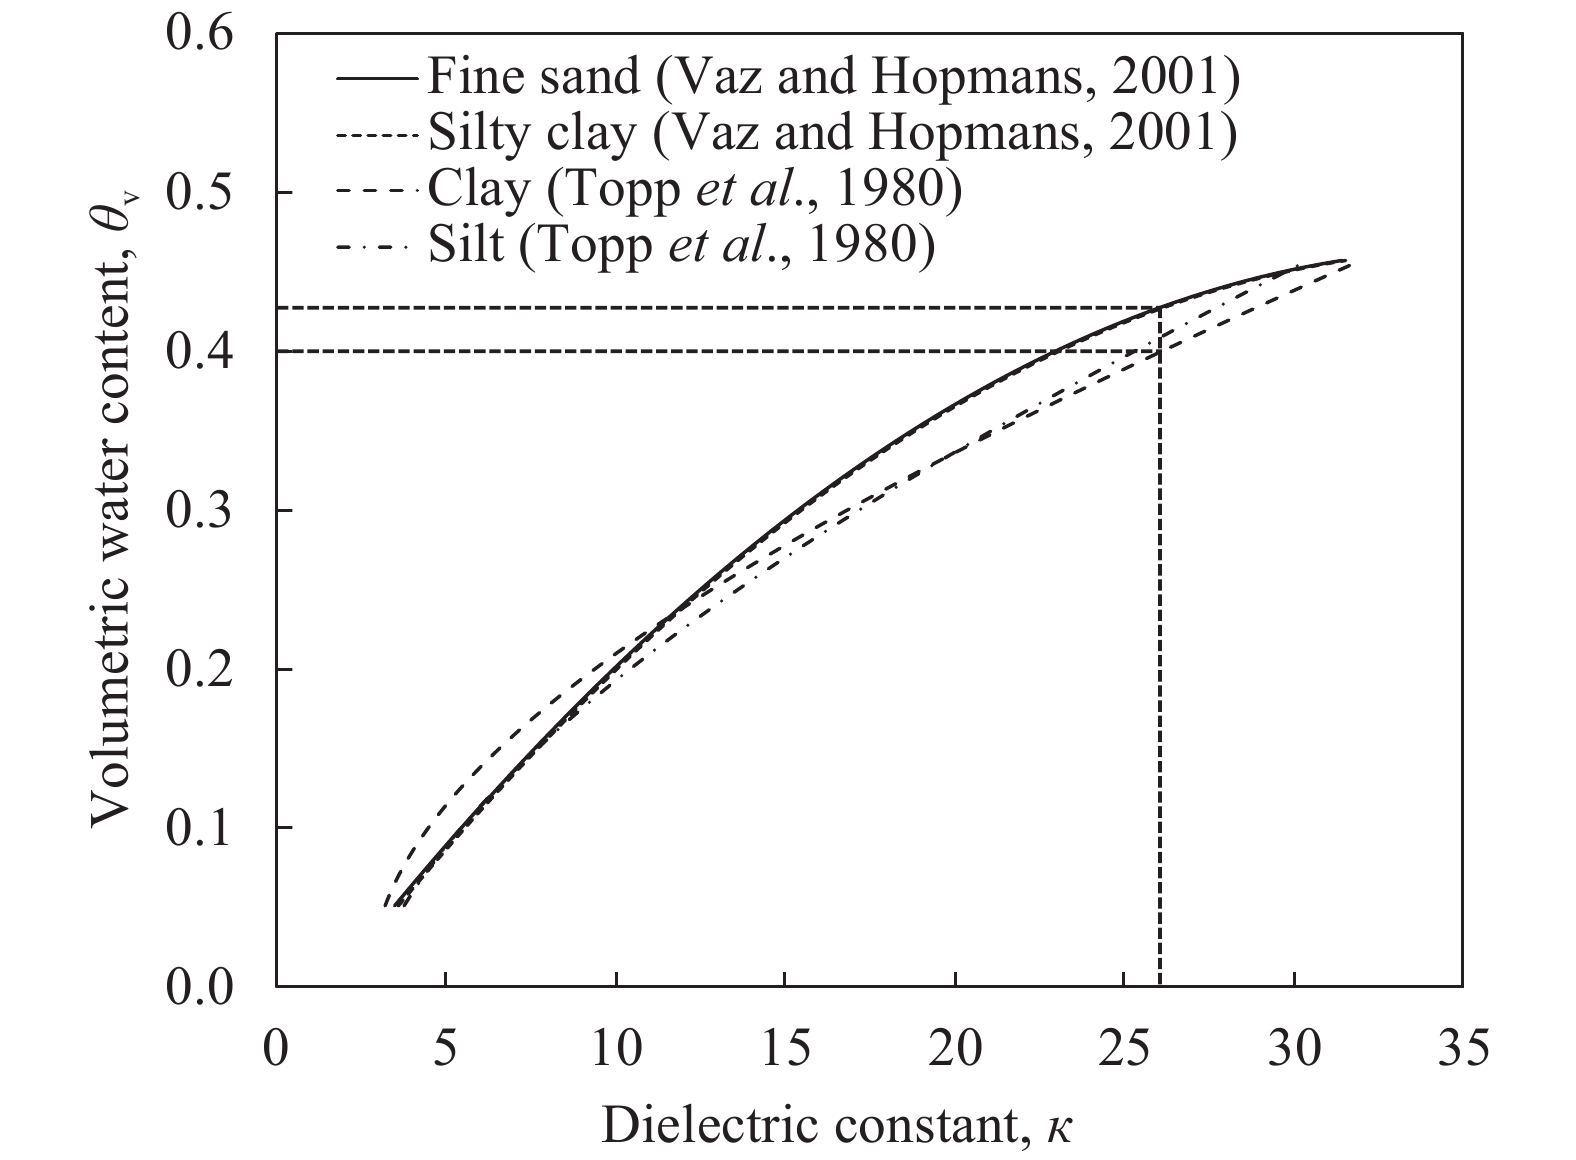
Topp et al. (1980) and Vaz and Hopmans (2001) suggested the relationships between the dielectric constant and the volumetric water content according to soil types, as plotted in Figure 7. From these relationships and the mean dielectric constant, the volumetric water content of the active layer can be estimated as 40% to 43%. The estimated volumetric water content shows a significantly large value because the active layer has undergone annual cyclic freezing and thawing. The cyclic freezing and thawing produces a very loose state and a large void in the active layer, with the large voids possibly filled with groundwater.

|
| Figure 7 Estimated volumetric water content by dielectric constant |
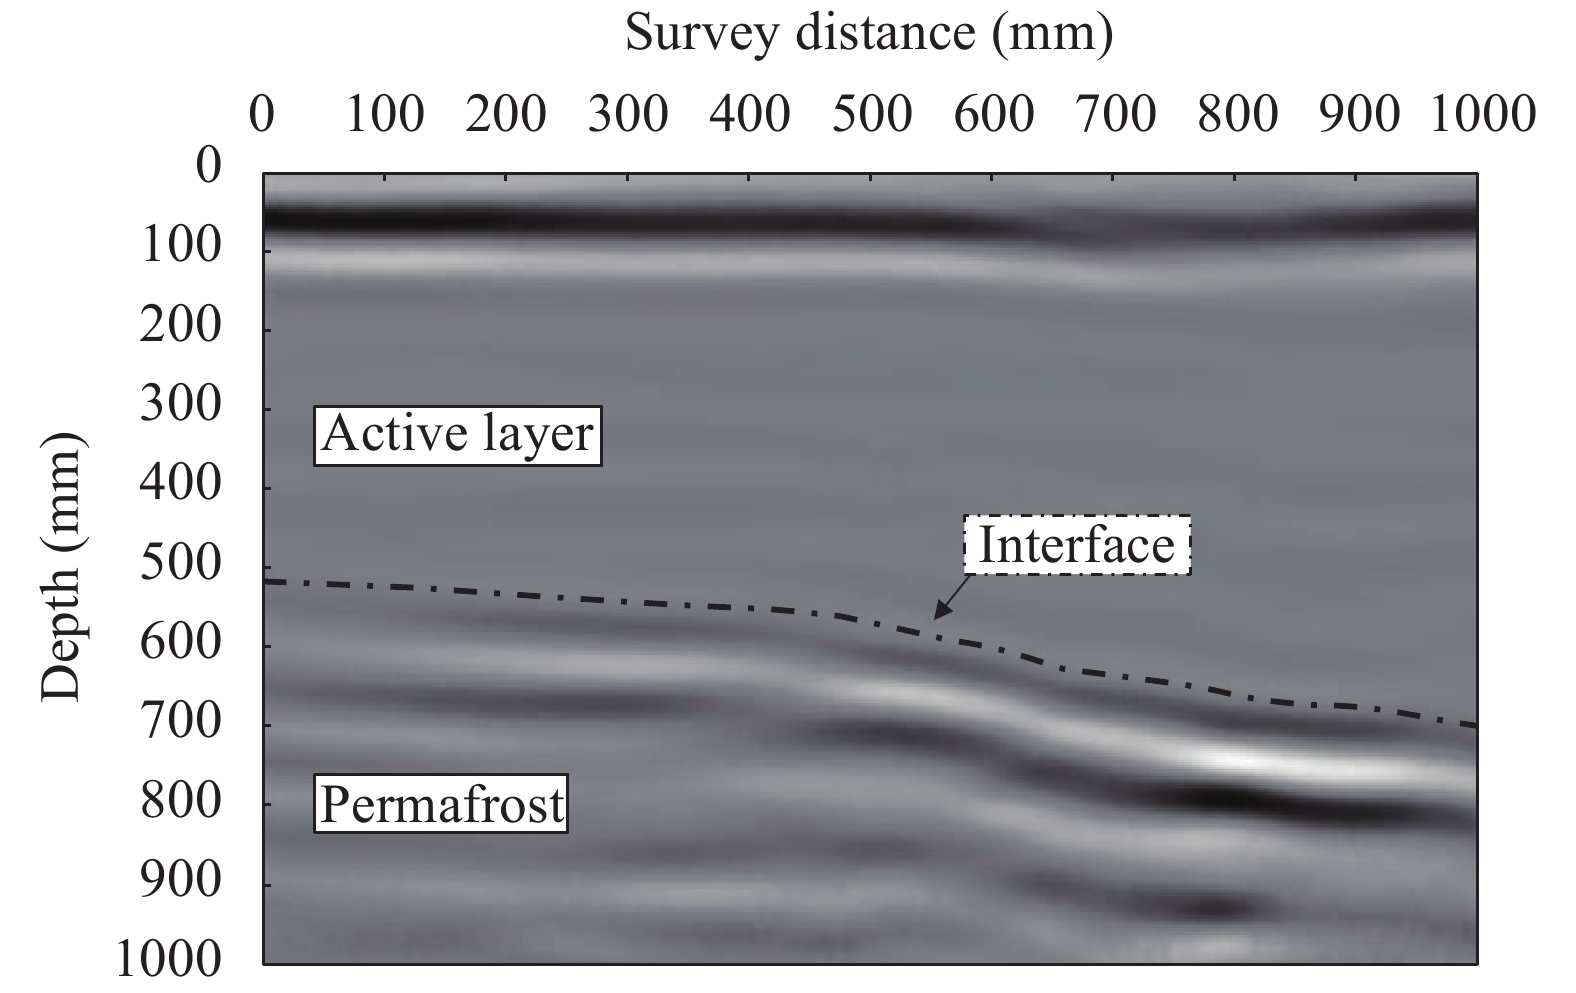
For the evaluation of the interface depth between the active layer and the permafrost along the GPR survey line, the travel time of 3.5 ns is adjusted to 0 ns in the temporal-scaled GPR image (Figure 5a), which denotes the reflection time at the ground surface. In addition, by using Equation (1) and the mean dielectric constant of the DCP Point-1 and DCP Point-2 (26.35), the temporal-scaled GPR image is converted to the spatial-scaled GPR image, as shown in Figure 8. The thickness of the active layer varies from 520 mm to 700 mm along the survey line.

|
| Figure 8 GPR image in the spatial scale |
A puddle located on the surface of the active layer near DCP Point-2 (see Figures 3 and 4) is assumed to be part of a stream that flows during the melting season and to act as an accelerant of the heat exchange. The thickness of the active layer in the extremely cold region is affected not only by the latitude and the temperature of the region but also by the distribution of the vegetation and the local surface water flow on the active layer. Thus, the thickness of the active layer can vary even over a small area, depending on environmental conditions. Therefore, the GPR survey could be an effective method for evaluating the distribution and the thickness of the active layer because GPR produces continual cross-sectional images along the survey line.
6 Summary and conclusionsGround-penetrating radar (GPR) and a dynamic cone penetrometer (DCP) were applied for the evaluation of the dielectric constant; this evaluation was then used to estimate the volumetric water content and the thickness of the active layer. As a study site, a field located in Midwest Alaska was selected; and the experimental study was conducted during the middle weeks of August. A GPR survey was conducted on the surface of the ground, with a survey length of 1,000 mm; the travel times of the electromagnetic wave in the active layer were then obtained. At the survey distances of 500 mm and 1,000, two DCP tests (DCP Point-1 and DCP Point-2) were conducted; and the DCPI profiles were obtained along the penetration depth. In addition, by measuring the ground temperature, the interface depths between the active layer and the permafrost were determined.
The experimental results of the DCP tests show that the DCPIs were about 40 mm/blow in the active layer and 1~2 mm/blow in the permafrost. Accordingly, the thickness of the active layer at DCP Point-1 and DCP Point-2 was determined as 570 and 700 mm, respectively. From the travel times of the electromagnetic wave obtained by the GPR survey and the thicknesses of the active layer, dielectric constants at DCP Point-1 and DCP Point-2 were calculated as 26.3 and 26.4, respectively. In addition, by using the relationship between the dielectric constant and the volumetric water content of the soils, the volumetric water content of the active layer is estimated to be 40%~43%. Furthermore, by applying the mean dielectric constant in the active layer to the temporal-scaled GPR image, the spatial-scaled GPR image is obtained; and the GPR image shows that the thickness of the active layer varies from 520 mm to 700 mm, even at a small survey distance of 1,000 mm, due to the puddle located near DCP Point-2. This study demonstrates that the evaluation of the dielectric constant using the GPR survey and the DCP test can be effectively used for estimating the thickness and volumetric water content of the active layer.
Acknowledgments:This work was supported by the National Research Council of Science & Technology (NST) grant by the Korean government (MSIP) (No. CRC-14-02-ETRI).
| Al-Qadi IL, Lahouar S, 2005. Measuring layer thicknesses with GPR-Theory to practice. Construction and Building Materials, 19(10): 763–772. DOI: 10.1016/j.conbuildmat.2005.06.005 |
| ASTM D6432, 2011. Standard Guide for Using the Surface Ground Penetrating Radar Method for Subsurface Investigation. Annual Book of ASTM Standard 04.09, ASTM International, West Conshohocken, PA. |
| ASTM D6565, 2005. Standard Test Method for Determination of Water (Moisture) Content of Soil by the Time-Domain Reflectometry (TDR) Method (Withdrawn 2014). Annual Book of ASTM Standard, ASTM International, West Conshohocken, PA. |
| ASTM D6951, 2009. Standard Test Method for Use of the Dynamic Cone Penetrometer in Shallow Pavement Applications. Annual Book of ASTM Standard 04.03, ASTM International, West Conshohocken, PA. |
| Bronfenbrener L, Bronfenbrener R, 2010. Modeling frost heave in freezing soils. Cold Regions Science and Technology, 61(1): 43–64. DOI: 10.1016/j.coldregions.2009.12.007 |
| Byun YH, Hong WT, Lee JS, 2015. Characterization of railway substructure using a hybrid cone penetrometer. Smart Structures and Systems, 15(4): 1085–1101. DOI: 10.12989/sss.2015.15.4.1085 |
| Byun YH, Lee JS, 2013. Instrumented dynamic cone penetrometer corrected with transferred energy into a cone tip: A laboratory study. Geotechnical Testing Journal, 36(4): 533–542. DOI: 10.1520/GTJ20120115 |
| Byun YH, Yoon HK, Kim YS, et al, 2014. Active layer characterization by instrumented dynamic cone penetrometer in Ny-Alesund, Svalbard. Cold Regions Science and Technology, 104: 45–53. DOI: 10.1016/j.coldregions.2014.04.003 |
| Guglielmin M, Evans CJE, Cannone N, 2008. Active layer thermal regime under different vegetation conditions in permafrost areas. A case study at Signy Island (Maritime Antarctica). Geoderma, 144(1–2): 73–85. DOI: 10.1016/j.geoderma.2007.10.010 |
| Hermansson Å, Guthrie WS, 2005. Frost heave and water uptake rates in silty soil subject to variable water table height during freezing. Cold Regions Science and Technology, 43(3): 128–139. DOI: 10.1016/j.coldregions.2005.03.003 |
| Hinzman LD, Kane DL, Gieck RE, et al, 1991. Hydrologic and thermal properties of the active layer in the Alaskan Arctic. Cold Regions Science and Technology, 19(2): 95–110. DOI: 10.1016/0165-232X(91)90001-W |
| Hong WT, Byun YH, Kim SY, et al., 2016. Cone penetrometer incorporated with dynamic cone penetration method for investigation of track substructures. Smart Structures and Systems, 18(2): 197–216. DOI: http://dx.doi.org/10.12989/sss.2016.18.2.197. |
| Jorgenson MT, Yoshikawa K, Kanevskiy M, et al., 2008. Permafrost characteristics of Alaska. In: Proceedings of the Ninth International Conference on Permafrost. University of Alaska: Fairbanks, 29: 121–122. |
| Kim K, Zhou W, Huang SL, 2008. Frost heave predictions of buried chilled gas pipelines with the effect of permafrost. Cold Regions Science and Technology, 53(3): 382–396. DOI: 10.1016/j.coldregions.2008.01.002 |
| Michalowski RL, Zhu M, 2006. Frost heave modelling using porosity rate function. International Journal for Numerical and Analytical Methods in Geomechanics, 30(8): 703–722. DOI: 10.1002/nag.497 |
| Price LW, 1971. Vegetation, microtopography, and depth of active layer on different exposures in subarctic alpine tundra. Ecology, 52(4): 638–647. DOI: 10.2307/1934152 |
| Ren T, Noborio K, Horton R, 1999. Measuring soil water content, electrical conductivity, and thermal properties with a thermo-time domain reflectometry probe. Soil Science Society of America Journal, 63(3): 450–457. DOI: 10.2136/sssaj1999.03615995006300030005x |
| Romanovsky VE, Osterkamp TE, 1995. Interannual variations of the thermal regime of the active layer and near-surface permafrost in northern Alaska. Permafrost and Periglacial Processes, 6(4): 313–335. DOI: 10.1002/ppp.3430060404 |
| Scala AJ, 1956. Simple methods of flexible pavement design using cone penetrometers. New Zealand Engineering, 11(2): 34. |
| Seppala M, 1999. Geomorphological aspects of road construction in a cold environment, Finland. Geomorphology, 31(1–4): 65–91. DOI: 10.1016/S0169-555X(99)00073-2 |
| Topp GC, Davis J L, Annan AP, 1980. Electromagnetic determination of soil water content: Measurements in coaxial transmission lines. Water Resources Research, 16(3): 574–582. DOI: 10.1029/WR016i003p00574 |
| U. S. Army and Air force, 1983. Arctic and subarctic construction foundation for structures. Department of The Army and The Air Force, pp. 1–7. |
| Vaz CMP, Hopmans JW, 2001. Simultaneous measurement of soil penetration resistance and water content with a combined penetrometer-TDR moisture probe. Soil Science Society of America Journal, 65(1): 4–12. DOI: 10.2136/sssaj2001.6514 |
 2017, 9


