 2017, 9
Article Information
- YuZhong Yang, QingBai Wu, HuiJun Jin, Peng Zhang. 2017.
- δ18O, δD and d-excess signatures of ground ice in permafrost in the Beiluhe Basin on the Qinghai-Tibet Plateau, China
- Sciences in Cold and Arid Regions, 9(1): 38-45
- http://dx.doi.org/10.3724/SP.J.1226.2017.00038
Article History
- Received: June 18, 2016
- Accepted: October 16, 2016


In recent decades, the Qinghai-Tibet Plateau (QTP) has received unprecedented attention because of increasing engineering activities and climatic warming induced permafrost degradation (Wu and Zhang, 2008). As the unique aspect of permafrost, ground ice presented great reserves in permafrost on the QTP (Zhao et al., 2010). This kind of ground ice can range from a variety of or igins. Under a warming climate, the ice-rich and ice-saturated permafrost suffered gradual degradation which made the ice melt, accelerating the expansion of thermokarst lakes and formation of new lakes (Niu et al., 2011). This, further exacerbated the degradation of permafrost, and strongly influenced the hydrological process and allocation of water sources (Liljedahl et al., 2016). Evaluation of types and volumes of ground ice in the upper permafrost of the QTP is important for engineering and environmental evaluations and is essential for quantification of carbon and sediments fluxes into the catchment and to understanding the response of permafrost terrain to climate change.
Previous studies have employed the stable isotopic method to elucidate the origin of ground ice and freezing conditions (Fritz et al., 2011; Lacelle et al., 2013), to reconstruct paleoclimatic conditions (Streletskaya et al., 2011; Meyer et al., 2015), to determine the permafrost history (Yoshikawa et al., 2013; Lacelle et al., 2014), and to trace the permafrost hydrological processes (Jessen et al., 2014; Streletskiy et al., 2015). Considering the significant influences of ground ice on the hydroclimate and the important position of QTP in China, research on the ground ice on QTP is essential. However, ground ice studies on the QTP have been extremely scarce. Yang et al. (2013) conducted the first isotopic study of ground ice in the hinterland of the QTP, and subsequently discussed the growth patterns and origin of ground ice in Kunlun Mountain Pass on the QTP (Yang et al., 2016a). These early works are a good foundation for this study.
In this study, a deep borehole was completed in 2012 in Beiluhe Basin (BLB) which is a typical alpine region with well enriched high ice-content permafrost. We used δ18O, δD and d-excess to identify the replenishment water and possible freezing conditions of ground ice in different sections.
2 Data and methods 2.1 Study areaThe BLB, located in the hinterland of QTP, is a typical alpine region (Figure 1; Table 1) with an elevation of 4, 600 m a.s.l.. In this region, mean annual air temperature can be as low as -3.88 ℃. Most precipitation is concentrated in summer between April and September, making up 92% of the total. Mean annual precipitation is 368 mm. The westerlies are prevailing throughout the year, with a higher wind speed in cold seasons than in warm seasons (Yang et al., 2016b).

|
| Figure 1 Study area and the drilling sites |
| Sampling sites | Year | Longitude | Latitude | Elevation (m) |
| Frozen soil station | - | 92°56'06.57"E | 34°49'44.92"N | 4, 642 |
| River-A | 2011-2012 | 92°55'45.40"E | 34°49'22.20"N | 4, 636 |
| River-B | 2011-2012 | 92°55'52.00"E | 34°49'33.40"N | 4, 630 |
| TL-A | 2011-2012 | 92°55'41.40"E | 34°49'35.60"N | 4, 636 |
| TL-B | 2011-2012 | 92°55'37.80"E | 34°49'36.28"N | 4, 636 |
| ZK-1 | 2011 | 92°53'58.49"E | 34°50'02.96"N | 4, 691 |
| ZK-2 | 2011 | 92°53'43.88"E | 34°49'36.49"N | 4, 665 |
| ZK-3 | 2011 | 92°53'39.24"E | 34°49'26.95"N | 4, 677 |
| ZK-4 | 2011 | 92°53'36.41"E | 34°49'20.99"N | 4, 667 |
| DZK | 2012 | 92°55'44.30"E | 34°49'22.40"N | 4, 632 |
The BLB is predominantly enriched in high ice-content permafrost (Niu et al., 2002). According to field investigation, ground ice is well developed, most of which is distributed below 1 m underground (Table 2; Zhao et al., 2010). Mean annual ground temperature ranges from -1.8 to -0.5 ℃, the permafrost thickness ranges from 20 to 80 m, and the active layer varies in thickness from 1.61 to 3.38 m (Wu et al., 2015).
| Site name | Vertical sections | Percentages (%) of different permafrost types | ||||
| Ice-less permafrost | Ice-medium permafrost | Ice-rich permafrost | Ice-saturated permafrost | Ice layer with soil | ||
| Beiluhe Basin | Within 1 m below PT* | 7.2 | 24.3 | 6.3 | 46.4 | 14.0 |
| 1~10 m below PT* | 38.9 | 42.5 | 12.3 | 4.5 | 0.0 | |
| Deep than 10 m | 39.8 | 43.4 | 12.3 | 2.7 | 0.0 | |
In this study, we selected DZK in BLB established in August 2012 for the stable isotopic studies (Figure 1). Frozen soil cores were extracted from different depths using a mechanical drilling rig. A total of 27 visible ground ice samples were obtained in different depths between 0 and 20.55 m. Disposable PE gloves were used during each sampling process. The outer layer of each ice sample was chipped off to avoid contamination in the borehole. Ground ice samples were preserved in PE bottles and kept frozen. Additionally, ground ice data (Yang et al., 2013) from four other boreholes (ZK-1, ZK-2, ZK-3, and ZK-4) in BLB were used for comparison. A total of 73 ice samples were used in this study: 28 for ZK-1 between 12 and 18 m, 15 for ZK-2 from 3 to 8 m, 13 for ZK-3 between 3 and 13 m, and 17 for ZK-4 from 3 to 6 m, respectively.
Stable isotopes (δ18O, δD) of ground ice sample were analyzed at the State Key Laboratory of Frozen Soil Engineering, Cold and Arid Regions Environmental and Engineering Research Institute, Chinese Academy of Sciences, China. Ice samples were thawed at room temperature, filtered through 0.22-μm disposable membrane filters to remove impurities, and then analyzed using an Isotopic Liquid Water Analyzer (Picarro L1102-i, U.S.) with the wavelength-scanned cavity ring down spectroscopy technique. The stable isotope contents were expressed in delta per mil notation (δ, ‰) relative to the Vienna Standard Mean Ocean Water standard (VSMOW). The analytical error was less than 0.1‰ and 0.3‰ for δ18O and δD.
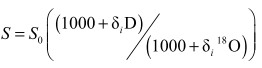
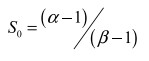
2.3 Calculation of the theoretical freezing slopeThe theoretical freezing slope was estimated using the following equation (Jouzel and Souchez, 1982):
|
(1) |
|
(2) |
here, δi18O and δiD of the source water were estimated as the intersection between the observed freezing line and the local meteoric water line (LMWL) (Jouzel and Souchez, 1982; Souchez et al., 2000). The parameters α(1.0212) and β(1.00291) are the equilibrium fractionation coefficients for D and 18O (Lehmann and Siegenthaler, 1991).
3 ResultsGenerally, the δ18O ranges from -12.3‰ to -8.3‰, δD ranges between -91.8‰ and -66.4‰, and d-excess varies from -2.6‰ to 8.0‰, with the mean values of -10.8‰, -85.1‰ and 1.3‰, respectively. The profile of ground ice can be isotopically divided into three sections (Figure 2):

|
| Figure 2 δ18O, δD and d-excess of ground ice vs. depths |
Section Ⅰ (from 2.5 to 5 m): Continuously lighter values of δ18O and δD, from -8.3‰ to -11.9‰ for δ18O and from -66.4‰ to -91.1‰ for δD (Figure 2). Contrarily, the values of d-excess are inclined to be more irregular and below zero, which are far less than that of global mean (Dansgaard, 1964), which is indicative of complex water source of ground ice.
Section Ⅱ (from 5 to 6 m): More negative values of δ18O and δD than those in Section Ⅰare evident (Figure 2) and the d-excess are nearly all positive. Totally, δ18O and δD tend to remain stable between -11.9‰ and -11.4‰ and between -91.7‰ to -89.4‰, and the d-excess curve reveals oppositely negative trend from 4.1‰ to 0.8‰.
Section Ⅲ (from 6 to 20.55 m):Only four ice samples were obtained in this section. The δ18O and δD values remained constant (Figure 2). The d-excess between 6.15 and 11.1 m are higher (with a mean value of 7.3‰), however, the ground ice at the depth of 20.55 m shows lower d-excess (1.6‰), which may suggest different source water and formation process of ground ice.
4 Discussion 4.1 Formation processes and initial water of ground ice in different depthsFigure 3 shows the δ18O-δD distributions of ground ice in DZK borehole. Evidently, compared with precipitation, the δ18O and δD values of ground ice varied in a narrow range and plotted distinctly to the upper right of LMWL which produce a linear regression line called freezing line (FL) (Figure 3). The intersection of FL with LMWL indicates the isotope composition of the initial replenished source water of ground ice prior freezing (Souchez et al., 2000). We calculated the intersections in this study: δ18O=-15.8‰, δD=-113.6‰, which is relatively negative and ranging between the weighted average values in summer precipitation (Wt. avg. SP) and winter precipitation (Wt. avg. WP) (Figure 3). This indicates a colder climate during ice formation (Nikolayev and Mikhalev, 1995). Also, we used the intersections to calculate theoretical freezing slope (Jouzel and Souchez, 1982). The calculated theoretical slope of 6.4 is larger than the experimental value (5.76), and is suggestive of complex origin and formation process of ground ice in different depths.

|
| Figure 3 δ18O-δD relations in ground ice, precipitation, river water and lake water |
Compared with precipitation, the d-excess values of ground ice are much lower (Figure 4) and are all plotted below global mean (Figure 4; Dansgaard, 1964). Overall, there is a negative correlation between d-excess and δD of ground ice (Figure 4) with a slope of -0.28 which is consistent with the calculation values from Lacelle (2011). If the near-surface ground ice is not considered, the negative relation between d-excess and δD is increased (with the R2 value increased from 0.37 to 0.46). Thus, the source water of near-surface and deep-layer ground ice is different although they all originated from freezing of liquid water. This is remarkably reflected from the variations in d-excess values.

|
| Figure 4 Variations in d-excess of ground ice and comparison with precipitation |
In order to clarify the formation conditions of ground ice in three sections, the attempt was conducted to investigate the δ18O-δD and d-δD relations in each section (Table 3):
| Water components | Year | Depth (m) | Slopes | Intercepts | R2 |
| Precipitation | 2011-2012 | - | 8.52 | 20.60 | 0.97 |
| River-A | 2011-2012 | - | 8.71 | 20.20 | 0.95 |
| River-B | 2011-2012 | - | 8.70 | 19.78 | 0.95 |
| ZK-1 | 2011 | 12.0~18.0 | 3.34 | -48.67 | 0.88 |
| ZK-2 | 2011 | 3.0~8.0 | 5.47 | -28.76 | 0.58 |
| ZK-3 | 2011 | 3.0~13.0 | 5.22 | -31.19 | 0.38 |
| ZK-4 | 2011 | 3.0~6.0 | 6.02 | -18.62 | 0.70 |
| DZK | 2012 | 2.5~20.6 | 5.76 | -22.87 | 0.92 |
In Section Ⅰ, the δ18O and δD of ground ice present significantly positive correlation with the slope of 6.39 and negative intersection (Table 3). The ground ice at 2.5 m is approaching the local evaporative line (LEL) of surface water with a negative value of d-excess. Given a comparison with the Wt. avg. SP (-12.4‰, -82.7‰), the isotopic value of ground ice at 2.5 m (-8.3‰, -66.4‰) is 4‰ and 16‰ higher for δ18O and δD, respectively. This result is well consistent with the isotopic fractionation deviation during freezing (Michel, 1982; Lacelle, 2011). However, the larger deviation of δ18O and the negative d-excess value may be attributed to evaporation of initial water. Thus, it can be inferred that the source water of ground ice at 2.5 m had surfaced evaporation before frozen into ice. If discarding of ground ice at 2.5 m, above positive relation between δ18O and δD had already existed, the slope is slightly lower (Table 3) and falls within the range of Lacelle's theoretical calculation results (Lacelle, 2011). The calculated value of initial water (δI) is -17.0‰ for δ18O and -124.3‰ for δD which is nearly the same with the weighted average value of winter precipitation in BLB (Yang et al., 2016a). A strongly negative correlation generated between d-excess and δD between 3 and 4.2 m (Table 3) which is close to theoretical values range (Lacelle, 2011). This is suggestive of ice formed by freezing of liquid water (Lacelle, 2011). Thus, combining the δ18O-δD analysis, it can be concluded that ground ice in these depths is mainly recharged by the infiltration of snowmelt. The drilling site located at an alpine meadow region which is beneficial for retaining the snow in the first year which melted in the warm season of the preceding year, permeated into the active layer, and refrozen in the cold season. During gradual freezing, the active-layer water (supra-permafrost water) above the permafrost table likely then migrated downward toward subzero ground temperatures, subsequently forming segregated ice. Similarly, the heavier isotopes (δ18O, δD) became progressively depleted and accompanied by a concurrent increase in d-excess values during ground-ice formation.
In Section Ⅱ, the relation between δ18O and δD shows nearly stable state, the slope is much lower than that in Section Ⅰ (Table 3), which neither belongs to typical characteristics of liquid water freezing (Lacelle, 2011) nor indicates origin of vapor-condensation (Lacelle et al., 2013), but it is similar to the LEL of summer river water at Kunlun Mountain Pass on QTP (Yang et al., 2016b). The δI values (-13.5‰, -94.3‰) are estimated using the Jouzel and Souchez's method (Jouzel and Souchez, 1982), which is slightly negative than that of weighted average value of annual precipitation. The correlation coefficient of d-δD approaches zero which is similar to the characteristics of precipitation (Lacelle, 2011). However, the lack of other evidence does not indicate the recharge feature of ground ice. The formation mechanism of ice in this section should be related to the regional paleoclimate, the isotopic composition of initial waters.
In Section Ⅲ, the slope of δ18O and δD is lower which is comparable with that of ground ice in ZK-1 in 2011 (Table 4; Yang et al., 2013). But if discarding of the value of ground ice at 20.55 m, the correlation between δ18O and δD enhanced significantly. The slope reveals obviously higher value which is similar to the slope of LMWL on QTP, the intercept is much higher. This is suggestive of different moisture source of ground ice at the depth of 20.55 m. The d-excess is more positive than the other two sections. After only considering the correlation between 6 and 11.1 m, a significantly positive correlation is presented. Obviously, the ground ice at 20.55 m influenced the correlations both in δ18O-δD and d-δD. It can be inferred that there is distinct differences in replenishment water between 6~11.1 m and 20.55 m. Evidently, the isotope values between 6 and 11.1 m are located very close to the Wt. avg. SP in BLB (Figure 3). This shows higher d-excess values which are close to the global means of precipitation (Figure 4). Therefore, we infer that isotopic signatures of ground ice between 6 and 11.1 m reflected the replenishment of summer precipitation during ice formation period. Quick freezing action well preserved the precipitation messages.
| Items | Depth (m) | δ18O-δD | d-δD | |||||
| Slope | Intercept | R2 | Slope | Intercept | R2 | |||
| Whole cores | 2.5~20.6 | 5.76 | -22.87 | 0.92 | -0.28 | -22.65 | 0.37 | |
| 3.0~20.6 | 5.26 | -28.46 | 0.92 | -0.39 | -32.25 | 0.46 | ||
| Section Ⅰ | 2.5~4.2 | 7.06 | -10.08 | 0.95 | -0.08 | -6.82 | 0.09 | |
| 3.0~4.2 | 6.18 | -19.20 | 0.93 | -0.21 | -17.62 | 0.29 | ||
| Section Ⅱ | 4.2~6.0 | 1.88 | -68.93 | 0.26 | -0.10 | -6.30 | 0.002 | |
| Section Ⅲ | 6.0~20.6 | 2.89 | -54.78 | 0.31 | 0.13 | 17.20 | 0.01 | |
| 6.0~11.1 | 11.03 | 43.91 | 0.99 | 0.28 | 32.10 | 0.98 | ||
In order to clarify the variations in stable isotopes of ground ice and their source water, LMWL, LEL of river water and FL of ground ice in 2011 (Yang et al., 2013a) and 2012 (this study) were determined and compared (Figure 3; Table 3). Obviously, the slopes of freezing lines of ground ice in both years are much lower (3~7) than those of precipitation and river water (Figure 3; Table 3) and the intercepts are all negative values, which reflected the different moisture source and the fractionation effect of freezing process (Lacelle, 2011; Yoshikawa et al., 2013).
The source water and freezing processes during formation of ground ice were complicated. The near-surface ground ice was significantly influenced by precipitation, active-layer water, vapor close to ground, and surface water. However, deep-layer ground ice had totally different origins other than near-surface ground ice, which was controlled by the initial replenishment water, and climatic conditions during ice formation (Lacelle, 2011).
4.2 Differences in stable isotopes of ground ice in different boreholes in the BLBDue to the differences in freezing conditions, lithological diversities, initial source water, and water contents, the freezing lines of ground ice in the five different boreholes in BLB were different (Table 4). The ground ice in ZK-1 has the lowest slope which may be indicative of higher freezing rate during ice formation in a closed-system (Yang et al., 2013; Yoshikawa et al., 2013). The ground ice of ZK-2 and DZK had similar slopes and intercepts (Table 4), which should be suggestive of similar formation conditions and source water. According to field observations, the two boreholes were covered by alpine meadow, two thermokarst lakes were situated next to ZK-2 and DZK (about 100 m) which provided suitable thermal conditions, also ground ice grew in similar depths (between 3 and 7 m). It can be concluded that they had analogical freezing conditions and initial water.
Subsequently, the stable isotopes of ground ice in the DZK were analyzed and compared with the other four boreholes in 2011 (Figure 5). Obviously, the δ18O and δD values of near-surface ground ice were more positive than those of deep-layer ground ice in five boreholes, pointing to absolutely different replenishment waters from the deep-layer ground ice. The near-surface ground ice may be fed by water with heavier stable isotopic values or suffered from evaporation before freezing; however, the deep-layer ground ice was recharged by water characterized by negative isotopic values.

|
| Figure 5 Comparison of stable isotopes in ground ice at BLB in different boreholes |
1) Isotopic contents of ground ice at DZK vary from -12.3‰ to -8.3‰ for δ18O, between -91.8‰ and -66.4‰ for δD, which are concentrated into a tight cluster compared with precipitation and surface water. The d-excess varies from -2.6‰ to 8.0‰, it is well below the global mean value (10‰) and the BLB precipitation means value. δ18O and δD values of near-surface ground ice were more positive than those of deep-layer ground ice.
2) The isotopic profile of ground ice was divided into three sections: the near-surface ground ice at 2.5 m is frozen by the active-layer water which suffered evaporation. Ground ice between 3 and 4.2 m is mainly recharged by the infiltration of snowmelt which experienced isotopic Rayleigh-type fractionation. From 5 to 6 m, the ground ice showed complex origin and formation processes. Ground ice from 6 to 11.1 m showed significantly positive correlations for δ18O-δD and d-δD, which indicated complex origin and ice formation process. Although belonging to the same group, the ground ice at 20.55 m may have different source water.
3) The calculated theoretical slope of 6.4 is larger than the experimental value (5.76), which is suggestive of complex origin and formation process of ground ice in different depths.
Acknowledgments:We express our gratitude to editors and two anonymous reviewers for their constructive and insightful comments and suggestions. This work was supported by the National Natural Science Foundation of China (Grant No. 41501071), by the State Key Laboratory of Frozen Soils Engineering (Grant No. SKLFSE201511), by the China Postdoctoral Science Foundation (Grant No. 2016M590984), and by the Chinese Academy of Sciences Key Research Program (Grant No. KZZD-EW-13)
| Dansgaard W, 1964. Stable isotopes in precipitation. Tellus, 16(4): 436–468. DOI: 10.1111/j.2153-3490.1964.tb00181.x |
| Fritz M, Wetterich S, Meyer H, et al, 2011. Origin and character-istics of massive ground ice on Herschel Island (Western Ca-nadian Arctic) as revealed by stable water isotope and hydro-chemical signatures. Permafrost and Periglacial Processes, 22: 26–38. DOI: 10.1002/ppp.714 |
| Jessen S, Holmslykke HD, Rasmussen K, et al, 2014. Hydrology and pore water chemistry in a permafrost wetland, Ilulissat, Greenland. Water Resources Research, 50: 4760–4774. DOI: 10.1002/2013WR014376 |
| Jouzel J, Souchez RA, 1982. Melting-refreezing at the glacier sole and the isotopic composition of the ice. Journal of Glaciology, 28(98): 35–42. |
| Lacelle D, Davila AF, Fisher D, et al, 2013. Excess ground ice of condensation-diffusion origin in University Valley, Dry Valleys of Antarctica:Evidence from isotope geochemistry and numerical modeling. Geochimica et Cosmochimica Acta, 120: 280–297. DOI: 10.1016/j.gca.2013.06.032 |
| Lacelle D, Fontaine M, Forest AP, et al, 2014. High-resolution stable water isotopes as tracers of thaw unconformities in permafrost:A case study from western Arctic Canada. Chemical Geology, 368: 85–96. DOI: 10.1016/j.chemgeo.2014.01.005 |
| Lacelle D, 2011. On the δ18O, δD and D-excess relations in meteoric precipitation and during equilibrium freezing:Theoretical approach and field examples. Permafrost and Periglacial Pro-cesses, 22: 13–25. DOI: 10.1002/ppp.712 |
| Lehmann L M, Siegenthaler U, 1991. Equilibrium oxygen and hydrogen isotope fractionation between ice and water. Journal of Glaciology, 37(125): 23–26. |
| Liljedahl AK, Boike J, Daanen RP, et al, 2016. Pan-Arctic ice-wedge degradation in warming permafrost and its influence on tundra hydrology. Nature Geoscience, 9: 312–318. DOI: 10.1038/ngeo2674 |
| Meyer H, Opel T, Laepple T, et al, 2015. Long-term winter warming trend in the Siberian Arctic during the mid-to late Holocene. Nature Geoscience, 8: 122–125. DOI: 10.1038/ngeo2349 |
| Michel FA, 1982. Isotope investigations of permafrost waters in Northern Canada. Ph.D. Thesis, University of Waterloo, Can-ada. |
| Nikolayev VI, Mikhalev DV, 1995. An oxygen-isotope paleo-thermometer from ice in Siberian permafrost. Quaternary Re-search, 43: 14–21. |
| Niu FJ, Zhang JM, Zhang Z, 2002. Engineering geological charac-teristics and evaluations of permafrost in Beiluhe testing field of Qinghai-Tibetan Railway. Journal of Glaciology and Geo-cryology, 24(3): 264–269. |
| Niu FJ, Lin ZJ, Liu H, et al, 2011. Characteristics of thermokarst lakes and their influence on permafrost in Qinghai-Tibet Plat-eau. Geomorphology, 132: 222–233. DOI: 10.1016/j.geomorph.2011.05.011 |
| Souchez RA, Jouzel J, Lorrain R, et al, 2000. A kinetic isotope effect during ice formation by water freezing. Geophysical Research Letters, 27: 1923–1926. DOI: 10.1029/2000GL006103 |
| Streletskaya I, Vasiliev A, Meyer H, 2011. Isotopic composition of syngenetic ice wedges and palaeoclimatic reconstruction, Western Taymyr, Russian Arctic. Permafrost and Periglacial Processes, 22: 101–106. DOI: 10.1002/ppp.707 |
| Streletskiy DA, Tananaev NI, Opel T, et al, 2015. Permafrost hydrology in changing climatic conditions:seasonal variability of stable isotope composition in rivers in discontinuous permafrost. Environmental Research Letters, 10: 095003. DOI: 10.1088/1748-9326/10/9/095003 |
| Wu QB, Hou YD, Yun HB, et al, 2015. Changes in active-layer thickness and near-surface permafrost between 2002 and 2012 in alpine ecosystems, Qinghai-Xizang (Tibet) Plateau, China. Global and Planetary Change, 124: 149–155. DOI: 10.1016/j.gloplacha.2014.09.002 |
| Wu QB, Zhang TJ, 2008. Recent permafrost warming on the Qinghai-Tibetan Plateau. Journal of Geophysical Research, 113: D13108. DOI: 10.1029/2007JD009539 |
| Yang YZ, Wu QB, Yun HB, 2013. Stable isotope variations in the ground ice of Beiluhe Basin on the Qinghai-Tibet Plateau. Quaternary International, 313-314: 85–91. DOI: 10.1016/j.quaint.2013.07.037 |
| Yang YZ, Wu QB, Jiang GL, et al, 2016a. Stable isotopic stratifi-cation and growth patterns of ground ice in permafrost on the Qinghai-Tibet Plateau, China. Permafrost and Periglacial Pro-cesses, 28: 119–129. DOI: 10.1002/ppp.1892 |
| Yang YZ, Wu QB, Yun HB, et al, 2016b. Evaluation of the hy-drological contributions of permafrost to the thermokarst lakes on the Qinghai-Tibet Plateau using stable isotopes. Global and Planetary Change, 140: 1–8. DOI: 10.1016/j.gloplacha.2016.03.006 |
| Yoshikawa K, Natsagdorj S, Sharkhuu A, 2013. Groundwater hydrology and stable isotope analysis of an open-system pingo in northwestern Mongolia. Permafrost and Periglacial Processes, 24(3): 175–183. DOI: 10.1002/ppp.1773 |
| Zhao L, Ding YJ, Liu GY, et al, 2010. Estimates of the reserves of ground ice in permafrost regions on the Tibetan Plateau. Journal of Glaciology and Geocryology, 32(1): 1–9. |