Article Information
- Zhuo Ga, Tao Chen, La Ba, PuBu CiRen, Ba Sang. 2017.
- Distribution of winter-spring snow over the Tibetan Plateau and its relationship with summer precipitation in Yangtze River
- Sciences in Cold and Arid Regions, 9(1): 20-28
- http://dx.doi.org/10.3724/SP.J.1226.2017.00020
Article History
- Received: June 8, 2016
- Accepted: October 19, 2016
2. Tibet Climate Center, Lhasa, Tibet 850000, China;
3. Tibet Institute of Plateau Atmospheric and Environmental Science, Lhasa, Tibet 850000, China
As one of the most sensitive component in climate change, snow cover is a crucial response factor in environmental variation which is not only sensitive to climate change but also closely related to hydrological and biological processes. Numerous studies (Wang, 2012; Wang and Li, 2012; Li, 2013; Xi and Zhang, 2013) show that snow cover in China is primarily situated in northeastern China, the northern part of Xinjiang Province and the Tibetan Plateau (TP). The development of satellite remote sensing monitoring technology and Geographic Information System (GIS) provide effective methods for real-time monitoring of snow cover in mountainous regions with sparse surface stations such as in Manas River Basin (Zheng et al., 2014) and in the TP.
Snow cover over the TP presents obvious seasonal and regional variation characteristics (Li, 2013). Chu et al. (2014) noted that the richest snow cover regions are concentrated in Mt. Nyainqentanglha and the northwestern mountains of the TP. Research (Sun et al., 2014) also demonstrated that snow cover is mainly located in regions with high altitude, and stable snow coverage expands while permanent snow coverage gradually decreases. Tian et al. (2014) indicated that the distribution of snow cover is quite different before and after 1988, which might be closely related to the time when the TP entered a warm and humid period preceding a warm and dry period during the mid-late 1980s. The analysis of Shen et al. (2011) also suggested that TP snow cover exhibited significant decadal variability with major shifts around the 1840s, 1880s, 1920s and 1960s, and their variations are found to be closely correlated with the Atlantic Multi-decadal Oscillation.
Increasing snow depths occur in the southeastern, western and southern parts of the TP (Tang et al., 2012; Bai et al., 2014). Wang et al. (2013) evaluated the accuracy and consistency among meteorological observations, snow depth and snow cover days (SCD). The interaction between winter monsoon and warm-humid air current on snow cover in the seasonal scale has been examined as well (Bo et al., 2014). Also, Wan et al. (2013) investigated the distribution of snow accumulation and melt, snow cover percentage (SCP) with the relationship of snow cover factors to climate parameters in the Namco lake region. These studies indicate the variation of winter snow cover over the TP and its relation with atmospheric circulation.
Abnormal variation of snow cover over the TP has been concerned by many scientists due to the influence of snow cover on the atmospheric circulation and cold/warm sources. The presence and influence of Tibetan weather systems could be found in most heavy rainfall events (Tao and Ding, 1981). The air column over the TP descends in winter and ascends in summer and regulates the surface Asian monsoon flow which can influence the climate in Asia (Wu et al., 2007). Snow cover exerts a modulating effect on ENSO tele-connections and ENSO significantly correlates with the East Asian Summer Monsoon (Wu et al., 2012). In addition, the variability of snow cover in prior autumn is significantly correlated with the first principal component of the North American winter temperature (Lin and Wu, 2011).
Regarding the influence of snow cover on precipitation, previous studies noted that the effect of abnormal winter snow cover plays an important role on summer precipitation in East Asia (Si and Ding, 2013) and southwestern China (Zhou et al., 2010). The summer rain belt is always situated in southern (northern) areas in eastern China under the interaction of high (low) sea surface temperature in Nino3 area and more (less) snow cover over the plateau, and the effect of snow cover on precipitation is quite different in various months of summer in the southern part of Yangtze River (Tao et al., 2011). Numerous studies (Song et al., 2011; Du et al., 2014) noted that the increase of TP winter snow cover could lead to an increase of summer precipitation in the middle and lower reaches of Yangtze River Valley (MLYRV), presenting abnormal snow cover and surface temperatures. This could lead to abnormal localized atmosphere which affects the precipitation process for downstream regions. Gao et al.(2010, 2011) estimated the influence of soil frozen differences on summer precipitation in China under various snow cover over the TP, indicating that snow cover and seasonal frozen soil have predictability for summer precipitation to some extent. Li and Wang (2011) summarized numerous studies in the effect of snow cover over the TP on precipitation for downstream area in China, of which snow cover is closely related to summer precipitation in different regions and various periods (Li, 2013). Huo et al. (2014) proposed that increased snow cover might lead to more precipitation in MLYRV while less precipitation in the narrow coastal areas of eastern China during the end of summer and early autumn.
2 Study area, data and methods 2.1 Study areaAs a large scale geographic location situated in the mid-latitudes of Asia, many different scopes and boundaries for the TP have been used in terms of complex topography, altitude, study requirements and data limitations. In this study, we choose the TP boundary data presented by the Chinese Academy of Sciences (Zhang et al., 2002) which is defined as the region between the Pamir Plateau to the Hengduan Mountains (west to east) and from the Himalayas to Kunlun-Qilian (south to north). In addition, certain coverage (28.25°N-33.75°N, 110.25°E-121.75°E) was chosen to indicate the major study area in MLYRV.
2.2 Data 2.2.1 Remote sensing dataDue to the lack of physical meteorological measurements for snow cover in western TP, remote sensing products could make up for this shortcoming. MODIS/Terra snow data used in this paper were obtained from NASA Distributed Active Archive Center (DAAC) at the U.S. National Snow and Ice Data Center (http://nsidc.org/) and suitable for use in regions with complex topography. MODIS eight-day composite snow cover data could eliminate the problem of cloud obscuration which is typically quite accurate over the TP, with an accuracy of nearly 90% (Wen et al., 2006). Hence we have chosen to rely on MOD10A2 to analyze the spatial and temporal distribution of snow cover. MOD10A2 is an eight-day composite snow product with 500-m resolution, Sinusoidal map projection and HDF-EOS format, including two parameters such as “Maximum-Snow-Extent“ (MSE) and “Eight-Day-Snow-Cover“ (EDSC). In this paper, we used MSE to indicate the distribution of snow cover. The data arrives as a tile of the global grid and five tiles were chosen for the TP, each tile shows eight-day snow cover with the range from 69°E-117°E and 20°N-40°N which begins on the first day of the year and extends into the next year. Totals of 514 MSE mosaic images created from eight-day composite data were used covering a period of 11 years from January 2003 to February 2014.
The snow cover percentage (SCP) is defined as a proportion of the number of snow covered pixels and total pixel number over the whole TP. The snow cover frequency (SCF) refers to the ratio of the number with eight-day times covered with snow and the total times during the period of time. Namely, the total number is around 46 times of eight-day for each year, and each month has 3 or 4 times while 11 or 12 times for different seasons. Here we mainly choose the averaged result of SCP/SCF during 2003-2013 to reflect the temporal and spatial distribution respectively.
2.2.2 Meteorological dataDaily and monthly precipitation was acquired from China Meteorological Data Sharing Service System. The data grid has 0.5°×0.5° resolution which covers the following area: 18.25°N-53.75°N, 72.25°E-135.75°E. Here we used daily data from 2003 to 2013 and monthly precipitation during 1980-2013 for the distribution of snow cover and correlation analysis. The accumulated precipitation of June, July and August over the certain coverage (28.25°N-33.75°N, 110.25°E-121.75°E) was chosen to represent summer precipitation in the MLYRV.
2.3 MethodsMODIS Reprojection Tool (MRT) has been developed to Mosaic tiles required for the TP, converting the HDF-EOS format into Geotiff file format and UTM projection. Since the MSE data contains the information of several different land types such as clouds, land, and lakes, we extract snow data using ENVI program for the analysis of snow cover variation.
According to previous studies (Wu et al., 2006; Zhu et al., 2008), we calculated the standard deviation (SD) of accumulated precipitation records from the monthly grid precipitation in June, July and August as the primary summer rainy stage, and selected the grid point (117.75°E, 29.75°N) with the largest variability in the Yangtze Basin as the base point for making one-point correlation during 1980-2013 to the accumulated precipitation of other grid points in the MLYRV. We use the mean precipitation at 145 grid points to represent summer precipitation, which are of the same rainfall variation as that as the base point. Their correlation coefficients exceeded the 95% confidence level based on the correlation coefficient test, which represents summer precipitation in the MLYRV.
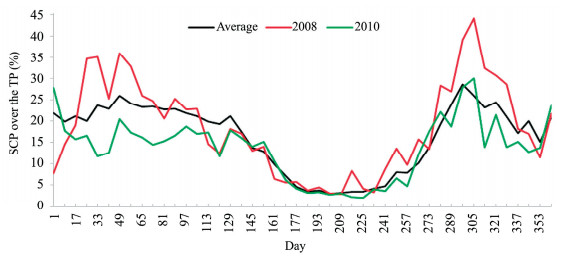
3 Temporal and spatial variation of snow cover 3.1 Eight-day temporal variationConsidering the average situation of eight-day composite percentage of snow cover (Figure 1) during 2003-2013, the multi-year averaged percentage of snow cover is 16.28%, and the maximum percentage is 28.67% which appears in October along with the typical minimum in August (3.08%). The percentage remains approximately 20% in winter and spring then tails off to below 5% with the warmer temperature and snow melt in summer and the percentage presents increasing tendency since September. Liu et al. (2012) noted that the maximum SCP possibly appears from November to February, with November having the highest frequency. The higher SCP appears from the middle of October to March during 2003-2013 in this study which is slightly different from previous research to some extent. This might be caused by different data resolution and study periods. Regarding to mean SCP for different years, the maximum SCP reached 18.36% in 2008 and minimum in 2010 with 13.69%. It can be seen that the SCP is determined by snow cover of spring and winter. The yearly variation trend of eight-day composite SCP basically coincides with the variation of multi-year averaged value.
|
| Figure 1 Variation of multi-year averaged SCP per eight-day composite during 2003-2013 and SCP in 2008 and 2010 |
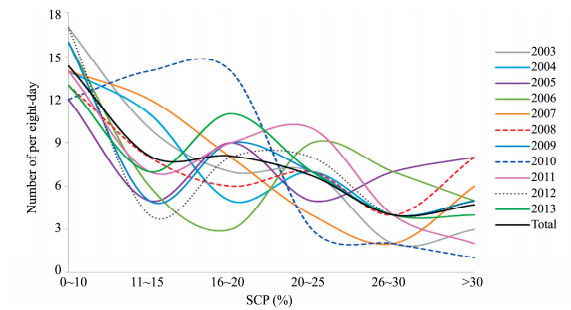
The SCF with different percentages (Figure 2) of snow cover shows that the lower percentages (0%~10%, 11%~15%) persist for the highest frequency which accounts for 31.2% and 17.6% respectively of the annual amount. The middle percentages (16%~20%, 20%~25%) occupy 17.6% and 14.6% respectively, they are quite low for higher percentages (26%~30%, > 30%) which account for 8.7% and 10.3% respectively of the annual amount. Therefore, the lower and highest percentages present a declining trend and the middle SCP expresses an increasing tendency.
|
| Figure 2 Number of per eight-day composite periods with different SCP |
Spring and winter has the largest accumulated percentages, followed by percentages in autumn and summer. The seasonal distribution of different years is similar to the averaged distribution and the maximum appears in spring or winter. The SCP presents increasing tendency in autumn with the rate of 2.35% per 10 years while it decreases with the rate of 0.83%, 4.87% and 4.94% per 10 years in spring, summer and winter, respectively. The annual accumulated SCP decreases with the rate of 1.74% per 10 years during 2003-2013. Xi and Zhang (2013) noted that snow cover has an obvious second order variation tendency. However, with only 11 years of MODIS data, it is hard to arrive at any definitive conclusion. Clearly a longer time series of data is needed for further investigation.
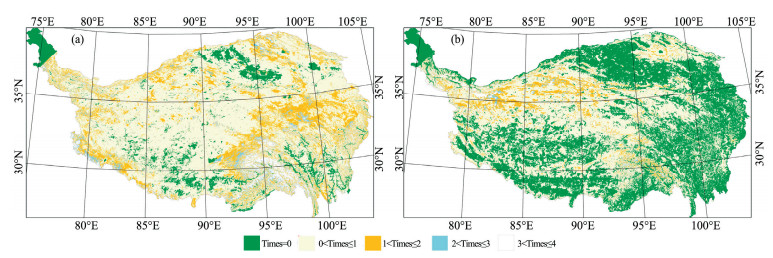
3.3 Annually spatial distributionIt was found that most persistent snow cover is located in the southern and western edges of the TP within large mountains ridges and western edges of Yarlungzangbo Valley during 2000-2006 (Pu et al., 2007). Most regions of the plateau basically have snow cover and are unevenly distributed based on the composited snow cover frequency (SCF) during 2003-2013 (Figure 3a). Specifically, higher SCF corresponds well with large mountains such as Nyaiqentanglha, the valley areas of Gangdise Mountains, Himalayas, Hengduan, and Qilianshan range with higher altitude. There is less snow cover in Qaidam Basin and southeastern Tibet. The location with snow cover is similar to the averaged frequency in different years as a whole. Consequently, snow cover is mostly situated in the southeastern and the middle parts of the TP with higher mountainous regions, namely more snow is situated in the periphery of the plateau and mountainous regions, less snow in the interior of the plateau, basin and valley areas.

|
| Figure 3 Spatial distribution of annual SCF (a) and its linear trend (b) during 2003-2013 |
In order to further understand the spatial variation of annual SCF, the trend coefficient of SCF during 2003-2013 has been calculated (Figure 3b). The coefficient presents declining tendency in most parts of the TP, but southeastern Tibet and some areas of Kunlun and Hengduan mountains have opposite variation trend. Obviously, the snow cover variation trend is similar to the distribution derived from Li (2013). Overall, snow cover in the interior of the plateau has remarkable declining tendency while it presents increasing trend in the periphery of the TP.
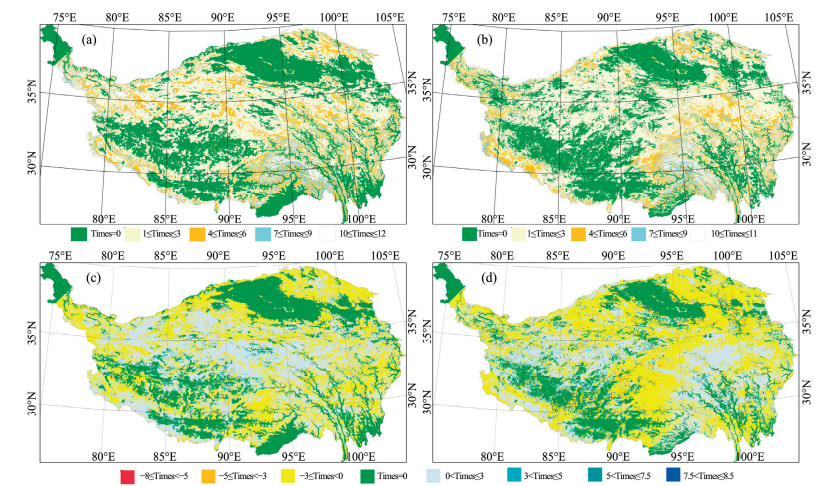
3.4 Seasonal spatial distributionThe highest frequency appears in spring (Figure 4a) based on seasonal SCF during 2003-2013, where most of the regions have abundant snow cover except Qaidam Basin, southeastern Tibet and northern Gangdise mountains. The frequency in winter (Figure 4b) is similar to the distribution in spring and significant snow appears over the areas of Qilian Shan Range as well. The amplitude of SCF in winter and spring is different to some extent over the western Himalayas, Karakoram and areas of Nyaiqentanglha mountains. The duration for snow persistence varies in different elevation ranges.
|
| Figure 4 Spatial distribution of winter-spring SCF (a: spring, b: winter) and their linear trend (c: spring, d: winter) during 2003-2013 |
Similarly, the seasonal variation trend coefficient indicates that snow cover basically shows a declining tendency in spring (Figure 4c) while areas with increasing snow cover are concentrated in the middle part of the plateau, the western Himalayas and eastern Karakoram mountains. Winter snow cover (Figure 4d) presents a declining tendency in most parts of the TP as well, and snow cover with increasing tendency is only located in eastern Karakoram and some areas of Hengduan mountains.
4 Relationship of snow cover to precipitationPrevious studies indicate that winter-spring snow cover over the TP play an important role on precipitation in eastern China. Regions with the maximum SCF are primarily concentrated in southeastern TP such as the surrounding areas of Nyaiqentanglha Mountains. Based on the distribution of SCP and the study of Lv and Xu (1990), southeastern TP is defined as the following coverage: 90°E-103°E, 26°N-36°N, and the MLYRV ranges from 110°E-122°E, 28°N-34°N. Therefore, the relationship of winter-spring snow cover over the entire TP and southeastern TP to precipitation in the MLYRV has been investigated with the SCP as the parameter to reflect snow cover status.
4.1 Relationship of snow cover to precipitation during the same time periodsThe distribution of eight-day composite SCP and precipitation (Figure 5a) shows that whatever the SCP over the entire plateau or southeastern TP, SCP is negatively related to regional precipitation concurrently. The correlation coefficient of SCP to precipitation is -0.653 and -0.702 respectively, passing the 99.9% confidence level. Similarly, annual and spring SCP is negatively related to precipitation as well while SCP is positively related to summer precipitation, and the coefficient is 0.781 and 0.568 respectively for the entire plateau and southeastern TP. No significant relationship exists in autumn and winter. Furthermore, monthly variation (Figure 5b) during 2003-2013 could better present the negative relationship of SCP to precipitation and the coefficients are -0.735 and -0.778, respectively.

|
| Figure 5 Variation of SCP per eight-day (a) and per month (b) to precipitation in the MLYRV |
Based on the one-point correlation, we selected mean precipitation at 145 grid points to represent summer precipitation and compared the precipitation with winter-spring SCP over the TP. In order to validate their relations, we dealt with the correlations between winter-spring SCP and summer precipitation, hence arriving at the coefficients of 0.10 and -0.38, respectively, indicating that winter SCP seemed to be positively related with summer precipitation, while spring SCP shows an opposite relation with precipitation, but the coefficient failed to pass the 90% confidence level. Thus, the relationship of SCP to summer precipitation in the MLYRV might vary with different periods and regions.
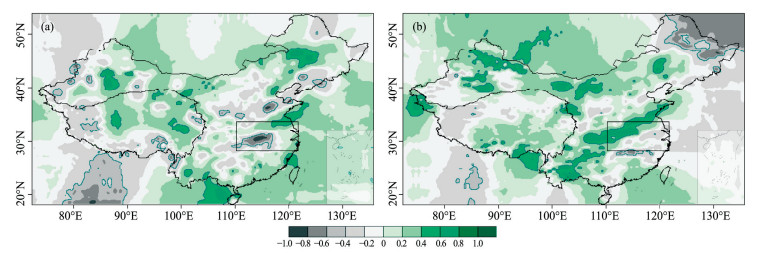
In order to better understand the relationship of winter-spring snow cover to precipitation, accumulated precipitation as mentioned in the MLYRV was used to indicate summer precipitation, and lead/lag correlation analyses (Figure 6) of winter-spring SCP and summer precipitation are performed respectively. It follows that spring SCP (Figure 6a) is negatively related to summer precipitation in the study area and winter SCP (Figure 6b) is positively related to summer precipitation in most parts of the MLYRV. Both coefficients are statistically significant at 90% confidence level for the correlation coefficient-test. Thus, the influence of winter snow cover on summer precipitation is much more significant than that in spring. Previous studies have also shown that winter snow cover over the TP has a strong link with general circulation and monsoon systems over eastern and southern Asia during spring and summer (Dickson, 1984; Yang, 1996). This suggests that TP snow cover might influence precipitation in eastern China through its thermal effects on atmospheric circulation.
|
| Figure 6 Correlation coefficient of winter-spring SCP (a: spring, b: winter) over the TP to summer precipitation in MLYRV. The black square frame represents the MLYRV, areas passed correlation coefficient test at 90% confidence level area circled |
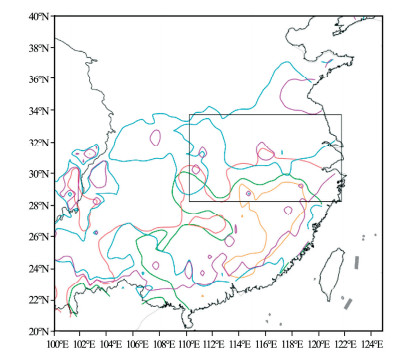
The monthly variation of SCF over the TP and precipitation in eastern China demonstrates that higher SCF is mostly concentrated in southeastern TP in winter and precipitation areas are located in southern China in spring. When higher SCF centers moves from the southeast to the northwest in spring, precipitation regions expand from southern to northern China in pace with the monsoon onset with the advance of time. SCF over the TP decreases rapidly in July except the mountains ridges with high altitude while precipitation regions spreads all over China except the northern part of Xinjiang. Precipitation regions start to shrink from north to south in eastern China when SCF center shifts from northwest to southeast in summer and begins to enter the end of the rainy season. Chen (2001) indicated that TP snow cover will delay the seasonal northward advance of the western Pacific subtropical high, and the northward progress of main rain band, which may result in enhanced summer rainfall in the Yangtze River Valley.
Figures 7a, b present the spatial distribution of SCF over the TP in January and June, which demonstrates the movement law aforementioned. The variation of monthly precipitation presented in Figure 8 clearly indicates the process of north and south movement of the rain belt. This suggests that TP snow cover oscillates from southeast to northwest which corresponds well to the beginning, development and cessation of the rainy season in eastern China. There might be more summer precipitation in MLYRV when higher SCF is mainly located in southeastern TP. Zhang and Tao (2001) noted that winter snow cover over the TP has a strong link with general circulation and monsoon systems. Therefore, snow cover especially in southeastern TP in winter may play a significant role on summer precipitation in MLYRV.
|
| Figure 7 Monthly variation of SCF in January (a) and June (b) during 2003-2013, indicating the movement of SCP over the TP |
|
| Figure 8 Monthly variation of precipitation during 2003-2013 (areas with monthly precipitation larger than 200 mm as an example to demonstrate the variation process of rain belt in eastern China) |
Considering the influence of snow cover over the TP on Asian summer precipitation, numerous studies (Zhang and Tao, 2001; Wei et al., 2008; Zhu et al., 2009) have focused on possible physical mechanisms. They pointed out that the more the snow cover over the TP, the weaker the sensible heat source is, which results in weakened ascending motion over the TP. In addition, the melted winter-spring snow could last to summer, increasing soil moisture and decreasing air temperature, and the long-term interaction between moist soil and atmosphere weakens the heat source of the TP as well. This delays the onset of east summer monsoon and weakens the intensity of summer monsoon to a certain degree, which is the main impacting mechanism of snow cover over the TP on monsoon and rainfall distribution in China. Obviously, the relationship of snow cover and summer precipitation varies with different periods and regions. Therefore, the interaction of SCF to precipitation and influence mechanism still need further study on the basis of regional thermal effects of TP on atmospheric circulation.
5 SummaryBased on the MODIS snow product and grid precipitation, the temporal and spatial distribution of TP snow cover and its relationship with summer precipitation in the MLYRV have been investigated. The results of our study are summarized as follows:
1) SCP remains approximately 20% in winter and spring then it tails off to below 5% with warmer temperature and snow melt in summer. The lower and highest percentages present a declining tendency while the middle SCP exhibits an opposite variation. The maximum value appears from the middle of October to March and the minimum emerges from July to August. The annual and winter-spring SCPs present decreasing tendency.
2) Snow cover is mainly situated in the periphery of the plateau and mountainous regions, and less snow in the interior of the plateau, basin and valley areas in view of SCF over the TP. Whatever annual or winter-spring snow cover, they have a remarkable declining tendency during 2003-2013, and annual snow cover presents a decreasing trend in the interior of the TP and increasing trend in the periphery of the TP.
3) The multi-year averaged eight-day SCP is negatively related to mean precipitation in the MLYRV. Spring SCP is negatively related to summer precipitation while winter SCP is positively related to summer precipitation in most parts of the MLYRV. Hence, the influence of winter snow cover on precipitation is much more significant than that in spring on the basis of correlation analysis. The oscillation of SCF from southeast to northwest over the TP corresponds well to the beginning, development and cessation of the rain belt in eastern China.
Acknowledgments:This work was supported by the National Natural Science Foundation of China (Grant No. 41130960) and the Project of the China Meteorological Administration (Grant Nos. CCSF201515 and CMAGJ2013M51). The authors would like to thank the Land Process Distributed Active Archive Center (LPDAAC) and China Meteorological Administration for providing dataset used in this study. The authors would like to express thanks to Academician XiangDe Xu for his careful instructions. We are also grateful to anonymous reviewer, whose insightful comments and constructive criticism have improved the paper substantially.
| Bai SY, Shi JQ, Gao JX, et al, 2014. Analysis of spatial-temporal variations of snow depth over the Qinghai-Tibetan Plateau during 1979-2010. Journal of Geo-information Science, 16(4): 628–637. DOI: 10.3724/SP.J.1047.2014.00628.(inChinese) |
| Bo Y, Li XL, Wang CH, 2014. Seasonal characteristics of the interannual variations centre of the Tibetan Plateau snow cover. Journal of Glaciology and Geocryology, 36(6): 1353–1362. DOI: 10.7552/j.issn.1000-0240.2014.0162.(inChinese) |
| Chen LT, 2001. The role of the anomalous snow cover over the Qinghai-Xizang Plateau and ENSO in the great floods of 1998 in the Changjiang River Valley. Chinese Journal of Atmospheric Sciences, 25(2): 184–192. |
| Chu D, Xie HJ, Wang PX, et al, 2014. Snow cover variation over the Tibetan Plateau from MODIS and comparison with ground observations. Journal of Applied Remote Sensing, 8: 084690-1–8. DOI: 10.1117/1.JRS.8.084690 |
| Dickson RR, 1984. Eurasian snow cover versus Indian monsoon rainfall-An extension of the Hahn-Shukla results. Journal of Applied Meteorology, 23: 171–173. DOI: 10.1175/1520-0450(1984)023-0171 |
| Du Y, Xie ZQ, Xiao H, 2014. Relation between summer precipita-tion anomaly in eastern China and winter snow in Tibetan Plateau. Journal of the Meteorological Sciences, 34(6): 647–655. DOI: 10.3969/2013jms.0083.(inChinese) |
| Gao R, Zhong HL, Dong WJ, et al, 2010. The abrupt changing characteristics of snow cover and seasonal freezing-thawing layer in the Tibetan Plateau and their impact on summer precipitation in China. Journal of Glaciology and Geocryology, 32(3): 469–474. |
| Gao R, Zhong HL, Dong WJ, et al, 2011. Impact of snow cover and frozen soil in the Tibetan Plateau on summer precipitation in China. Journal of Glaciology and Geocryology, 33(2): 254–260. |
| Huo F, Jiang ZH, Liu ZY, 2014. Impacts of late spring Tibetan Plateau snow cover on early autumn precipitation. Chinese Journal of Atmospheric Sciences, 38(3): 352–362. DOI: 10.3878/j.issn.1006-9895.2013.13139.(inChinese) |
| Li DL, Wang CX, 2011. Research progress of snow cover and its influence on China climate. Transactions of Atmospheric Sci-ences, 34(5): 627–636. |
| Li XL, 2013. Study on the relationships between the temporal & spatial of snow cover in winter and spring over Tibetan Plateau and the summer precipitation in eastern China. M.S. Thesis, Lanzhou University. (in Chinese) |
| Lin H, Wu ZW, 2011. Contribution of the autumn Tibetan Plateau snow cover to seasonal prediction of north American winter temperature. Journal of Climate, 24: 2801–2813. DOI: 10.1175/2010JCLI3889.1 |
| Liu JF, Chen RS, Song YX, 2012. Distribution and variation of snow cover in China. Progressus Inquisitiones de Mutatione Climatis, 8(5): 364–371. DOI: 10.3969/j.issn.1673-1719.2012.05.008.(inChinese) |
| Lv JN, Xu JF, 1990. Climatic analysis of the 1954-1983 Meiyu rainfall over the middle and lower basin of the Changjiang River. Journal of Nanjing Institute of Meteorology, 13(2): 228–237. |
| Pu ZX, Xu L, Salomonson VV, 2007. MODIS/Terra observed seasonal variations of snow cover over the Tibetan Plateau. Geophysical Research Letters, 34: L06706. DOI: 10.1029/2007GL029262 |
| Shen CM, Wang WC, Zeng G, 2011. Decadal variability in snow cover over the Tibetan Plateau during the last two centuries. Geophysical Research Letters, 38: L10703. DOI: 10.1029/2011GL047288 |
| Si D, Ding YH, 2013. Decadal change in the correlation pattern between the Tibetan Plateau winter snow and the East Asian summer precipitation during 1979-2011. Journal of Climate, 26: 7622–7634. DOI: 10.1175/JCLI-D-12-00587.1 |
| Song Y, Zhang J, Li ZC, et al, 2011. Interdecadal change of winter snow depth on Tibetan Plateau and its effect on summer pre-cipitation in China. Plateau Meteorology, 30(4): 843–851. |
| Sun YH, Huang XD, Wang W, et al, 2014. Spatio-temporal changes of snow cover and snow water equivalent in the Tibetan Plateau during 2003-2010. Journal of Glaciology and Geocryology, 36(6): 1337–1344. DOI: 10.7522/j.issn.1000-0240.2014.0160.(inChinese) |
| Tang XP, Yan XL, Ni MJ, et al, 2012. Changes of the snow cover days on Tibetan Plateau in last 40 years. Acta Geographica Sinica, 67(7): 951–959. |
| Tao SY, Ding YH, 1981. Observational evidence of the influence of the Qinghai-Xizang (Tibet) Plateau on the occurrence of heavy rain and severe convective storms in China. Bulletin American Meteorological Society, 62(1): 23–30. DOI: 10.1175/1520-0477(1981)062<0023:OEOTIO>2.0.CO;2 |
| Tao YW, Sun ZB, Li WJ, et al, 2011. Relationships between ENSO and Qinghai-Tibetan Plateau snow depth and their influences on summer rainfall anomalies in China. Meteorological Monthly, 37(8): 919–928. |
| Tian LX, Li WZ, Zhang Y, et al, 2014. The analysis of snow information from 1979 to 2007 in Qinghai-Tibetan Plateau. Acta Ecologica Sinica, 34(20): 5974–5983. DOI: 10.5846/stxb201303070365.(inChinese) |
| Wan X, Kang SC, Li YF, et al, 2013. Temporal and spatial varia-tions of snow cover and its effect factors in the NamCo Basin, Tibetan Plateau. 2007-2011. Journal of Glaciology and Geo-cryology, 35(6): 1400–1409. DOI: 10.7522/j.issn.1000-0240.2013.0155.(inChinese) |
| Wang CX, 2012. The effect of winter snow cover over the Tibetan Plateau to the summer precipitation at the Yellow River Basin. Master Dissertation, Nanjing University of Information Science & Technology. (in Chinese) |
| Wang CX, Li DL, 2012. Spatial-temporal variations of snow cover days and the maximum depth of snow cover in China during recent 50 years. Journal of Glaciology and Geocryology, 34(2): 247–256. |
| Wang ZL, Wang XP, Li YH, 2013. Analyses of snow cover based on passive microwave remote sensing data and observed data over the Tibetan Plateau. Journal of Glaciology and Geocryology, 35(4): 783–792. DOI: 10.7522/j.issn.1000-0240.2013.0089.(inChinese) |
| Wei ZG, Chen W, Huang RH, 2008. Numerical simulation of the influence of the Tibetan Plateau winter-spring snow anomalies on the summer precipitation in China. Plateau and Mountain Meteorology Research, 28(1): 1–7. |
| Wen J, Dai M, Paul DJ, et al, 2006. Extent and depth of snow cover over the Nyainqntanghla range derived from ASAR and MODIS data. Journal of Glaciology and Geocryology, 28(1): 54–61. |
| Wu GX, Liu YM, Wang TM, et al, 2007. The influence of me-chanical and thermal forcing by the Tibetan Plateau on Asian climate. Journal of Hydrometeorology-Special Section, 8: 770–789. DOI: 10.1175/JHM609.1 |
| Wu ZW, Li JP, He JH, et al, 2006. Large-scale atmospheric singu-larities and summer long-cycle droughts-floods abrupt alternation in the middle and lower reaches of the Yangtze River. Chinese Science Bulletin, 51(16): 2027–2034. DOI: 10.1007/s11434-006-2060-x |
| Wu ZW, Li JP, Jiang ZH, et al, 2012. Modulation of the Tibetan Plateau snow cover on the ENSO teleconnections:from the East Asian summer monsoon perspective. Journal of Climate, 25: 2481–2489. DOI: 10.1175/JCLI-D-11-00135.1 |
| Xi S, Zhang ZF, 2013. Spatial and temporal analysis of snow cover in China in recent 50 years. Journal of Arid Meteorology, 31(3): 451–456. DOI: 10.11755/j.issn.1006-7639(2013)-03-045.(inChinese) |
| Yang S, 1996. ENSO-snow-monsoon associations and season-al-interannual prediction. Climate Dynamics, 16: 2038–2051. |
| Zhang SL, Tao SY, 2001. Influence of snow cover over the Tibetan Plateau on the Asian summer monsoon. Chinese Journal of Atmospheric Sciences, 25(3): 372–390. |
| Zhang YL, Li BY, Zhen D, 2002. A discussion on the boundary and area of the Tibetan Plateau in China. Geographical Research, 21(1): 1–8. |
| Zheng P, Deng ZD, Guan HJ, et al, 2014. Spatial and temporal variation characteristics of snow based on TM and ETM+ data in Manas River Basin. Journal of the Meteorological Sciences, 34(1): 39–46. |
| Zhou H, Tang HY, Cheng BY, 2010. Relation between the abnormal snow cover in winter and spring over the Tibetan Plateau and summer precipitation over the southwest China. Journal of Glaciology and Geocryology, 32(6): 1144–1151. |
| Zhu X, Wu Z, He JH, 2008. Anomalous Meiyu onset averaged over the Yangtze River valley. Theoretical and Applied Climatology, 94: 81–95. DOI: 10.1007/s00704-007-0347-8 |
| Zhu YX, Ding YH, Liu HW, 2009. Simulation of the influence of winter snow depth over the Tibetan Plateau on summer rainfall in China. Chinese Journal of Atmospheric Sciences, 33(5): 903–915. |
 2017, 9


