Article Information
- ZhiCai Li, Yan Song, Wei Zhang, Jing Zhang, ZiNiu Xiao . 2016.
- Interdecadal correlation of solar activity with Tibetan Plateau snow depth and winter atmospheric circulation in East Asia
- Sciences in Cold and Arid Regions, 8(6): 524-535
- http://dx.doi.org/10.3724/SP.J.1226.2016.00524
Article History
- Received: March 22, 2016
- Accepted: October 12, 2016
2. China Meteorological Administration Training Centre, Beijing 100081, China;
3. FangShan District Meteorological Service, Beijing 102488, China;
4. Zoology and Agricultural Meteorological Centre of Shenyang Meteorological Administration, Shenyang, Liaoning 110168, China;
5. Institute of Atmospheric Physics, Chinese Academy of Sciences, Beijing 100029, China
The sun is the main energy source for the earth's climate system. Understanding the influence of solar activity on the climate system is of great significance for correct cognizing climate change and improving the prediction level of the climate system. On the basis of recognizing solar activity rules for both short and long term,further studies on the response of the climate system components to solar activity are required(Gray et al.,2010). Because snow is a major component of the climate system,it is very interesting to check whether and how snow depth over the Tibetan Plateau response to solar activity.
Over the past several decades,increased attention has been focused on anthropogenic factors influencing climate change(IPCC,2013),while the contribution of natural factors to climate change is very controversial. At the same time,studies on the impact of solar activity on the climate system have not reached a quantitative description(Solomon et al.,2007; Gray et al.,2010). In the IPCC Fifth Assessment Report,climate models only consider the linear impact of total solar irradiance(TSI)instead of the nonlinear amplifying feedback of multiple natural factors,which is very likely to exist and important in the link between the sun and climate(Gray et al.,2010; Lockwood et al.,2010). The response of climate to solar activity is through two mechanism,"top-down" and "bottom-up"(Weng,2012).
During the Holocene,abnormal solar activity has greatly influenced the earth's climate(Elizabeth,1995). For example,the results of numerical simulation for the 'Little Ice Age' show that abnormal solar radiation is probably the main reason for low temperature during this period(Song et al.,2003). During the Maunder Minimum,the most striking cooling period during the 'Little Ice Age',solar radiation significantly decreased by 0.1%~1%,this played an important role on the decline of global temperature. Kunitomo and Mikami(1992)used 14C data from tree rings to estimate sunspot activity,and found that the number of sunspots decreased to a large extent during the 'Little Ice Age',with the lowest number during the Maunder Minimum. The link between solar activity and global climate change has been greatly demonstrated by solar activity traces in tropospheric and surface atmosphere(Zhu,1973; Friis-Christensen and Lassen,1991; Gu,1991; Lean et al.,1995; Zhao et al.,1999; Van Loon and Shea,2000; Lean and Rind,2001; Tang et al.,2001; Yang et al.,2002; Gleisner and Thejll,2003; Weng,2003; Coughlin and Tung,2004; Chen et al.,2005; Foukal et al.,2006; Xu,2010; Zhang et al.,2011; Zhao et al.,2011; Xiao et al.,2013). At present,researches on the influence of solar activity on climate are usually focused on correlation analyses of solar activity data and climate parameters,including correlations of cosmic rays,ultraviolet light,solar irradiance,geomagnetic index or the number of sunspots with ground surface temperature(global or regional average),clouds,teleconnection or different atmospheric circulation types(Sfîcă and Voiculescu,2014). These studies show that solar activity is an important factor to drive the climate system(Haigh,1996; Svensmark,2007; Jiang et al.,2011). Some other studies show that present global warming is a natural climate fluctuation(Dansgaard et al.,1969; Zhao et al.,1999). Thus,it is necessary to further explore the relation of natural factors to climate,especially in some key fields. Tibetan Plateau snow depth is one of the key physical factors influencing China's climate; studying the relationship between Tibetan Plateau snow depth and solar activity is of high scientific value(Song et al.,2011). Arctic Oscillation and East Asian winter monsoon are typical circulation modes in East Asian,which are closely connected to solar activity and snow depth over the Tibetan Plateau,but most previous researches on their correlations are at interannual or much shorter time scales,less on decadal time scales(Shindell et al.,2001; Slonosky et al.,2001; Gimeno et al.,2003; Kodera et al.,2007; Lv et al.,2008; Mann et al.,2009; Ineson et al.,2011; Chen and Zhou,2012; Zhou et al.,2013; Qu et al.,2014; Zhou and Chen,2014). In this paper,we aim to disclose the interdecadal correlation of solar activity with Tibetan Plateau winter snow depth,Arctic Oscillation and the East Asian winter monsoon.
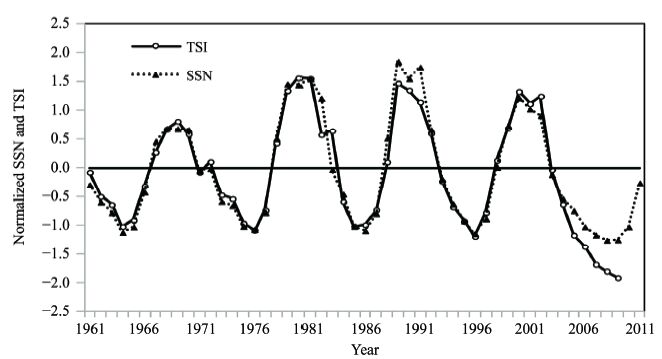
2 Data and methodsThis study is based on daily snow depth data from the National Meteorological Information Center reanalysis over gauge stations for the period 1951–2011(Song et al.,2011). The Solar Radio Flux(SRF)data(F10.7 cm data)during 1947–2012 were obtained from the National Oceanic and Atmospheric Administration Data Center,NOAA(http://www.esrl.noaa.gov/psd/ data/correlation/solar.data),and the SRF is expressed in solar flux units(sfu),where 1sfu=10−22 W/(m2·Hz). In this paper,we used an average from December to the following year's February to represent SRF winter mean. Solar Sunspot Number(SSN)data(1770–2014)were obtained from the Solar Influences Data Analysis Center(SIDC),Solar Physics Research Department of the Royal Observatory of Belgium(http: //sidc.oma.be/sunspot-data). Total Solar Irradiance(TSI)data(1875–2009)were received from data reconstruction of Zhao and Han(2012). Arctic Oscillation Index(AOI)data was downloaded from the National Oceanic and Atmospheric Administration Data Center,NOAA(http://www.cpc.ncep.noaa.gov/products/precip/ CWlink/daily_ao_index/ao.shtml)for the period of 1950–2013. Monthly mean data of atmospheric circulation were obtained from the National Centre for Environmental Prediction/National Center for Atmospheric Research(NCEP/NCAR)reanalysis of USA(Kalnay et al.,1996).
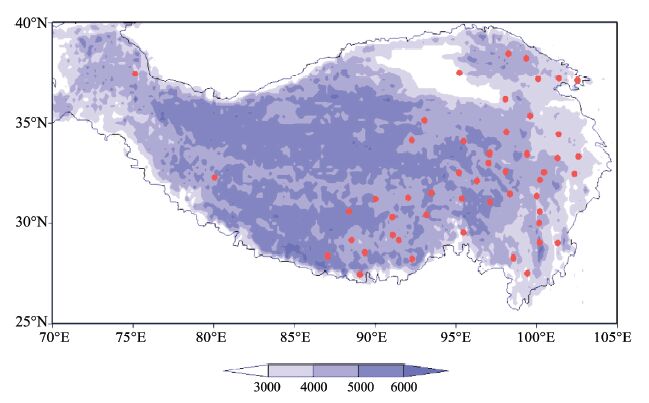
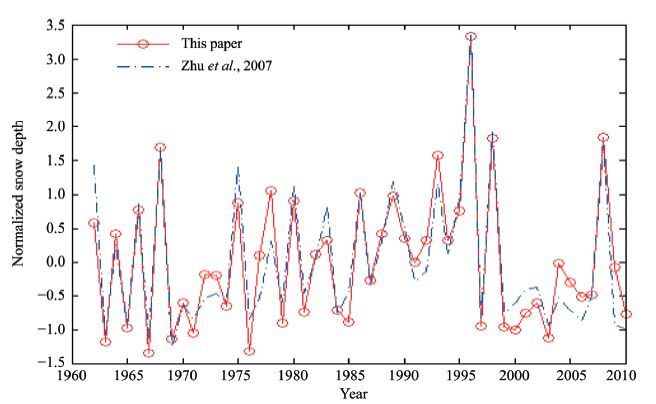
In order to eliminate the discontinuity of daily observation data for Tibetan Plateau snow depth,we extended original data with interpolation method to guarantee continuous monthly data from 51 stations(Figure 1)for the period of 1961–2011(Song et al.,2011). The Winter Snow Depth Index(WSDI)can be defined as the accumulation of snow depth from December to the following year's February. A normalized snow depth time series has been set up and it was compared with the other snow depth time series that established by Zhu et al.(2007)(Figure 2).
|
| Figure 1 Distribution of 51 snow depth observation stations over the Tibetan Plateau. The shaded area indicates elevation over 3,000 m |
|
| Figure 2 Time series of normalized snow depth over Tibetan Plateau in winter. The correlation coefficient was 0.94 at the 99% confidence level |
The formula for calculating the East Asian Winter Monsoon Index(EAWMI)(Zhu,2008)is defined as:
| $\begin{align} & EAWMI=U500\left( {{80}^{\circ }}\text{E}-{{120}^{\circ }}\text{E}{{25}^{\circ }}\text{N}-{{35}^{\circ }}\text{N} \right) \\ & -U500\left( {{80}^{\circ }}\text{E}-{{120}^{\circ }}\text{E}{{50}^{\circ }}\text{N}-{{60}^{\circ }}\text{N} \right) \\ \end{align}$ |
The larger the EAWMI,the stronger the East Asian winter monsoon,and more active cold air from high latitudes to China,resulting in colder winters. Although there are various winter monsoon indices(Wang and Chen,2010),Zhu's index(Zhu et al. 2007)is commonly used in climate monitor and prediction.
In this study,we used methods of power spectral analysis,correlation analysis,composite analysis,significance test,running mean and statistical analysis to detect the link of solar activity and snow depth. The T-test was used to test the confidence level of correlation coefficients between raw data time series; the Monte Carlo method was chosen to test the significance level of data series through running filter processing(Zhou and Zheng,1999; Yan et al.,2003; Zhao and Han,2005).
The idea for the Monte Carlo method is to build a probability model to produce stochastic processes,then to calculate the statistical characteristics of the sample sequences. Finally,the critical values of significance level are obtained through repetitive random drawing processes. In this study,the random sample sequence was first dealt with running filter processing,and then the critical values of correlation coefficients at different confidence levels were obtained by using the Monte Carlo method. Finally,one correlation coefficient value of two running mean samples was judged to be significant or not.
Detailed steps of computing the critical values(reliability thresholds)of correlation coefficients are as follows:
1) Randomly,first to generate two random sample sequences,then to compute the correlation coefficient of these two sample sequences after running filtering,and then to repeat the aforementioned steps 5,000 times. Finally,5,000 correlation coefficients were obtained after repetition.
2) Arranging the 5,000 correlation coefficients values from small to big,then to select the correlation coefficients of No. 5000×90%,5000×95% and 5000×99%,for reliability thresholds of 0.1 significant level,0.05 significant level,and 0.01 significant level,respectively.
3) To repeat the aforementioned steps 40 times,obtaining 40 correlation coefficient thresholds of 0.1 significant level,0.05 significant level,and 0.01 significant level,respectively. Then to average the 40 reliability thresholds of correlation coefficients for a required reliability thresholds for 0.1 significant level,0.05 significant level,and 0.01 significant level.
The method for computing the degree of freedom of new sample series after running filtering is described below(Zhao and Han,2005).
Supposing there is one discrete time series {x(nΔ)}(n = 0,1,2,…,k),Δ is the sample interval,the signal frequency value f of this data sequence is between fk and fn,the band width fw=fn−fk,and fn=1/(2Δ)is the upper frequency limit,and fk=1/(kΔ)is the lower frequency limit. Supposing the highest frequency is fh after running filtering and the lowest frequency is f1,then the passband width is fp=fh−f1. When the fp is wider,it means more signals could go through the passband and within less range of freedom degree decreases; when the fp is narrower,the parameters are reversed.
Set the ratio of the band widths fw before filtering to fp after filtering to be χ,then the new degree of freedom is one of the points χ before filtering.
For the raw data series of winter snow depth over the Tibetan Plateau for 51 years,{x(nΔ)}(n = 0,1,2,…,51),Δ is 1 year; after 11-year running mean filtering,the new data time series has been changed into {xf(Δn)}(6,7,8,…,46),Δ is 1 year.
The band width of original data series is
| ${{f}_{w}}={{f}_{n}}-{{f}_{k}}=\frac{1}{2\times 1}-\frac{1}{51\times 1}=0.48$ |
The band width of new data series after 11-year running filtering is
| ${{f}_{p}}={{f}_{h}}-{{f}_{1}}=\frac{1}{12}-\frac{1}{51}=0.06$ |
Then,
| $\frac{1}{\chi }=\frac{{{f}_{p}}}{{{f}_{w}}}=\frac{0.06}{0.48}=0.13$ |
Thus,the freedom degree of new data sequence is equal to that of the original sequence multiplied by 1/χ,which equals to 49×0.13=6.37≈6. Therefore,the freedom degree of new snow depth data series in winter for 51 years over the Tibetan Plateau after 11-year running filtering is close to 6.
3 Results 3.1 Interdecadal correlations of solar activity with Plateau snow depth and East Asia winter atmospheric circulationThe three solar parameters,SRF,SSN,and TSI,have different physical implications. The 10.7 cm SRF is close to the magnetism of the sun's active region and ultraviolet radiation. The SSN reflects the sun's magnetic field strength,and the TSI implies the atmosphere's solar total radiation intensity. The correlations of the three parameters with snow depth over the Tibetan Plateau and winter atmospheric circulation in East Asia are analyzed in this study.
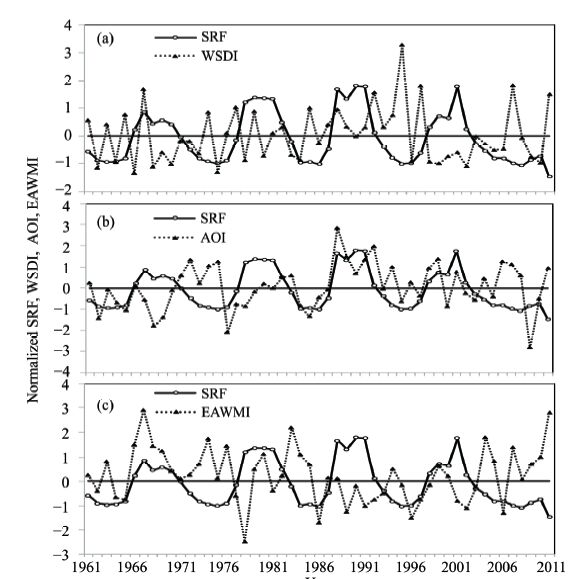
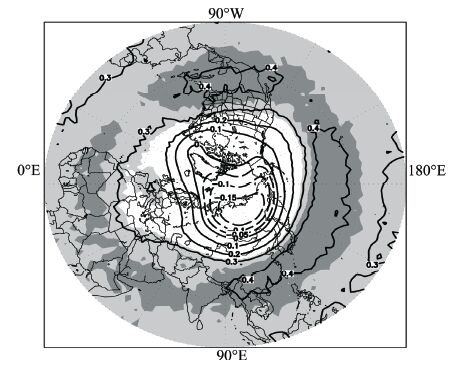
3.1.1 SRF correlating with Plateau snow depth and East Asia winter atmospheric circulation Figure 3 presents four time series of SRF,WSDI,AOI,and EAWMI from 1961 to 2011. The raw data correlation coefficients of SRF with WSDI,AOI and EAWMI are 0.1,0.23 and −0.18 respectively,showing nonsignificant correlations. After 9-year running filtering,the correlation coefficients of SRF with WSDI,AOI and EAWMI are 0.37,0.33 and 0.43,respectively. Because of freedom degree reducing,significance test could not be operated by T test,but could by the Monte Carlo method. After 9-year running filtering,the contemporary and lag correlation coefficients increase significantly but yet couldn't reach 0.1 significant level,implying that there was nonsignificant correlation if the sun's 11-year cycle was included.
|
| Figure 3 Time series of normalized Solar Radio Flux (SRF), Winter Snow Depth Index (WSDI), Arctic Oscillation Index (AOI) and East Asian Winter Monsoon Index (EAWMI) from 1961 to 2011 |
| Time delay (Year) | Reliability threshold | ||
| 90% | 95% | 99% | |
| 0 | 0.6807 | 0.7546 | 0.8542 |
| 1 | 0.6893 | 0.7619 | 0.8588 |
| 2 | 0.6962 | 0.7695 | 0.8665 |
| 3 | 0.7048 | 0.7770 | 0.8707 |
| 4 | 0.7119 | 0.7839 | 0.8751 |
| 5 | 0.7208 | 0.7912 | 0.8819 |
| 6 | 0.7285 | 0.7988 | 0.8867 |
| 7 | 0.7375 | 0.8059 | 0.8824 |
| 8 | 0.7467 | 0.8139 | 0.8968 |
| 9 | 0.7554 | 0.8215 | 0.9040 |
| 10 | 0.7666 | 0.8309 | 0.9080 |
| Time delay to SRF (Year) | WSDI | AOI | EAWMI |
| 0 | 0.6356 | 0.5184 | −0.5012 |
| 1 | 0.6928 | 0.6023 | −0.5629 |
| 2 | 0.7241* | 0.6182 | −0.6252 |
| 3 | 0.7675* | 0.6328 | −0.6903 |
| 4 | 0.8013** | 0.6507 | −0.7553* |
| 5 | 0.7868* | 0.7014 | −0.8245** |
| 6 | 0.7736* | 0.7690* | −0.8765** |
| 7 | 0.7132 | 0.8247** | −0.8991*** |
| 8 | 0.5755 | 0.8326** | −0.8714** |
| 9 | 0.4622 | 0.7775* | −0.7906* |
| 10 | 0.3267 | 0.6815 | −0.7072 |
| *indicates significant level above 0.1, **indicates above 0.05, ***indicates above 0.01. | |||
|
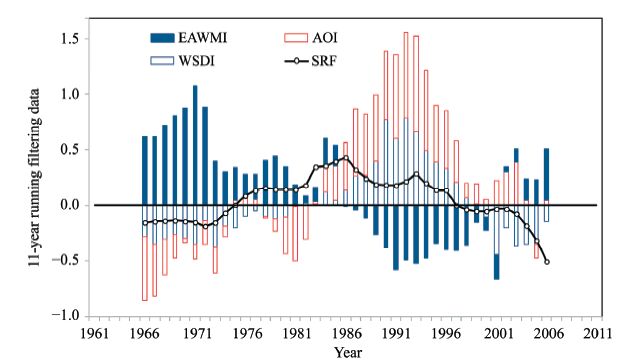
| Figure 4 Time series of Solar Radio Flux (SRF), Winter Snow Depth Index (WSDI), Arctic Oscillation Index (AOI) and East Asian Winter Monsoon Index (EAWMI) after 11-year running filtering from 1961 to 2011 |
|
| Figure 5 Correlations of Solar Radio Flux (SRF) with 50 hPa geopotential height not removing the sun's 11-year cycle (shallow and dark shadows indicate 0.05 and 0.01 significant levels, respectively) |
|
| Figure 6 Time series of normalized solar sunspot number (SSN) and total solar irradiance (TSI) 中文注解 |
| Time delay(Year) | WSDI | AOI | EAWMI | |||||
| SSN | TSI | SSN | TSI | SSN | TSI | |||
| 0 | 0.6061 | 0.4187 | 0.4916 | 0.24 | −0.4632 | −0.2747 | ||
| 1 | 0.6442 | 0.4115 | 0.5443 | 0.2787 | −0.5273 | −0.3220 | ||
| 2 | 0.6844 | 0.433 | 0.5638 | 0.2941 | −0.6067 | −0.3869 | ||
| 3 | 0.7346 | 0.4748 | 0.5843 | 0.3364 | −0.6831 | −0.4701 | ||
| 4 | 0.7656* | 0.5376 | 0.6217 | 0.4234 | −0.7549* | −0.5470 | ||
| 5 | 0.7748* | 0.6143 | 0.7049 | 0.5688 | −0.8150** | 0.6102 | ||
| 6 | 0.7564* | 0.6621* | 0.7949* | 0.7196 | −0.8594** | −0.6737 | ||
| 7 | 0.694 | 0.688 | 0.8578** | 0.8381** | −0.8714** | −0.7229 | ||
| 8 | 0.5822 | 0.6938 | 0.8532** | 0.9169*** | −0.8259** | −0.7483 | ||
| 9 | 0.4762 | 0.6706 | 0.7800* | 0.9005** | −0.7622* | −0.7634 | ||
| 10 | 0.3579 | 0.6246 | 0.6565 | 0.7973* | −0.7073 | −0.7990* | ||
| * indicates significance level of 0.1, ** 0.05, *** 0.01. | ||||||||
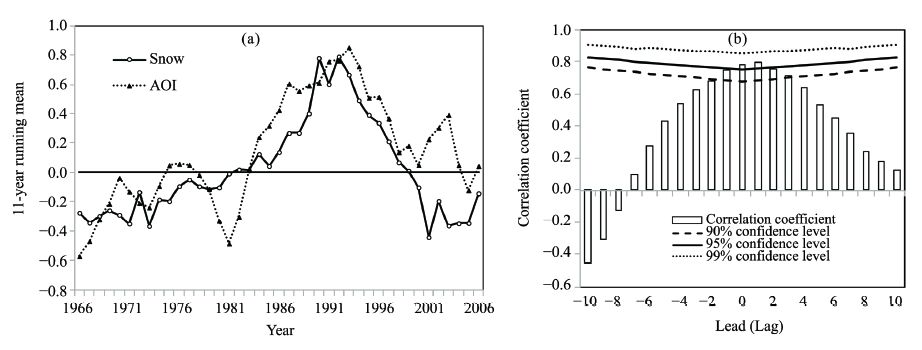
Figure 7 show the time series of WSDI and AOI after 11-year running filtering,and their lead and lag correlation coefficients. The lead 1-year correlation coefficient of WSDI ahead AOI reaches a peak value of 0.79 at 0.05 significance test level(Figure 7b); and the other correlation coefficients are less than this value,which means that snow depth over the plateau can adjust the Arctic Oscillation. In addition,their contemporaneous correlation coefficient reaches 0.78 at 0.05 significance test level,showing that,on interdecadal time scale,there exist a lead and lag positive correlation between plateau snow and Arctic Oscillation. The plateau snow is an external forcing factor for atmospheric circulation,such that abnormal snow can cause atmospheric circulation anomalies,which might affect the Arctic Oscillation.
|
| Figure 7 11-year running mean time series of WSDI and AOI (a) and lead and lag correlation coefficients of WSDI and AOI (b) |
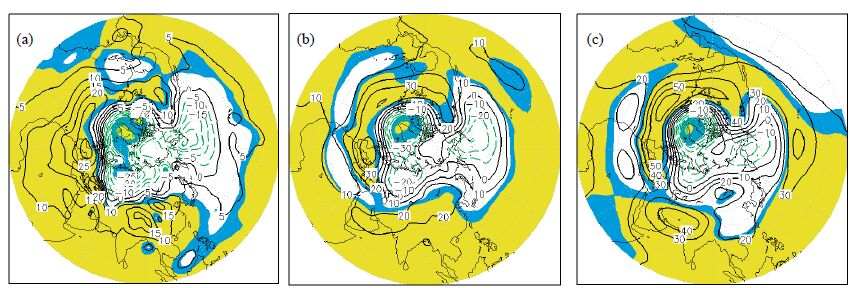
On interdecadal time scale,the correlation between plateau snow and Arctic Oscillation is positive. Song et al.(2011)indicated that the Tibetan Plateau accumulated less snow during 1961–1980 and more snow during 1981–2000. Accordingly,the arctic annular mode at 1,000,500 and 200 hPa showed that the Arctic Oscillation was at negative phase in 1961–1980 and at positive phase in 1981–2000(Figure 8).
|
| Figure 8 The difference of geopotential height on 850 hPa (a), 500 hPa (b) and 200 hPa (c) respectively between 1981–2000 and 1961–1980 and T test (the blue shaded area denotes over 0.05 significant level, and the yellow shaded area means over 0.01 significant level) |
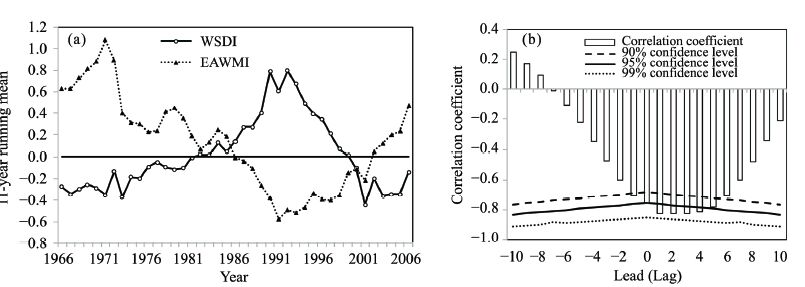
Figure 9 is the 11-year running mean time series of WSDI and EAWMI. The lead 2-year correlation coefficient of WSDI ahead EAWMI reaches a valley value of −0.83 at 0.05 significance test level. All the other correlation coefficients are smaller than this absolute value,which indicates that the plateau snow changes ahead of the winter monsoon. The contemporary correlation coefficient reaches −0.76 at 0.05 significance test level,indicating significant contemporary and lag negative correlation on interdecadal time scale. As the external forcing factor,abnormal plateau snow might cause anomalous atmospheric circulation and cold air mass,these could result in anomalous winter monsoon.
|
| Figure 9 11-year running mean of WSDI and EAWMI (a), and lead and lag correlation coefficients of WSDI and EAWMI (b) |
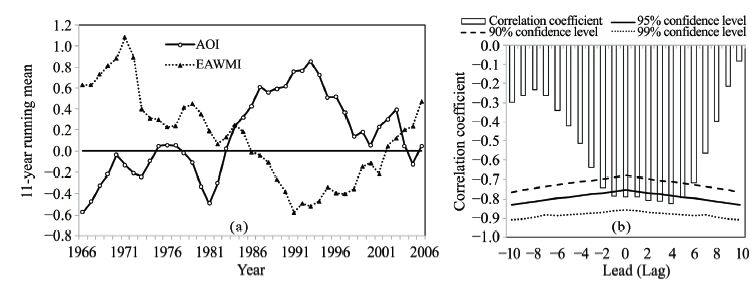
Figure 10 is the 11-year running mean time series of AOI and EAWMI. It can be found that the lead 4-year correlation coefficient of Arctic Oscillation ahead the winter monsoon has a peak value of −0.82 at 0.05 significant level. All the other correlation coefficients are smaller than this absolute value,indicating that Arctic Oscillation changes ahead of the East Asian winter monsoon. There exists significant contemporary and lag negative correlations on interdecadal time scale. The positive phase of Arctic Oscillation is subject to stronger zonal circulation in the northern hemisphere,and the exchange of air masses between high and mid-latitudes is weaker,which causes warm winter in East Asia and weak winter monsoon,and vice versa.
|
| Figure 10 11-year running mean of AOI and EAWMI (a), and lead and lag correlation coefficients of AOI and EAWMI (b) |
To summarize,the plateau snow changes ahead of Arctic Oscillation and East Asia winter monsoon on interdecadal time scale,and Arctic Oscillation changes ahead of winter monsoon,all of them are regulated by solar activity.
4 Discussion and summaryThis paper provides useful preliminary conclusions on study of solar activity adjusting Tibetan Plateau snow depth and East Asian winter circulation on longer time scale(not including the 11-year cycle). The results suggest that the influence of solar activity may not be as people commonly think that the 11-year cycle signal of high frequency is more obvious and important,but on interdecadal time scale it modulates the climate system. Power spectral analysis shows that,after removing the sun's 11-year cycle,all of solar radio flux,plateau snow depth,Arctic Oscillation and East Asian winter monsoon have an apparent 32-year cycle,and the correlation between solar radio flux and plateau snow depth reaches the confidence level of 95%. This verifies that they have the same period signals on long time scale,and the change of plateau winter snow is closely related to solar activity on interdecadal time scale. Abnormal solar activity breaks the thermal balance in the stratosphere,and results in changes of thermodynamic fields and atmospheric circulation state. Then,interaction between troposphere and stratosphere occurs,causing anomalous tropospheric atmospheric circulation,which drives anomalous plateau snow depth,and impacts the phase of Arctic Oscillation and the East Asian winter monsoon. Of course,the cumulative and enlarged effect of solar activity also plays an important role in this process. For instance,the oceanic response to solar activity will exert feedback effect to atmosphere,causing changes in atmospheric circulation and abnormal Tibetan Plateau snow depth. The physical mechanism and processes need further in-depth study.
Although the snow depth data series over the Tibetan Plateau used in this study is not enough long,after 11-year moving filtering process the number of freedom degree reduces. Thus,the statistical results tested by the Monte-Carlo method in this paper are meaningful and credible. Based on statistical correlation analyses,we obtained the following conclusions in this study:
(1)There is no obvious link between the raw data series of solar activity,Tibetan Plateau snow depth,and East Asian winter circulation,and even after 9-year running filtering. But,after 11-year running filtering,the interdecadal correlations of solar activity with snow depth,Arctic Oscillation and East Asian winter monsoon are improved greatly. When solar activity is stronger,there is an increased plateau winter snow,the Arctic Oscillation is at positive phase,the East Asian atmospheric zonal circulation intensifies,and the East Asian winter monsoon is weaker,when solar activity is weaker,the parameters are reversed.
(2)The winter snow depth over the Tibetan Plateau has significantly contemporary and lag correlations with Arctic Oscillation and East Asian winter monsoon after 11-year running filtering. With increased winter snow,the phase of Arctic Oscillation is positive and the East Asian winter monsoon is weak,and with decreased winter snow,the parameters are reversed. On interdecadal time scale,winter snow depth over the Tibetan Plateau changes ahead of Arctic Oscillation and East Asian winter monsoon.
Acknowledgments:The authors thank Dr. XueBin Zhang from Canada,for his help with the statistical significance test; Dr. HaoMing Yan from the State Key Laboratory of Geodesy and Earth's Dynamics of China,for help with the Monte-Carlo method; Dr. ZhiQiang Yin from National Astronomical Observatories of Chinese Academy of Science,for supporting us with the TSI reconstruction data; and Dr. Lan Yi from Chinese Meteorological Society for valuable comments and discussions. This research was funded by the National Science Foundation of China(No. 41575091)and the National Basic Research and Development(973)Program of China(Grant No. 2012CB957803 and No. 2012CB957804).
| Chen W, Zhou Q, 2012. Modulation of the Arctic Oscillation and the East Asian winter climate relationships by the 11-year solar cycle. Advances in Atmospheric Sciences, 29(2): 217–226. doi: 10.1007/s00376-011-1095-3 |
| Chen X, Liu J, Wang SM, 2005. Climate simulation of Little Ice Age over Eastern Asia. Scientia Meteorologica Sinica, 25(1): 1–7. |
| Coughlin KT, Tung KK, 2004. Eleven year solar cycle throughout the lower atmosphere. Journal of Geophysical Research, 109: D21105. doi: 10.1029/2004JD009873 |
| Dansgaard W, Johnsen SJ, Moiler J, et al, 1969. One thousand centuries of climatic record from camp century on the Greenland ice sheet. Science, 116: 377–380. |
| Elizabeth Nesme-Ribes, 1995. The maunder minimum and the deepest phase of the Little Ice Age. Solar Output and Climate during the Holocene. German, 14: 131–144. |
| Foukal P, Frohlich C, Spruit H, et al, 2006. Variations in solar luminosity and their effect on the Earth's climate. Nature, 443: 161–166. doi: 10.1038/nature05072 |
| Friis-Christensen E, Lassen K, 1991. Length of the solar cycle: An indicator of solar activity closely associated with climate. Science, 254: 698–700. doi: 10.1126/science.254.5032.698 |
| Gimeno L, de la Torre L, Nieto R, et al, 2003. Changes in the relationship NAO-Northern hemisphere temperature due to solar activity. Earth Planetary Science Letter, 206: 15–20. doi: 10.1016/S0012-821X(02)01090-7 |
| Gleisner H, Thejll P, 2003. Patterns of tropospheric response to solar variability. Geophysical Research Letters, 30(13): 1711. doi: 10.1029/2003GL017129 |
| Gray LJ, Beer J, Geller M, et al, 2010. Solar influences on climate. Reviews of Geophysics, 48: RG4001. doi: 10.1029/2009RG000282 |
| Gu ZN, 1991. The effect of solar activity on the terrestrial climateand earth rotation. Progress in Astronomy, 9(1): 51–59. |
| Haigh JD, 1996. The impact of solar variability on climate. Science, 272: 981–985. doi: 10.1126/science.272.5264.981 |
| Huth R, Bochníek J, Hejda P, 2007. The 11-year solar cycle affects the intensity and annularity of the Arctic Oscillation. Journal of Atmospheric and Solar -Terrestrial Physics, 69: 1095–1109. doi: 10.1016/j.jastp.2007.03.006 |
| Ineson S, Scaife AA, Knight JR, et al, 2011. Solar forcing of winter climate variability in the Northern Hemisphere. Nature Geoscience, 4: 753–757. doi: 10.1038/NGEO1282 |
| IPCC, 2013. Climate Change 2013: the Physical Science Basis.Cambridge: Cambridge University Press, in press, [2014-02-10]. http://www.climatechange2013.org/images/uploads/WGIAR5_WGI-12Doc2b_FinalDraft_All.pdf. |
| Jiang YM, Peng GX, Shao XD, 2011. Natural drive is the important factor of global climate change. Meteorological and Environmental Sciences, 34(2): 7–13. |
| Kalnay E, Kanamitsu M, Kistler R, et al, 1996. The NCEP/NCAR 40-year reanalysis project. Bulletin of the American Meteorological Society, 77: 437–471. doi: 10.1175/1520-0477(1996)077<0437:TNYRP>2.0.CO;2 |
| Kodera K, 2002. Solar cycle modulation of the North Atlantic Oscillation: Implication in the spatial structure of the NAO. Geophysical Research Letters, 29(8): 591–594. doi: 10.1029/2001GL014557 |
| Kodera K, Coughlin K, Arakawa O, 2007. Possible modulation of the connection between the Pacific and Indian Ocean variability by the solar cycle. Geophysical Research Letters, 34: L03710. doi: 10.1029/2006GL027827 |
| Kunitomo S, Mikami T, 1992. Solar activity during the Little Ice Age. In: Proceedings of the International Symposium on the Little Ice Age Climate. Tokyo, Japan: Department of Geography, Tokyo Metropolitan University,: 337–340. |
| Lean J, Beer F, Bradley R, 1995. Reconstruction of solar irradiance since 1610: Implications for climate change. Geophysical Research Letters, 22: 3195–3198. doi: 10.1029/95GL03093 |
| Lean J, Rind D, 2001. Earth's response to a variable Sun. Science, 292: 234–236. doi: 10.1126/science.1060082 |
| Lockwood M, Bell C, Woollings T, et al, 2010. Top-down solar modulation of climate: evidence for centennial-scale change. Environmental Research Letters, 5: 034008. doi: 10.1088/1748-9326/5/3/0340089pp |
| Lv JM, Ju JH, Kim SJ, et al, 2008. Arctic Oscillation and the autumn/winter snow depth over the Tibetan Plateau. Journal of Geophysical Research, 113: D1411. doi: 10.1029/2007JD009567 |
| Mann ME, Zhang Z, Rutherford S, et al, 2009. Global signatures of the Little Ice Age and Medieval climate anomaly and plausible dynamical origins. Science, 326: 1256–1260. doi: 10.1126/science.1177303 |
| Ogi M, Yamazaki K, Tachibana Y, 2003. Solar cycle modulation of the seasonal linkage of the North Atlantic Oscillation (NAO). Geophysical Research Letters, 30(22): 2170. doi: 10.1029/2003GL018545 |
| Perry CA, 1994. Solar-irradiance variations and regional precipitation fluctuations in the western USA. International Journal of Climatology, 14: 969–984. doi: 10.1002/(ISSN)1097-0088 |
| Qu WZ, Li YF, Li C, et al, 2014. Periodic analysis of solar activity and its link with the Arctic oscillation phenomenon. The Astronomical Journal, 148(6): 128. doi: 10.1088/0004-6256/148/6/128 |
| Sfîcă AL, Voiculescu M, 2014. Possible effects of atmospheric teleconnections and solar variability on tropospheric and stratospheric temperatures in the Northern Hemisphere. Journal of Atmospheric and Solar-Terrestrial Physics, 109: 7–14. doi: 10.1016/j.jastp.2013.12.021 |
| Shindell DT, Schmidt GA, Mann ME, et al, 2001. Solar forcing of regional climate change during the Maunder minimum. Science, 294: 2149–2152. doi: 10.1126/science.1064363 |
| Slonosky VC, Jones PD, Davies TD, 2001. Instrumental pressure observation from the 17th and 18th centuries: London and Paris. International Journal of Climatology, 21: 285–298. doi: 10.1002/joc.611 |
| Solomon S, Qin D, Manning M, et al, 2007. Contribution of Working Group I to the Fourth Assessment Report of the Intergovernmental Panel on Climate Change. New York: Cambridge University Press: 996. |
| Song Y, Ji JJ, Wang YB, et al, 2003. Reviews on Little Ice Age climate and approach to its mechanism. Meteorological Monthly, 29(7): 3–6. |
| Song Y, Zhang J, Li ZC, et al, 2011. Interdecadal change of winter snow depth on Tibetan Plateau and its effect on summer precipitation in China. Plateau Meteorology, 30(4): 843–851. |
| Souza Echer MP, Echer E, Nordemann DJ, et al, 2009. Multiresolution analysis of global surface air temperature and solar activity relationship. Journal of Atmospheric and Solar - Terrestrial Physics, 71(1): 41–44. doi: 10.1016/j.jastp.2008.09.032 |
| Svensmark H, 2007. Cosmoclimatology: A new theory emerges. Astronomy & Geophysics, 48: 118–124. |
| Tang MC, Liu YX, Guo WD, 2001. Climatic condition and Chinese history (I): SCL and Chinese climate. Plateau Meteorology, 20(4): 368–373. |
| Van Loon H, Shea DJ, 2000. The global 11-year solar signal in July-August. Geophysical Research Letters, 27: 2965–2968. doi: 10.1029/2000GL003764 |
| Wang L, Chen W, 2010. How well do existing indices measure the strength of the East Asian winter monsoon?. Advances in Atmospheric Sciences, 27(4): 855–870. doi: 10.1007/s00376-009-9094-3 |
| Weng HY, 2003. Impact of the 11-year solar activity on the QBO in the climate system. Advances in Atmospheric Sciences, 20: 303–309. doi: 10.1007/s00376-003-0017-4 |
| Weng HY, 2012. A few closely-related literatures have not been referenced. For example, Impacts of multi-scale solar activity on climate. Part I: Atmospheric circulation patterns and climate extremes. Advances in Atmospheric Sciences, 29(4): 867–886. |
| Xiao ZN, Zhong Q, Yin ZQ, et al, 2013. Advances in the research of impact of decadal solar cycle on modern climate. Advances in Earth Science, 28(12): 1335–1348. |
| Xu Q, 2010. Causal analysis and prospects on climate trend of global temperature and recent climate disasters in China. Scientia Meteorologica Sinica, 30(5): 582–590. |
| Yan HM, Zhong M, Zhu YZ, 2003. The determination of degrees of freedom for digital filtered time series-An application in the correlation analysis between length of day variation and SOI. Acta Astronomica Sinica, 44(3): 324–329. |
| Yang B, Shi YF, Zhou QB, 2002. Analyzing the effect of solar and volcanic activities on temperature variations in the Guliya ice core record and in the lower reaches of the Yangtze River over the last three centuries. Journal of Glaciology and Geocryology, 24(1): 40–45. |
| Zhang L, Wang C, Fu SY, 2011. Solar variation and global climate change. Chinese Journal of Space Science, 31(5): 549–566. |
| Zhao J, Han YB, 2005. Estimation of correlation significance levels after moving average. Journal of Beijing Normal University (Natural Science), 41(2): 139–141. |
| Zhao J, Han YB, 2012. Sun's total irradiance reconstruction based on multiple solar indices. Science China-Physics Mechanics & Astronomy, 55: 179–186. doi: 10.1007/s11433-011-4496-5.(inChinese) |
| Zhao J, Li ZA, Han YB, 1999. Effect of solar activity and El nino for rainfall in Beijing and prediction of the rainfall. Progress in Geophysics, 14(1): 123–126. |
| Zhao L, Xu Y, Wang JS, et al, 2011. Progress in studies on the influence of solar activity on climate change during the last 100 years. Advances in Meteorological Science and Technology, 1(4): 37–48. |
| Zhao XH, Feng XS, 2014. Periodicities of solar activity and the surface temperature variation of the Earth and their correlations. Chinese Science Bulletin, 59(14): 1284–1292. doi: 10.1360/972013-1089 |
| Zhao ZC, Luo Y, Huang JB, 2013. Effects of sunspot on the multi- decadal climate projections. Advances in Climate Change Research, 9(5): 379–382. |
| Zhou Q, Chen W, 2014. Impact of the 11-year solar cycle on the relationship between the East Asian winter monsoon and the following summer monsoon and the related processes. Climatic and Environmental Research, 19(4): 486–496. |
| Zhou Q, Chen W, Zhou W, 2013. Solar cycle modulation of the ENSO impact on the winter climate of East Asia. Journal of Geophysical Research, 118: 5111–5119. |
| Zhou YH, Zheng DW, 1999. Monte carlo simulation tests of correlation significance levels. Acta Geodaeticaet Cartographic Sinica, 28(4): 313–318. |
| Zhu KZ, 1973. A preliminary study on the climatic fluctuations during the last 5000 years in China. Science in China, 16: 168–189. |
| Zhu YF, 2008. An index of East Asian winter monsoon applied to the description of China's mainland winter temperature changes. Acta Meteorologica, 22(4): 522–529. |
| Zhu YX, Ding YH, Xu HG, 2007. The decadal relationship between atmospheric heat source of winter and spring snow over Tibetan Plateau and rainfall in east China. Acta Meteorologica, 65(6): 946–958. |
 2016, 8


