Article Information
- Ji Cheni, JingYi Zhao, Kun Li, Yu Sheng . 2016.
- Discussion on applying an analytical method to optimize the anti-freeze design parameters for underground water pipelines in seasonally frozen areas
- Sciences in Cold and Arid Regions, 8(6): 467-476
- http://dx.doi.org/10.3724/SP.J.1226.2016.00467
Article History
- Received: June 12, 2016
- Accepted: August 17, 2016
2. Beiluhe Observation Station of Frozen Soil Environment and Engineering, Northwest Institute of Eco-environment and Resources, Chinese Academy of Science, Lanzhou, Gansu 730000, China;
3. School of Civil Engineering and Architecture, Southwest Petroleum University, Chengdu, Sichuan 610500, China
Seasonally frozen ground covers 20%~25% of the Earth's land surface(Zhou et al.,2000; French,2007). More inhabitants exist and more human activities are performed on seasonally frozen grounds than in permafrost regions. For example,in seasonally frozen area of China the total population is about 420 million, of which the rural and pastoral population is approximately 300 million(Li,2012). Currently,engineered water supplies in the majority of the rural areas are developing more slowly relative to the densely populated cities,although they are currently changing from being decentralized to being centralized. How ever,there is still a particularly large gap in the quality and quantity of safe drinking water in these areas. Therefore,water pipeline supply projects are being vigorously implemented to improve the water deficits in these areas(Meng et al.,2005). Damages from freezing,including pipe jacking(uplift)and pipeline blockages,often occur in pipelines in seasonally frozen areas(Jin et al.,2005; Li et al.,2006; Yang et al., 2009).Water pipelines are generally buried in the ground to protect them from such damages and the buried depth should be determined by the maximum frozen penetration(MFP)in seasonally frozen areas according to the design codes for water pipelines. The top of any pipeline should be deeper than the MFP (Shanghai Municipal Engineering Institute,2006), which varies from less than 1.0 m to approximately 4.0 m according to the latitude,altitude,and local factors(Zhou et al.,2000). A pipeline is usually buried beneath the MFP in a seasonally frozen area with an MFP <1.0 m,where strong anti-freeze measures are usually not necessary; this can lower the costs of construction,operation,and maintenance. In seasonally frozen areas with MFP >2.0 m,the adoption of thermal insulators and a deeper buried depth can effectively reduce,or even eliminate frost damages; however,this increases the investment cost and the difficulty of maintenance,and prolongs the construction time(Yang,1996).
Aside from the buried depth,the costs of construction and operation are also affected by other factors, such as pipeline diameter,water flow velocity, and inlet water temperature(Yang and Zhang,1996). Reasonably optimizing the design parameters to prevent frost damages in seasonally frozen areas is significant, especially in farming and pasture areas. In the current construction planning in farming and pasture areas in China,underground bare water pipelines are recommended. Therefore,a reasonable reduction of the buried depth is the key for optimizing the design parameters for underground bare pipelines.
Determining the safe conveyance distance(SCD) of a water pipeline under different conditions is the basis of reasonably reducing the buried depth,and the numerical method can be used to calculate the SCD (Spade,1973; Hooker,1978; Swamee and Prabhata, 1993; Nixon and MacInnes,1996; Li et al.,2010). This method is suitable for simple working conditions, but the optimization of the design parameters for a water pipeline faces a great many working conditions. According to the research results obtained by Chen et al.(2014),six factors exert a significant influence on the SCD. If three scenarios were considered for each factor,there would be 729 possible working conditions for analysis. Because even three scenarios for each factor may not be enough to complete a buried pipeline optimization,the numerical method is not an ideal technique for optimizing the design parameters of underground pipelines because of the enormous calculations necessary.
In contrast,the analytical method is widely applied in the design of oil pipelines because of its simple calculation processes,which can include the Coulter-Bardon,Sukhov,Leapienzon,and other improved formulae(Coulter and Bardon,1979; De, 1994; Yang and Zhang,1996; Xiao et al.,2000; Wang,2002; Liu et al.,2003; Wang and Wu,2005). Many thermal parameters are necessary for all the above-mentioned formulae,including thermal capacity, thermal conductivities,soil temperature,mean annual ground surface temperature(MAGST),and other factors,to acquire the SCD and water temperature regularities along the pipeline. However,in the current design of water pipelines in seasonally frozen areas,only the MFP is investigated. Engineers engaged in water pipeline design and construction generally do not test the soil properties or monitor the ground temperature,and the abovementioned analytical method is seldom used to optimize the design parameters of underground water pipelines.
Therefore,a simple analytical method to determine the SCD is explicated in this paper to guide the design and construction of underground water supply pipelines in seasonally frozen areas. This method only requires several easy-to-access parameters,such as the MFP,the buried depth,the pipeline diameter,the flow velocity,and the inlet water temperature.
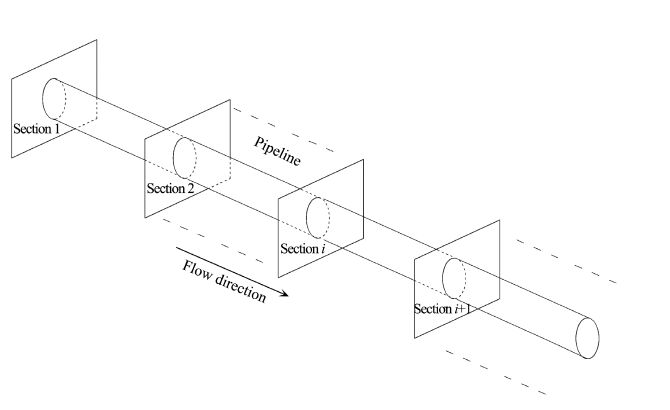
2 Method 2.1 The Quasi-3D ModelQuasi-3D model has been applied to predicting the pipeline temperature profiles for buried oil and water pipelines in many areas of the world(Nixon and MacInnes,1996; Li et al.,2010). Ordinary 3D model is established based on a three-dimensional heat conduction equation. The temperature and heat flux of the pipeline wall at any section and anytime can be calculated directly. However,it is unsuitable to solve the linear engineering because of huge calculation and abnormal grid. In the method of Quasi-3d model,the buried pipelines are virtually divided into a set of sections along the axial direction,and the heat exchange intensity between the pipeline and the surrounding soil is assumed to be the same between the adjacent sections at the same time(Figure 1). Hence,the pipeline- soil heat exchange for each section can be calculated using a two-dimensional heat conduction equation with phase change. The heat flux density between the pipeline and the soil is calculated by this method. This method also assumes that the water temperature in the pipeline is constant for each section,and is equal to that of the external surface of the pipeline wall. According to the principle of energy conservation, variation in the water temperature in the pipeline can be calculated from the pipe-soil heat exchange between the adjacent sections. Thus,the water tempera ture is calculated as:
|
| Figure 1 Water temperature calculation based on the Quasi-3D numerical method (from Nixon and MacInnes,1996) |
| ${{T}_{i+1}}={{T}_{i}}+\frac{2{{q}_{i}}{{t}_{i}}}{r{{\rho }_{w}}{{C}_{w}}}$ | (1) |
where Ti and Ti+1 are the water temperature of the ith and(i+1)th sections,respectively(unit: ℃); qi is the heat flux density between the pipeline and the soil (unit: W/m2),which is positive for absorbing heat and negative for releasing heat in the pipeline; ti is the time of the water in the pipeline flowing from the ith section to the(i+1)th section(unit: s); r is the radius of the pipeline(unit: m); ρw is the density(unit: kg/m3); and Cw is the specific heat of water(unit: J/(kg·℃)).
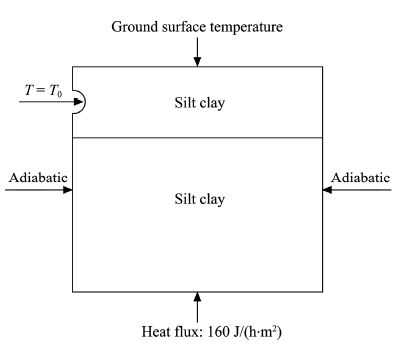
2.2 ParametersTo determine the variation in the water temperature under different working conditions,the division of the pipeline sections is simplified into a set of sections at intervals of 1 km. For the geometric model of the inlet section(Figure 2),the width of the section is 20 m and the depth is 20 m. The soil under the surface is divided into two types,the 4-m-silt and 16-m-silt clay. The top border and the pipeline wall comprise the first boundary condition in the model,which are the ground surface temperature and water temperature of the pipeline,respectively. The second boundary condition includes the left and right margins and the lower boundary. For the second boundary condition, the heat flux density of the left and right margins is zero and is called the adiabatic boundary; the heat flux density of the lower boundary is 160 J/(h·m2) with the assumption of a stable geothermal gradient of 0.04 ℃/m.
|
| Figure 2 Geometric model of inlet section |
Single-factor analysis is carried out to discern the influence of each factor on the water temperature, following these general notes for all the parameters:
• Mean annual ground surface temperature: 1 ℃
• Annual amplitude of ground surface temperature: 20 ℃
• Wave equation of ground surface temperature:
| $T=1.0+20\sin \left( \frac{2\pi }{8760}t+\frac{\pi }{2} \right)$ |
• Buried depth of pipeline: 1.5 m
• Pipeline diameter: 0.1 m
• Flow velocity: 1 m/s
• Inlet pipeline temperature: 1 ℃
• Water content in the upper and lower layers of the silt clay: 15%
• Dry density of the silt clay: 1,600 kg/m3
Soil moisture is a main factor affecting the thermal physical properties. Table 1 shows the thermal conductivity and specific heat capacity of the silt clay with different water contents and freezing conditions, and Table 2 shows the enthalpy per unit volume of silt clay with the different water contents and temperatures.
| SWC | (%) | Cu(J/(kg·℃)) | Cf(J/(kg·℃)) | λu(W/(m·k)) |
| 10 | 1,378.0 | 1,064.0 | 0.78 | 0.74 |
| 15 | 1,272.8 | 1,109.1 | 1.11 | 1.02 |
| 20 | 1,394.0 | 1,150.0 | 1.24 | 1.38 |
| 25 | 1,505.0 | 1,187.7 | 1.28 | 1.80 |
| 30 | 1,608.0 | 1,222.0 | 1.42 | 2.12 |
| Note: SWC is the soil water content; and Cu, Cf a re the specific heat capacity of frozen soil and thawed soil, respectively; λu and λf are the thermal conductivity of frozen soil and thawed soil, respectively. | ||||
| SWC(%) | −40.0℃ | −1.0℃ | −0.5℃ | 0.0℃ | 40.0℃ |
| 10 | 0 | 0.76 | 0.90 | 1.03 | 1.92 |
| 15 | 0 | 0.80 | 1.21 | 1.76 | 2.70 |
| 20 | 0 | 0.83 | 1.47 | 2.55 | 3.49 |
| 25 | 0 | 0.87 | 1.81 | 3.42 | 4.44 |
| 35 | 0 | 0.93 | 2.41 | 5.10 | 6.20 |
| Note: SWC is the soil water content. | |||||
In the calculation,the initial conditions for each section are obtained using the following method. A one-dimensional geometric model is established in which the boundary conditions,parameters,and the vertical divisions of the node are the same as those mentioned above,except that the temperature of each node is temporarily set at 0 ℃. Then the variation in the temperature field with time is calculated using the model presented above. When the temperature field calculated using the model is stable,the temperature of each node corresponding to the date is taken as the initial temperature of the pipeline in the two-dimensional model.
2.3 Data processingThe lowest water temperature(LWT)determines the SCD. The main aim of simulating the temperature field of a pipeline and its surrounding soil is to understand the regularities of the LWT changing with the conveyance distance. Here,the LWT refers to the minimum temperature in a whole year. The LWTs of different sections are calculated using the temperature field analysis module of the finite element program ANSYS,based on the geometric model,boundary conditions,initial conditions,and other physical parameters selected above. Simulation often reveals that the LWTs of different sections are different,but there are almost no time differences between the dates for achieving the LWTs of different sections. In addition, the LWTs usually become stable two years after the pipelines are buried(Li,2012),so the following analyses and conclusions are all based on the LWTs obtained in the second year after construction.
3 ResultsBased on the numerical simulations,the influences of the soil moisture,surface temperature,pipeline depth,diameter,velocity,and inlet water temperature on the LWTs and SCDs of the pipeline are analyzed.
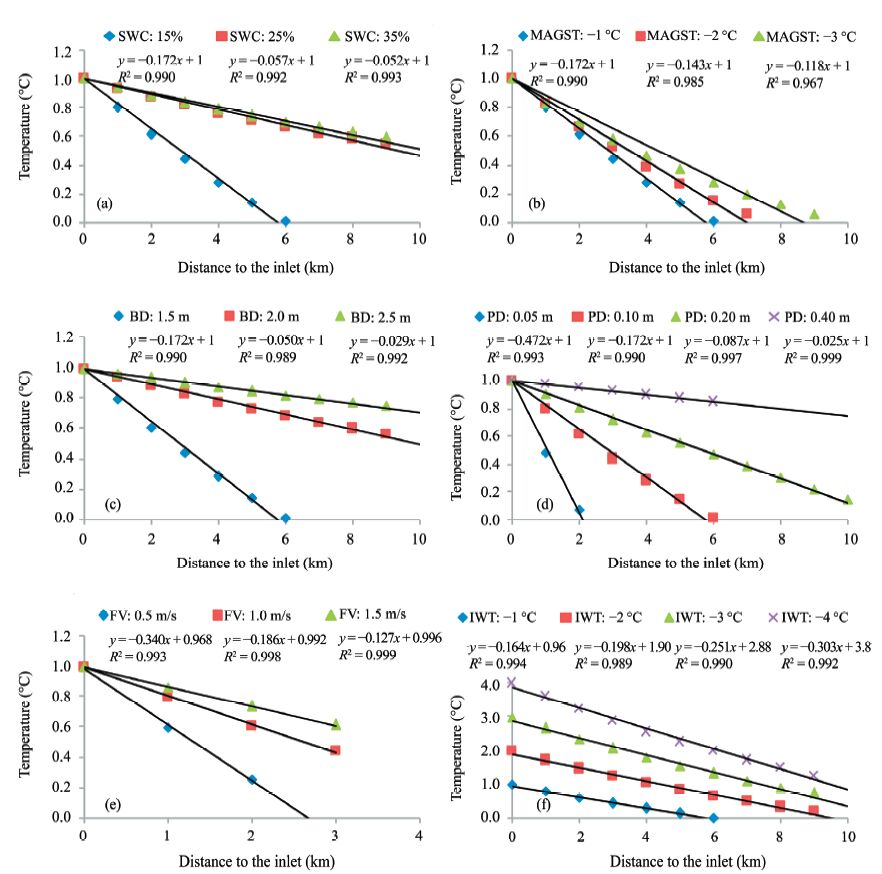
3.1 LWTs along the pipeline axis directionFigure 3 shows that the LWTs all decrease as the transport distance increases. The cooling rates corresponding to the soil moistures of 15%,25%,and 35% are 0.172,0.057,and 0.052 ℃/km,respectively. In Figure 3b,the cooling rates corresponding to the surface temperatures of 1,2,and 3 ℃ are 0.172, 0.143 and 0.118 ℃/km,respectively. Figure 3c shows that the cooling rates of LWTs decline as the buried depths increase. Corresponding to the buried depths of 1.5,2.0,and 2.5 m,the decline rates of LWT are 0.164,0.048,and 0.027 ℃/km,respec tively. In Figure 3d,the cooling rates corresponding to the pipeline diameters of 0.05,0.10,0.20,and 0.40 m are 0.472,0.172,0.087 and 0.025 ℃/km, respectively.
|
| Figure 3 Influence of various factors on LWTs distributed along the pipeline axis direction. (a) Soil water content (SWC), (b) mean annual ground surface temperature (MAGST), (c) buried depth (BD), (d) pipeline diameter (PD), (e) flow velocity (FV), (f) inlet water temperature (IWT) |
As shown in Figure 3e,the cooling rates corresponding to the velocities of 0.5,1.0,and 1.5 m/s are 0.340,0.186,and 0.127 ℃/km,respectively. The relationship between the flow velocity (V) and the cooling rate (g) can be expressed as g=0.185/V. In Figure 3f,the inlet temperatures of 1,2,3,and 4 ℃ correspond to the cooling rates of 0.164,0.198,0.251 and 0.303 ℃/km,respectively. The relationship between the inlet temperature(T0)and the cooling rate (g)can be expressed as g=0.132e0.207T0.
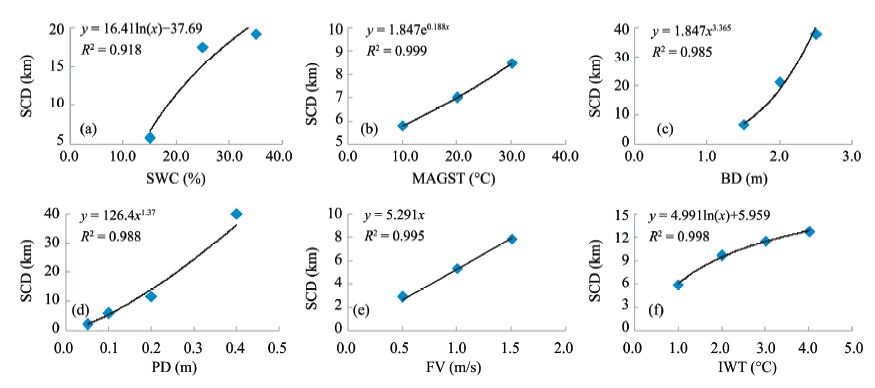
3.2 SCD of the water pipelineThe LWT fitting formulae given in Figure 3 show that the correlations between LWT and the six factors are all very strong,with R2>0.96,p<0.001,assuming that the SCD corresponds to the section with LWT = 0 ℃. Based on these fitting formulae,we calculated the SCDs of 20 kinds of working conditions(Figure 4). Through further fitting between the SCDs and the above six factors,the following formulae pertaining to SCD were derived:
| ${{L}_{SCD}}=16.41\ln \left( w \right)-37.69,{{R}^{2}}=0.918$ | (2) |
| ${{L}_{SCD}}=4.809{{\text{e}}^{0.188{{T}_{MAGST}}}},{{R}^{2}}=0.999$ | (3) |
| ${{L}_{SCD}}=1.84h_{b}^{3.365},{{R}^{2}}=0.985$ | (4) |
| ${{L}_{SCD}}=126.4{{D}^{1.370}},{{R}^{2}}=0.988$ | (5) |
| ${{L}_{SCD}}=5.291V,{{R}^{2}}=0.995$ | (6) |
| ${{L}_{SCD}}=4.991\ln \left( {{T}_{IWT}} \right)+5.959,{{R}^{2}}=0.998$ | (7) |
|
| Figure 4 Fitting correlations of the SCDs with single factors based on the numerical simulation |
In these fitting formulae,LSCD is the SCD(unit: km); w is the water content of topsoil(unit: %); TMAGST is the mean annual ground surface temperature MAGST(unit: ℃); hb is the buried depth of the pipeline (unit: m); D is the pipeline diameter(unit: m); V is the flow velocity(unit: m/s); and TIWT is the inlet water temperature(unit: ℃).
These formulae and Figure 4 show that the SCDs consecutively increase with the increase of all six factors. In the formulae,the R2 values are all >0.9, which means that the SCDs have strong and positive relationships with the SWC,MAGST,buried depth, pipeline diameter,flow velocity,and inlet water temperature.
4 Discussions 4.1 Feasibility of adopting the MFP to optimize the design parametersThe above analyses show that the SCD of an underground pipeline can be acquired from the LWTs in a whole year,and it is closely related with the MAGST and SWC above the pipeline. Coincidentally,the MFP also depends on the MAGST and the topsoil properties (Zhou et al.,2000),which implies that adopting the MFP instead of the MAGST and SWC to calculate the SCD may be feasible. The following optimization method based on the MFP is in accordance with the design principles used in the code(Shanghai Municipal Engineering Institute,2006),which is easily understood and adopted by engineers engaged in the design and construction of water pipelines.
To determine the feasibility of the optimizing method based on the MFP,we first developed three MAGST and SWC combinations using Quasi-3D numerical simulation experiments,which all had the same MFP(hf 1). Then the SCDs at three different buried depths were calculated according to the above MAGST and SWC combinations. Then,following Li,(2012),we decided that using the MFP to optimize the design parameters would not be feasible if there were differences of more than 50% among the calculated SCDs under the same buried depth. Otherwise,the SCDs were calculated under the conditions of two MFPs(hf 2 and hf3),different MAGST and SWC combinations,and different buried depths. In the end, it proved feasible to adopt the MFP to optimize the design parameters of an underground pipeline if the SCD deviation was less than the design safety coefficient for each MFP(Li,2012).
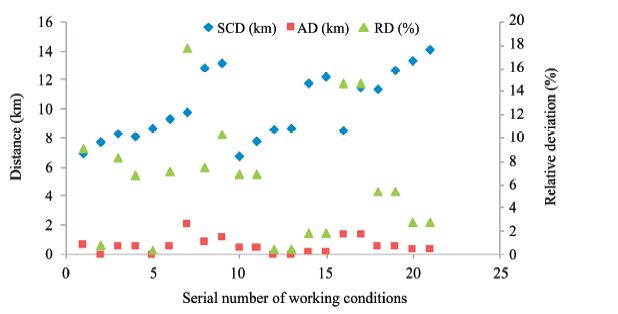
A total of 21 types of working conditions under three buried depths were analyzed according to the above guidance. The SCDs and their deviations were acquired(Figure 5),and Table 3 lists the MAGST, SWC,and buried depths. The other parameters were those provided in Section 2.2.
|
| Figure 5 SCDs and deviations under 21 working conditions with different MAGST and SWC combinations |
| No. | MAGST(℃) | AM(℃) | SWC(%) | MFP(m) | BD(m) | SCD(km) | ASCD(km) | AD(km) | RD(%) |
| 1 | 4.0 | 20.0 | 20.0 | 1.3 | 1.0 | 6.99 | 7.69 | 0.7 | 9.1 |
| 2 | 6.0 | 20.0 | 15.0 | 1.3 | 1.0 | 7.75 | 7.69 | 0.06 | 0.77 |
| 3 | 2.0 | 20.0 | 25.0 | 1.3 | 1.0 | 8.33 | 7.69 | 0.64 | 8.33 |
| 4 | 6.0 | 20.0 | 15.0 | 1.3 | 1.1 | 8.13 | 8.72 | 0.59 | 6.81 |
| 5 | 4.0 | 20.0 | 20.0 | 1.3 | 1.1 | 8.7 | 8.72 | 0.03 | 0.32 |
| 6 | 2.0 | 20.0 | 25.0 | 1.3 | 1.1 | 9.35 | 8.72 | 0.62 | 7.13 |
| 7 | 6.0 | 20.0 | 15.0 | 1.3 | 1.2 | 9.8 | 11.93 | 2.12 | 17.8 |
| 8 | 4.0 | 20.0 | 20.0 | 1.3 | 1.2 | 12.82 | 11.93 | 0.89 | 7.49 |
| 9 | 2.0 | 20.0 | 25.0 | 1.3 | 1.2 | 13.16 | 11.93 | 1.23 | 10.32 |
| 10 | 1.0 | 32.0 | 20.0 | 2.0 | 1.6 | 6.8 | 7.31 | 0.5 | 6.91 |
| 11 | 1.0 | 20.0 | 15.0 | 2.0 | 1.6 | 7.81 | 7.31 | 0.5 | 6.91 |
| 12 | 1.0 | 32.0 | 20.0 | 2.0 | 1.7 | 8.62 | 8.66 | 0.04 | 0.43 |
| 13 | 1.0 | 20.0 | 15.0 | 2.0 | 1.7 | 8.7 | 8.66 | 0.04 | 0.43 |
| 14 | 1.0 | 20.0 | 15.0 | 2.0 | 1.8 | 11.76 | 11.98 | 0.22 | 1.8 |
| 15 | 1.0 | 32.0 | 20.0 | 2.0 | 1.8 | 12.2 | 11.98 | 0.22 | 1.8 |
| 16 | 1.0 | 30.0 | 15.0 | 2.4 | 2.1 | 8.55 | 10.02 | 1.47 | 14.71 |
| 17 | 4.0 | 20.0 | 10.0 | 2.4 | 2.1 | 11.49 | 10.02 | 1.47 | 14.71 |
| 18 | 1.0 | 30.0 | 15.0 | 2.4 | 2.2 | 11.36 | 12.01 | 0.65 | 5.39 |
| 19 | 4.0 | 20.0 | 10.0 | 2.4 | 2.2 | 12.66 | 12.01 | 0.65 | 5.39 |
| 20 | 1.0 | 30.0 | 15.0 | 2.4 | 2.3 | 13.33 | 13.71 | 0.38 | 2.74 |
| 21 | 4.0 | 20.0 | 10.0 | 2.4 | 2.3 | 14.08 | 13.71 | 0.38 | 2.74 |
| Notes: AM, amplitude of the MAGST (unit: ℃); ASCD, average safe conveyance distance (unit: km); AD, absolute deviation (unit: km); and RD, relative deviation (unit: %). | |||||||||
In Figure 5 and Table 3,the maximum absolute deviation of the SCD is 2.1 km,and the maximum relative deviation is 17.8%. Both values are within safe levels(Li,2012). The analysis of the 21 types of working conditions showed that different MAGST and SWC combinations did not significantly change the SCD under certain MFPs and buried depths.
Under the condition that the MFP is fixed,a water pipeline will lose its function because of water freezing in winter when the pipeline is laid on the ground surface. Therefore,the SCD of an underground pipeline increases with the increase of the buried depth. A pipeline beneath the MFP is not in danger of water freezing and the SCD need not be limited by the threat of frost damages.
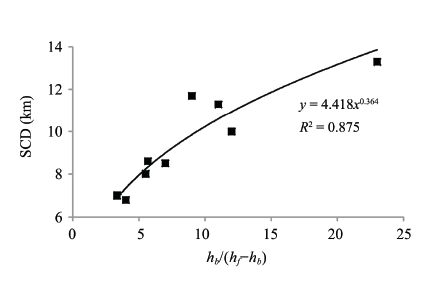
In addition,the SCD increases with the MFP under the condition that the difference between the buried depth and the MFP is unchanged. One option that can be considered based on the Quasi-3D numerical results and the abovementioned analysis on the buried depth (hb)and the MFP(hf)is to establish a direct relationship between the SCD and hb/(hf −hb)(Figure 6). The formula for the SCD and hb/(hf −hb)can be expressed as follows by comparing several fitting methods:
|
| Figure 6 Correlation between the SCD and hb/(hf −hb) |
| ${{L}_{SCD}}=4.418\cdot {{\left( {{h}_{b}}/\left( {{h}_{f}}-{{h}_{b}} \right) \right)}^{0.364}}$ | (8) |
where LSCD is the SCD(unit: km); hb is the buried depth of the water pipeline(unit: m); and hf is the MFP(unit: m). Equation(8)is applicable only under the condition of hb<hf ; the water pipeline would not suffer frost damages when hb ≥hf.
4.2 Comprehensive analytical method and its application effectEquations(5)through(8)show that each factor exerts a decisive effect on the SCD,and the effect of any single factor on the SCD would be very remarkable under the extreme condition. One option is that multiplication can be used to express the mutual effect among these factors if each single factor plays a critical role in a comprehensive formula. Therefore,the final comprehensive analytical formula for the SCD could be expressed as:
| ${{L}_{SCD}}=V\cdot {{D}^{1.37}}\cdot {{\left( {{h}_{b}}/\left( {{h}_{f}}-{{h}_{b}} \right) \right)}^{0.364}}\cdot \left( {{X}_{1}}\cdot \ln {{T}_{IWT}}+{{X}_{2}} \right)$ | (9) |
where X1 and X2 are two unknowns,which can be solved by establishing two equations. However,lnTIWT must not be zero in at least one equation,and $V\cdot {{D}^{1.37}}\cdot {{\left( {{h}_{b}}/\left( {{h}_{f}}-{{h}_{b}} \right) \right)}^{0.364}}$ must not be zero in the two equations. Table 4 lists the two working conditions and the SCD calculated using the Quasi-3D method to obtain the X1 and X2 values.
Two unknowns are calculated,X1=97.5 and X2=121.7,according to Table 4 and Equation(9). The final analytical formula for the SCD is:
| ${{L}_{SCD}}=V\cdot {{D}^{1.37}}\cdot {{\left( {{h}_{b}}/\left( {{h}_{f}}-{{h}_{b}} \right) \right)}^{0.364}}\cdot \left( 97.5\ln {{T}_{IWT}}+121.7 \right)$ | (10) |
| No. | MFPm) | BD(m) | PD(m) | FV(m/s) | IWT(℃) | SCD(km) |
| 1 | 2.5 | 1.5 | 0.1 | 1.0 | 4.0 | 12.7 |
| 2 | 2.0 | 1.2 | 0.2 | 0.36 | 1.0 | 5.6 |
where LSCD is the SCD(unit: km); hb is the buried depth of the water pipeline(unit: m); hf is the MFP (unit: m); D is the pipeline diameter(unit: m); V is the flow velocity(unit: m/s); and TIWT is the inlet water temperature(unit: ℃).
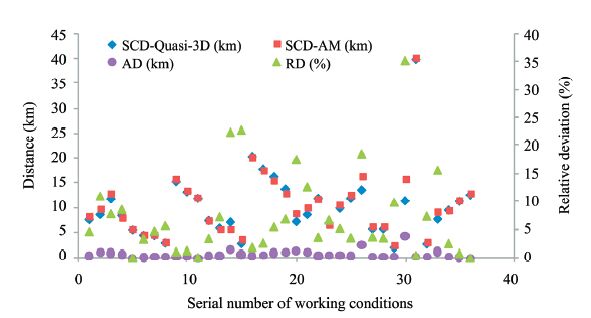
We compared the analytical method results and numerical results based on the Quasi-3D method under complicated and numerous working conditions to determine the applicability of Equation(10). Table 5 lists the parameters under the 36 working conditions. The SCDs and their deviations are listed in Table 5 and mapped in Figure 7. The average value derived by comparisons with the calculation results based on the Quasi-3D numerical method was 0.6 km for the absolute deviation and 7.5% for the relative deviation. Among the 36 working conditions,the maximum was 4.1 km for the absolute deviation and 35.3% for the relative deviation. All the values were within the level of the 1.5 safety coefficient.
| No. | MFP(m) | BD(m) | PD(m) | FV(m/s) | IWT(°C) | SCD(km) | AD(km) | RD(%) | |
| Quasi-3D | AM | ||||||||
| 1 | 1.3 | 1.0 | 0.10 | 1.000 | 1.0 | 7.7 | 8.0 | 0.4 | 4.6 |
| 2 | 1.3 | 1.1 | 0.10 | 1.000 | 1.0 | 8.7 | 9.7 | 1.0 | 11 |
| 3 | 1.3 | 1.2 | 0.10 | 1.000 | 1.0 | 11.9 | 12.8 | 0.9 | 7.8 |
| 4 | 2.0 | 1.5 | 0.10 | 1.000 | 1.0 | 8.5 | 7.7 | 0.7 | 8.6 |
| 5 | 2.0 | 1.2 | 0.2 | 0.36 | 1.0 | 5.6 | 5.6 | 0.00 | 0.00 |
| 6 | 2.0 | 1.2 | 0.3 | 0.160 | 1.0 | 4.5 | 4.3 | 0.10 | 3.3 |
| 7 | 2.0 | 1.2 | 0.10 | 0.720 | 1.0 | 4.5 | 4.3 | 0.2 | 4.7 |
| 8 | 2.0 | 1.2 | 0.2 | 0.180 | 1.0 | 3.0 | 2.8 | 0.2 | 5.7 |
| 9 | 2.0 | 1.2 | 0.2 | 1.00 | 1.0 | 15.4 | 15.6 | 0.2 | 1.1 |
| 10 | 2.0 | 1.2 | 0.25 | 0.640 | 1.0 | 13.3 | 13.5 | 0.2 | 1.3 |
| 11 | 2.0 | 1.2 | 0.3 | 0.444 | 1.0 | 12.0 | 12.0 | 0.0 | 0.10 |
| 12 | 2.0 | 1.5 | 0.2 | 0.360 | 1.0 | 7.5 | 7.2 | 0.3 | 3.4 |
| 13 | 2.0 | 1.5 | 0.3 | 0.160 | 1.0 | 6.0 | 5.6 | 0.4 | 7.3 |
| 14 | 2.0 | 1.5 | 0.10 | 0.720 | 1.0 | 7.2 | 5.6 | 1.6 | 22.5 |
| 15 | 2.0 | 1.5 | 0.2 | 0.180 | 1.0 | 2.9 | 3.6 | 0.7 | 22.9 |
| 16 | 2.0 | 1.5 | 0.2 | 1.000 | 1.0 | 20.4 | 20 | 0.4 | 1.9 |
| 17 | 2.0 | 1.5 | 0.25 | 0.640 | 1.0 | 17.9 | 17.4 | 0.5 | 2.6 |
| 18 | 2.0 | 1.5 | 0.3 | 0.444 | 1.0 | 16.4 | 15.5 | 0.9 | 5.5 |
| 19 | 2.0 | 1.5 | 0.4 | 0.250 | 1.0 | 13.9 | 12.9 | 1.0 | 6.9 |
| 20 | 2.0 | 1.6 | 0.10 | 1.000 | 1.0 | 7.3 | 8.6 | 1.3 | 17.6 |
| 21 | 2.0 | 1.7 | 0.10 | 1.000 | 1.0 | 8.7 | 9.8 | 1.1 | 12.7 |
| 22 | 2.0 | 1.8 | 0.10 | 1.000 | 1.0 | 12.0 | 11.6 | 0.4 | 3.6 |
| 23 | 2.3 | 1.5 | 0.10 | 1.000 | 1.0 | 7.0 | 6.5 | 0.5 | 6.7 |
| 24 | 2.4 | 2.1 | 0.10 | 1.000 | 1.0 | 10.0 | 10.5 | 0.5 | 5.2 |
| 25 | 2.4 | 2.2 | 0.10 | 1.000 | 1.0 | 12 | 12.4 | 0.4 | 3.5 |
| 26 | 2.4 | 2.3 | 0.10 | 1.000 | 1.0 | 13.7 | 16.3 | 2.5 | 18.6 |
| 27 | 2.5 | 1.5 | 0.10 | 1.000 | 1.0 | 5.8 | 6.0 | 0.2 | 3.7 |
| 28 | 2.5 | 1.5 | 0.10 | 1.000 | 1.0 | 5.8 | 6.0 | 0.2 | 3.5 |
| 29 | 2.5 | 1.5 | 0.05 | 1.000 | 1.0 | 2.1 | 2.3 | 0.2 | 9.9 |
| 30 | 2.5 | 1.5 | 0.2 | 1.000 | 1.0 | 11.5 | 15.6 | 4.1 | 35.3 |
| 31 | 2.5 | 1.5 | 0.4 | 1.000 | 1.0 | 40.0 | 40.2 | 0.2 | 0.5 |
| 32 | 2.5 | 1.5 | 0.10 | 0.500 | 1.0 | 2.8 | 3.0 | 0.2 | 7.4 |
| 33 | 2.5 | 1.5 | 0.10 | 1.500 | 1.0 | 7.8 | 9.0 | 1.2 | 15.7 |
| 34 | 2.5 | 1.5 | 0.10 | 1.000 | 2.0 | 9.6 | 9.4 | 0.2 | 2.5 |
| 35 | 2.5 | 1.5 | 0.10 | 1.000 | 3.0 | 11.4 | 11.3 | 0.10 | 0.8 |
| 36 | 2.5 | 1.5 | 0.10 | 1.000 | 4.0 | 12.7 | 12.7 | 0.0 | 0.0 |
| Note: AM, analytical method. | |||||||||
|
| Figure 7 Comparison of the SCD, AD, and RD between the Quasi-3D method and the analytical method |
Our numerical simulation results based on the Quasi-3D method showed that the SCDs had strong and positive relationships with the SWC,MAGST, buried depth,pipeline diameter,flow velocity,and inlet water temperature. Under the condition that the MFP was fixed,the SCD only depended on the buried depth of the underground pipeline,which was not significantly influenced by different MAGST and SWC combinations. We demonstrated that adopting the MFP instead of the MAGST and SWC to optimize the design parameters is feasible. We established a comprehensive analytical formula based on assessing the mutual effects among the MFP,buried depth, pipeline diameter,flow velocity,and inlet water temperature. We proved that the analytical method is in conformity with the Quasi-3D method by comparing the calculation results under 36 different working conditions. Under the condition of a 1.5 safety coefficient, the analytical method can be used to optimize the anti-freeze design parameters of underground water pipelines in the seasonally frozen areas.
A final note about this method is that the working conditions used in this paper are very limited,even though the analytical formula was established based on a large quantity of numerical calculations. It is necessary to further evaluate this method's applicability before adopting it to optimize the anti-freeze parameters of water supply pipelines in seasonally frozen areas if the pipeline engineering faces special and extreme working conditions.
Acknowledgments:This work was financially supported by the National Basic Research Program of China(No. 2013CBA01803),the National Natural Science Foundation of China(No. 41101065),and the CAS "Equipment Development Project for Scientific Research" (No. YZ201523). Thanks to HongLian Chen and the editor of journal Sciences in Cold and Arid Regions for their English language polish.
| Chen J, Li K, Sheng Y, et al, 2014. Variations and influencing factors of the water temperature within the pipe buried in seasonally frozen ground areas. Journal of Glaciology and Geocryology, 36(4): 836–844. |
| Coulter DM, Bardon MF, 1979. Revised equation improves flowing gas temperature prediction. Oil & Gas Journal, 2(26): 107–108. |
| De XE, 1994. Thermodynamic calculation for long distance crude oil pipeline. Pipeline Technique and Equipment,: 5–7. |
| French HM, 2007. The Periglacial Environment (Third Edition). John Wiley & Sons,: 13. |
| Hooker PR, 1978. Temperature and heat transfer along buried liquids pipelines. Society of Petroleum Engineers, 5: 747–753. |
| Jin HJ, Yu WB, Chen YC, 2005. (Differential) Frost heave and thaw settlement in the engineering design and construction of oil pipelines in permafrost regions: A Review. Journal of Glaciology and Geocryology, 27(3): 454–464. |
| Li GY, Sheng Y, Jin HJ, et al, 2010. Forcasting the oil temperatures along the proposed China-Russia Crude Oil Pipeline using Quasi 3-D transient heat conduction model. Cold Regions Science and Technology, 64(3): 235–242. doi: 10.1016/j.coldregions.2009.08.003 |
| Li JF, Lv HQ, Li ZX, 2006. Experience and revelation learned from foreign pipeline construction projects in permafrost regions. Petroleum Engineering Construction, 32(6): 1–5. |
| Li K, 2012. Optimization for preventing buried water pipe freezing in seasonally frozen soil regions. M.S. Thesis, Graduated School of the Chinese Academy of Sciences,: 50. |
| Liu W, Chen CL, Wu XH, et al, 2003. Establishment and application of a model for predicting fluid flowing temperature distribution in the multiphase flow pipeline. Journal of Southwest Petroleum Institute, 25(6): 93–95. |
| Meng SC, Hong Y, Cao DQ, 2005. Development of rural water supply and recommendations. China Water Resources,: 49–50. |
| Nixon JF, MacInnes KL, 1996. Application of pipe temperature simulator for Norman Wells oil pipeline. Canadian Geotechnical Journal, 33(1): 140–149. doi: 10.1139/t96-029 |
| Shanghai Municipal Engineering Institute, 2006. Code for Design of Outdoor Water Supply Engineering (GB50013-2006). Beijing: China Planning Press: 1-17. |
| Spade RD, 1973. Hot oil pipeline design and operating factors. Pipeline and Gas Journal, 200(11): 80–84. |
| Swamee, Prabhata K, 1993. Design of a submarine oil pipeline. Journal of Transportation Engineering, 119(1): 159–170. doi: 10.1061/(ASCE)0733-947X(1993)119:1(159) |
| Wang HQ, 2002. Calculation and analysis of temperature drop along buried hot waxy oil pipeline. Oil & Gas Storage and Transportation, 21(7): 9–12. |
| Wang K, Wu M, 2005. Calculation of axial temperature drop along hot waxy oil pipeline. Pipeline Technique and Equipment,: 8–9. |
| Xiao BM, Pan YM, Chen BF, 2000. Calculation to starting temperature of oil pipeline under different medium temperatures. Oil-Gas Field Surface Engineering, 19(3): 21–22. |
| Xu XZ, Wang JC, Zhang LX, 2010. Physics in Frozen Soil. Beijing: Science Press: 75-89. |
| Yang PW, 1996. Theory and practice of shallow buried pipeline in Yakeshilin area. Forestry Construction,: 11–21. |
| Yang T, Ma GY, Hu YC, 2009. The effect of the frost heave and thawing settlement on oil pipeline in frozen soil region. Pipeline Technology and Equipment,: 40–43. |
| Yang XH, Zhang GZ, 1996. The Pipeline Design and Management. Dongying (Shandong Province). Petroleum University Publishing House,: 52–56. |
| Zhou YW, Qiu GQ, Guo DX, 2000. Geocryology in China. Beijing: Science Press: 205-211. |
 2016, 8


