Article Information
- A. Harris Stuart . 2016.
- Probable effects of heat advection on the adjacent environment during oil production at Prudhoe Bay, Alaska
- Sciences in Cold and Arid Regions, 8(6): 451-460
- http://dx.doi.org/10.3724/SP.J.1226.2016.00451
Article History
- Received: July 02, 2016
- Accepted: August 23, 2016
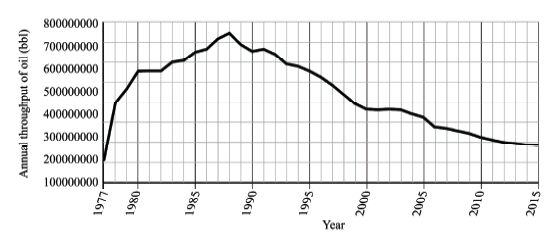
When oil comes out of the ground on the north coast of Alaska,it has a temperature of over 40 ℃ (Trans-Alaska Pipeline System,2013),but the ambient mean annual air temperature(MAAT)is only about −12 ℃ to −15 ℃. By the end of 2015,more than 17 trillion barrels of oil had been pumped through the pipeline(Figure 1),so that the excess heat from the oil must have been dissipated into the adjacent microenvironment,that is,the permafrost,air, and/or adjacent sea water. Obviously,the quantity of heat involved over the last 38 years is significant and should therefore be reflected in changes in the mean annual temperatures of the surrounding air,permafrost, and/or sea water. Since the design of the Trans-Alaska Pipeline involved minimizing the effect of this heat energy on the underlying permafrost, most of this energy should have been absorbed by the air and the adjacent ocean. Unfortunately,there has been no consideration in the literature as to the effect of this heat on the adjacent environment,although significant changes in the surrounding air temperatures and sea ice cover have been recorded. This paper examines the apparent effects on both the adjacent atmosphere and the Arctic Ocean.
|
| Figure 1 Annual throughput of oil through the Trans-Alaska Pipeline (data from Trans-Alaska Pipeline, 2013:www.alyeska-pipe.com/TAPS/PipelineOperations/Throughput Jan 5, 2016–Pipeline Operations. Throughput, average per day) |
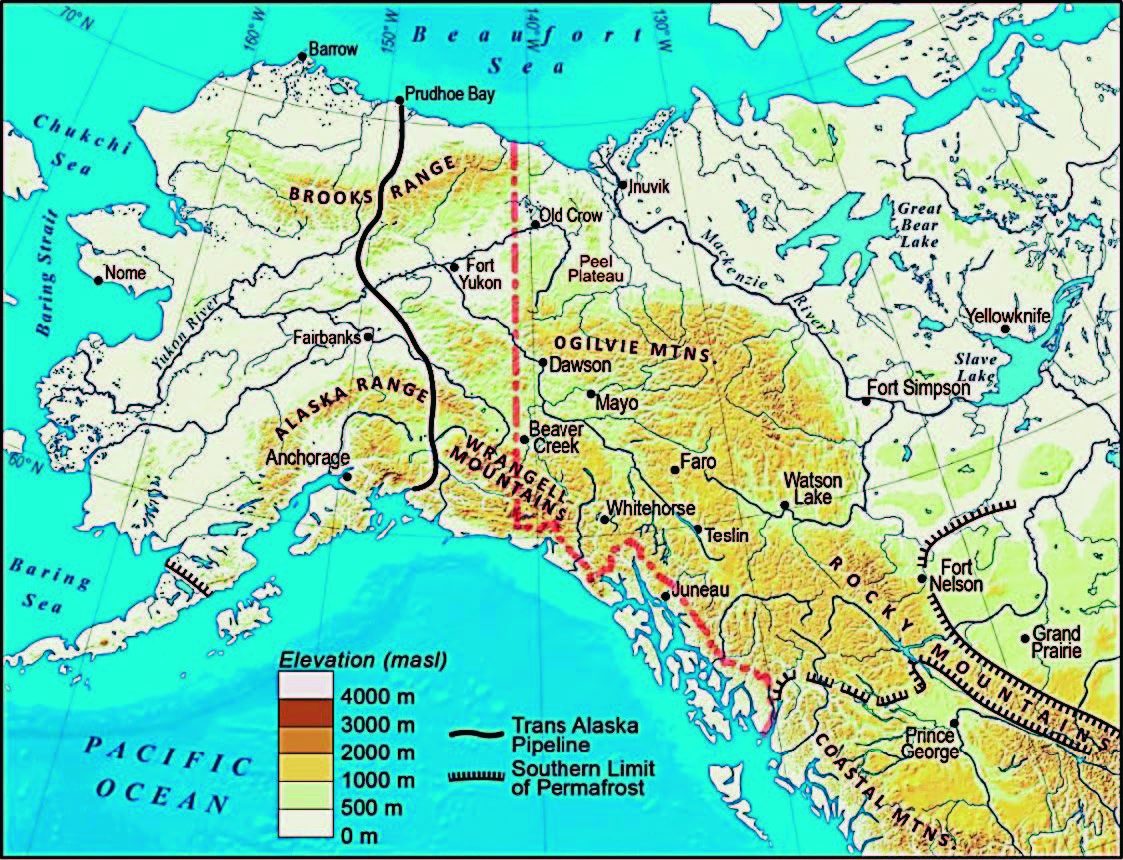
Figure 2 shows the location of the Trans-Alaska Pipeline carrying oil from the North Slope of the Brooks Range south to Valdez,Alaska. Also shown is the limit of permafrost in Alaska and the Yukon Territory, together with the location of the main weather stations and settlements discussed in this paper. The area is nearly the size of Europe and consists of the accumulated mountain ranges that have been added as the North American plate ploughed into a succession of terrains during its northern and subsequent western movement due to plate tectonics.
|
| Figure 2 Location of the Trans-Alaska Pipeline across eastern Alaska relative to the topography and permafrost distribution |
The current interpretation of the parts of the land areas of the Earth that are presumed to be undergoing "global warming" does not differentiate between the areas which have undergone millennia of anthropogenic modification of the environment from those that are in a relatively pristine environmental condition. Northwest North America falls in the latter category, since it is vast,difficult to access,sparsely populated, and has a very cold climate at high latitude. There is negligible solar radiation reaching the ground for many weeks during winter in these northern areas. Accordingly,there are two microenvironments in this region to deal with,viz.,the pristine mainland in contrast to the modified environments adjacent to the Trans-Alaska Pipeline,and oil wells along the Arctic coast of Alaska as well as the pipeline route.
The pristine environment consists of the interior parts of Alaska,for which there are excellent data from Class I weather stations throughout the area(Alaska Climate Research Committee,2012). Likewise,the data from weather stations from the mountains of central and northern Yukon Territory show no appreciable warming of the climate in the past on the Mackenzie Delta. These data show either negligible change in MAAT during the last 30~60 years in the mountains of the Yukon Territory or a close relationship to the adjacent sea temperatures at sites south of the Brooks Range and north of the Wrangell-St. Elias Ranges in Alaska.
In contrast,the anthropogenically modified land areas are along the North Slope of the Brooks Range (Romanovsky et al.,2014)and immediately adjacent to the pipeline. These areas have been closely monitored by the scientists at the University of Alaska, Fairbanks and the Trans-Alaska Pipeline staff. Smith and Burgess(1999) have also reported climatic warming from Inuvik and pipeline stations along the Mackenzie Valley,Northwest Territories. In spite of this,the IPCC(2013)concluded that the entire region was undergoing climate change at the rate measured at the site with a modified climate at Prudhoe Bay and the nearby Arctic coast.
Considerable changes in both the MAAT at Prudhoe Bay,Barrow,Inuvik,and along the actual pipeline right-of-way have been reported since the pipeline came into use(Romanovsky et al.,2014),and are currently regarded as being the result of either "global warming"(e.g.,Smith and Burgess,1999),increasing greenhouse gas concentrations in the atmosphere (IPCC,2013),or a winter heat island effect(Hinkel et al.,2003). Subsequently,Klene(2007)has questioned the latter interpretation. No consideration has been given to the fate of the excess heat advected to the ground surface by the oil produced from strata deep within the crust of the Earth.
Spectacular changes in the distribution of the Arctic ice cover have also been documented to have taken place since the pipeline began operation(Rothrock et al.,1999; Serreze et al.,2007; Comiso et al.,2008). While there are a number of theories regarding the cause of these changes,none of them consider the role of the advected heat that has been added to the air and ocean from the oil and gas extracted from deep underground. This paper examines the evidence for where this advected heat appears to have gone,together with its environmental implications.
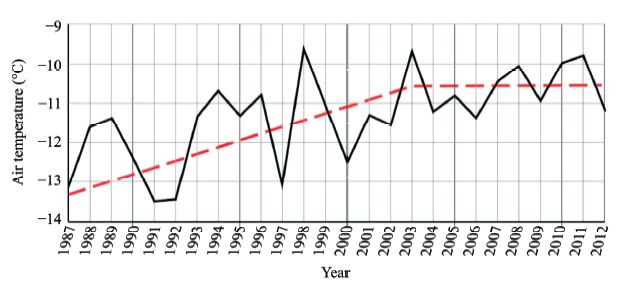
4 Methods used 4.1 Data sourcesThe Trans-Alaska Pipeline System(2013)provides data on the quantity of oil moved through the system since oil began to flow south in 1977. The quantity is enormous,but production peaked in 1988(Figure 1) and has been decreasing ever since. The Alaska Climate Research Committee(2012)provides data on the MAAT for the Class I stations situated in Alaska,while equivalent data from weather stations situated in relatively pristine locations within and around the Yukon Territory were calculated from the monthly means (Atmospheric Environment Service,http://climate. weather.gc.ca/climate_normals/index_e.html. Accessed on May 5,2016). Romanovsky et al.(2014)provide climatic data on the MAAT for the Prudhoe Bay area (Figure 3)and for Barrow,Alaska,as well as for the actual pipeline. Additional data for the Inuvik Townsite and along the pipeline at Norman Wells are discussed in Smith and Burgess(1999). The rates of change in the distribution of sea ice have been gleaned from National Snow and Ice Data Center(NSIDIC,at http://climate.nasa.gov/vital-signs/arctic-sea-ice)and the relevant literature. The changes in MAAT and in the distribution of sea ice commenced after the pipeline came into use in 1977.
|
| Figure 3 Mean annual air temperature at West Dock (redrawn from Romanovsky et al.2014). The oil is cooled by the excess heat initially being absorbed by the local atmosphere. Note that the changes essentially ceased and became quasi-stable after 2003, as the input of advected heat decreased. The red line shows the trend of the MAAT |
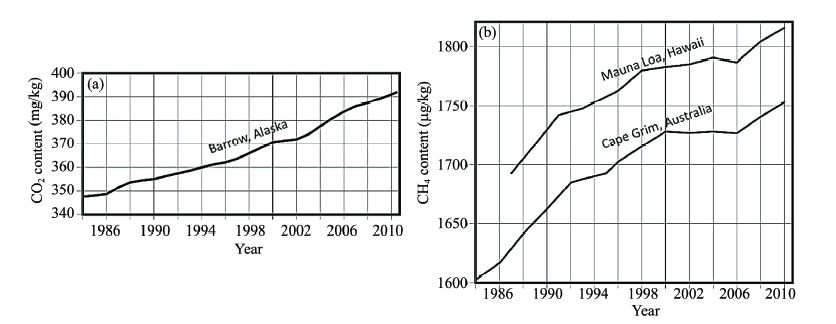
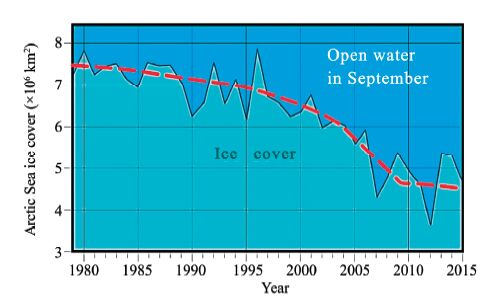
When the changes in MAAT and sea ice distribution by Prudhoe Bay came to be recognized,the concept of climate change being caused by increasing concentrations of carbon dioxide was popular. There were good long-term data on the concentration of these greenhouse gases in the atmosphere(Figure 4),and so more than 18 organizations developed predictive graphs based on the first results on record,assuming that it was caused by increasing greenhouse gases in the atmosphere. Most graphs and maps assumed that there would be a constant change with no significant variability for the period that was predicted(usually over 100 years). All the predictions for sea ice change proved too low(e.g.,Stroeve et al.,2007)as the increase in disappearance of the sea ice increased exponentially with time(Figure 5). Accordingly,the main changes in the shape of graphical distributions resulting from changes in quantities of heat supplied to a given parcel of fluid are discussed below to show the other patterns of change that were ignored.
|
| Figure 4 The time-series changes in (a) carbon dioxide (CO2), and (b) methane (CH4) content of the atmosphere in recent years (from NOAA, 2014; NOAA, 2015; NOAA, 2016). Note the steady increase in concentration in the atmosphere attributed to the burning of fossil fuels and climate change |
|
| Figure 5 Changes in area of the Arctic Sea ice cover from 1979 until 2015 (data from satellite observations by NSIDIC). The red line shows the overall trend with time |
The first,most common effect of changes in heat flow is a sudden transition from a former stable equilibrium MAAT to a new stable equilibrium MAAT. This occurs when a change in heat level is applied to the parcel of air. This change can be achieved in as little as five years in the case of stations in the hinterland of the North Pacific Oscillation(Harris,2009; Alaska Climate Research Committee,2012,Figure 2). In natural climatic systems,apparently random variability is usually caused by continuing variations in the local climate,but there is no systematic change with time between the oscillations. A limited amount of natural variability about the mean is normal. Extending predictions forward into geological time is obviously inappropriate unless it can be demonstrated that no final equilibrium is reached.
A second possible effect may result in a small change in the temperature of a fluid that surpasses a threshold,triggering a second or multiple changes that result in the commencement of slow change in level of heat in the form of a positive feedback over time. If these changes are cumulative,the rate of change will be exponential until a new equilibrium is reached, whereupon a quasi-equilibrium will be re-established. To identify this pattern in the data,scientists must wait until stability is reached before drawing conclusions regarding the cause of the changes.
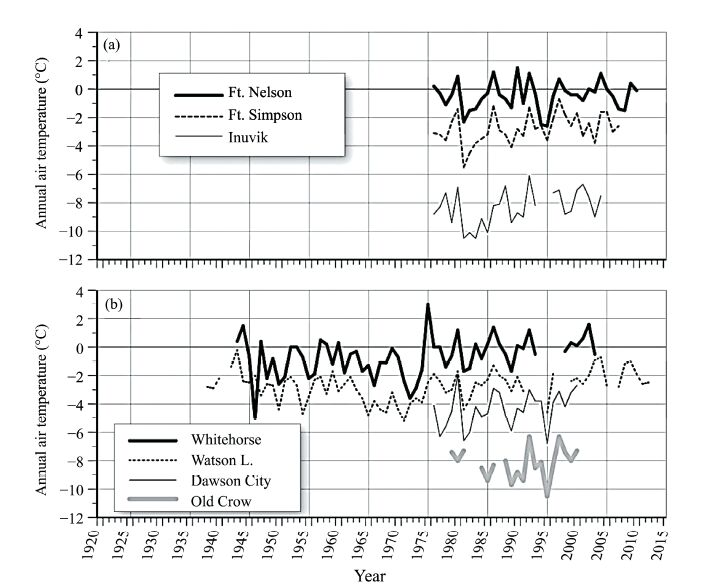
5 Results 5.1 Pristine environments inland in the mountainsIt is now agreed in Alaska that the MAAT at weather stations located away from the pipeline and Arctic coast do not show significant climate warming, except for changes related to the temperature of the water in the North Pacific Oscillation(Harris,2009; Figure 2 from Alaska Climate Research Committee, 2012; Romanovsky et al.,2014,Figure 8). This disagrees with the views of some other authors(Serreze et al.,2007; IPCC,2013)who appear to assume that the enhanced MAAT encountered along the Arctic coast applies to the whole of northwest North America. The Alaska Climate Research Committee noted that the atmospheric content of greenhouse gases during this period had been steadily rising(Figure 4),unlike the MAAT at inland sites in Alaska,so they concluded that the climate of the region has not been noticeably affected by recent changes in the greenhouse gases (primarily carbon dioxide and methane)in the atmosphere. Likewise,the available data for the Atmospheric Environment Service weather stations from natural environments from the Mackenzie Valley across to the Alaskan border also indicate minimal warming in the last 50 years(Figure 6).
|
| Figure 6 Time-series MAAT for stations along the eastern slopes of the western Cordillera. (a): from the Inuvik airport to Fort Nelson; (b): from Old Crow to Watson Lake (calculated from the mean monthly air temperature data in Atmospheric Environment Service, http://climate.weather.gc.ca/climate_normals/index_e.html) |
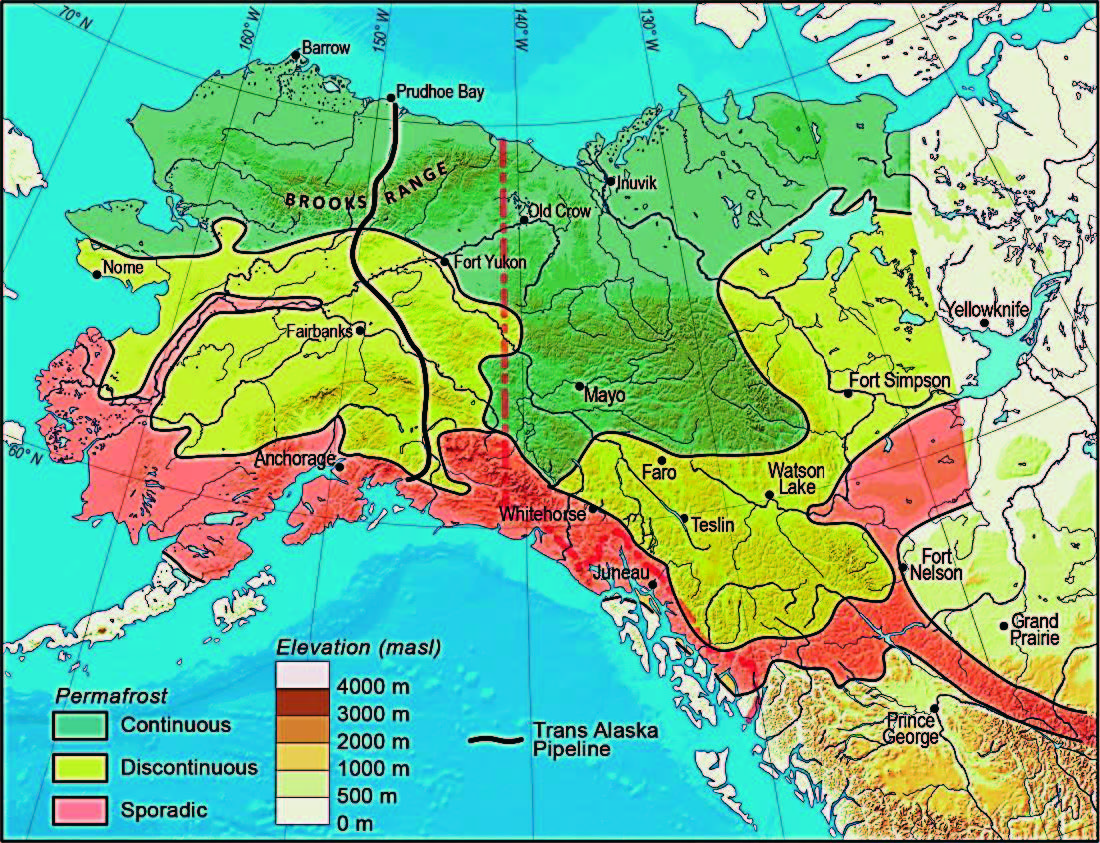
This source area consists of the zone with continuous permafrost that occurs as a southward bulge over the mountains of east Alaska and the west-central Yukon Territory(Figure 7). In winter, cold arctic polar(aP)air enters the area at temperatures of −30 ℃ to −45 ℃ from the Arctic Ocean but is not cold and dense enough to push further south or east. It reradiates heat during the long,dark nights, becoming very cold(−40 ℃ to −55 ℃)until it is dense enough to move on following along the east side of the Arctic jet stream to somewhere between California and Florida. It becomes modified on the way by becoming warmer as it extracts heat from the ground. Arctic polar air follows,providing the cold core of the "breakout",makes up the main cold air mass behind the modified continental polar(mcP)air. Since these breakouts greatly affected eastern Canada and New England during the 2014–2015 winter,this process is still active. Some cP air drains westwards downslope,to the Bering Strait,becoming warmed as it goes(Figure 8). The IPCC have not explained how greenhouse gases would affect this,and the relatively stable MAAT across this source area argues against any effects of increasing greenhouse gases.
|
| Figure 7 Distribution of permafrost zones in northwest North America. The southward bulge of the continuous permafrost zone in central Yukon Territory represents the main source area for the development of the cP air mass in winter |
|
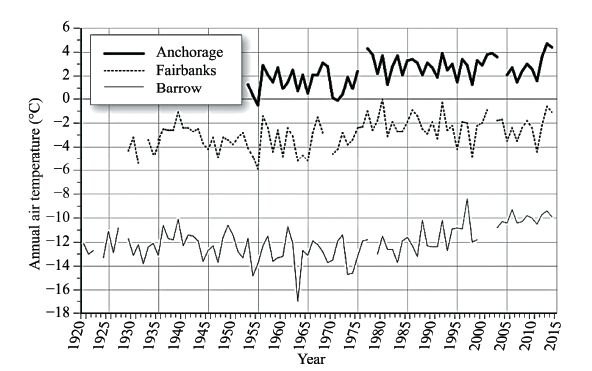
| Figure 8 Time-series of MAAT data for Fairbanks, Anchorage, and Barrow (largely from Alaska Climate Research Committee, 2012). Note the 3 ℃ rise in MAAT at Barrow after 1977, in contrast to the other stations |
The MAAT for Prudhoe Bay(Figure 3),Barrow (Romanovsky et al.,2014),and Inuvik Townsite (Smith and Burgess,1999)provide a spectacular contrast to those at pristine sites. Almost immediately after the pipeline came into use,the MAAT for Prudhoe Bay commenced rising,and this grew steadily until about 2003,after which it appears to have stabilized (Figure 3). To the west in Barrow,the MAAT started to increase in about 1980. Hinkel et al.(2003) attributed this change to a winter heat island effect, though this was questioned by Klene(2007). The population of Inuvik Townsite has not changed much since 1980,yet the warming effect on the MAAT has developed there as well(Smith and Burgess,1999). A common characteristic of all three air temperature graphs is that the warming continued until about 2003,suggesting continuation of the addition of heat from an outside source until that time. This contrasts with the graphs of the MAAT for mainland Alaska where the graphs of MAAT are in equilibrium until a change occurs in the sea temperature due to the North Pacific Oscillation(Harris,2009; Alaska Climate Research Committee,2012). When the temperature of the adjacent Pacific Ocean abruptly changes west of mainland Alaska,there is an adjustment for the MAAT to a new equilibrium throughout the area within five years. Thus,it would seem likely that heat energy is being continuously emitted to the atmosphere in the Prudhoe Bay area and is affecting the MAAT of a significant section of the Arctic coast of northwestern North America. Its changes with time do not match the changes in greenhouse gases in the atmosphere(Figure 4),but reduced heat supply from dwindling transport of oil has permitted a new equilibrium MAAT to be established.
5.4 Arctic sea ice coverJust after the Trans-Alaska Pipeline started to move oil south to Valdez,a slow shrinkage in the areas of sea ice remaining at the end of the summer season was reported from the area west of Prudhoe Bay (Serreze et al.,2007; Comiso et al.,2008),together with thinning of the ice cover to the east(othrock et al.,1999; Yu et al.,2004). The reduction in area of the Arctic sea ice increased rapidly after 2000(Figure 5), reaching a minimum in 2007(Comiso et al.,2008; Zhang et al.,2008). Since then,it has been relatively stable,although accompanied by continued thinning of the multiyear ice. This suggests that the change in MAAT at Prudhoe Bay was warming the adjacent sea, triggering a destabilization of the fairly stable Arctic sea ice cover. The heat put into the sea water could not possibly thaw the large mass of sea ice,but it would increase the area of open water,the fetch,wave height, and the length of the open water season. Wave action would warm the water due to contact with the warmer air. Once thawing began,the thawing of the outer edge of the ice would tend to continue,due to both the change from snow cover(reflecting 85% of the incoming radiation)to open areas of sea water,which being translucent,absorbs three to five times the incoming radiation compared with soil(Pavlov,1999; Harris,2002). This thawing would be similar to thermokarst development and would tend to have an exponential growth,which would be modified by factors such as storms(Zhang et al.,2008),but mitigated by decreased input of heat from the cooling oil.
Along the Arctic coasts of Canada and Russia where the loss of ice cover is greatest,the rates of coastal erosion are extreme,currently reaching up to about 18 m/a(Jones et al.,2009). This is consistent with the greatly expanded area of open water in September, although the relative though tenuous stability in Arctic ice cover since 2008 may have arrested this rate. Some authors predict a complete loss of the ice cover(Wang and Overland,2007),but only time will tell whether this will be the case. However,the timing of the loss of the ice strongly suggests the influence of the missing heat on the ice cover over the Arctic Ocean,and the changes certainly do not follow the increasing greenhouse gas content of the atmosphere in the area.
6 Discussio 6.1 Comparison with the changes in greenhouse gasesWhat is obvious from the comparison of the patterns of changes in both MAAT and the aerial distribution of the cover of the Arctic sea ice since 1977 is that they are quite different from one another and from the changes in atmospheric concentration in greenhouse gases during the same time period. As pointed out by the Alaska Climate Research Committee (2012),this would seem to imply that the primary causes of the changes were not the changes in greenhouse gas concentration,as suggested by Serreze et al. (2007)and the IPCC(2013). The mountainous interior of the Yukon Territory is also the area where the cP air mass develops by intense cooling of Arctic air in winter before it moves east/south to cause the cold winter outbreaks of Arctic air that periodically plague areas far to the south from California to Florida. Recent outbreaks have been quite intense,particularly during the 2014–2015 winter in Eastern Canada and New England,implying that the greenhouse gases were of negligible influence on the generation of this air mass in its source area.
6.2 The origin of the warming of the air at Prudhoe Bay since 1977A large quantity of heat has been dissipated into the surrounding environment at Prudhoe Bay over the last 38 years. The MAAT there showed an obvious progressive increase in temperature until about 2003,after which it seems to have stabilized. A similar but lesser increase in MAAT has been observed at the coastal towns of Barrow and Inuvik. This contrasts with stable MAATs at sites away from weather stations located far from man-made sources of heat both elsewhere in Alaska and the mountains of the Yukon Territory. This supports the conclusion of the Alaskan Climate Research Centre that the changes in MAAT are unrelated to the increases in greenhouse gases in the atmosphere. The fact that these changes stabilized in 2003 indicates that there had been an adjustment due to the input of additional heat from a new source,but that the input had decreased by 2003 to a level that allowed for a quasi-equilibrium to develop.
6.3 Pipeline right-of-wayThere has also been an increase change in MAAT measured along the pipeline right-of-way(Romanovsky et al.,2014). The effect is small but continuously present from 1977 onwards,affecting a narrow area marked by removal of trees and alteration of the surface vegetation. Even in the area south of the southern limit of permafrost,the buried pipe emits enough heat to produce a 4~5 m wide swath of green grass when there is still 30~40 cm of snow pack present in the adjacent forest(Harris,1986,plate 8). Smith and Burgess(1999)also described a warming alongside a pipeline at Norman Wells in the Northwest Territories.
As the throughput of oil decreased after 1988,the Trans-Alaska Pipeline Company decommissioned some of its pumping stations(Trans-Alaska Pipeline System,2013),which would have resulted in changes in the distribution of temperature in the oil within the pipe(Colt-KBR,2003). However,the data given by Romanovsky et al.(2014)are not sufficiently detailed to show this.
6.4 Changes in ice cover over the Arctic OceanThe changes in ice cover in the Arctic Ocean basin began slowly almost immediately after the commencement of the use of the pipeline. Maximum flow of oil was achieved in 1988 and has continued to decrease since then. The initial changes in ice cover were slow,but increased exponentially afterwards until about 2007(Figure 5),when the area of ice has fluctuated but generally remained in the same general range. However,the thickness of the ice cover is still decreasing and represents the greatest continuing threat to the ice cover. It would seem that the role of the heat input into the sea water from the cooling of the oil must be involved in any explanation of the changes that have taken place since 1977.
The actual mechanism of the initial heating of the sea water was probably warming of the water during wave action by the warming effect of the air it interacted with. This would aid in more thawing of the ice margin,thus increasing the area of open water. Solar warming of the increased area of open water in summer would aid in more absorption of solar heat and increase the area of open water. This,in turn,increases the fetch,allowing larger waves(giving more efficient warming of the water)and stronger storms. These changes have been demonstrated by comparative studies of rates of erosion,for example,before,soon after 1977,and in 2007 along the Arctic coast of Alaska(Jones et al.,2009).
6.5 Future changes in the throughput of oil along the pipelineThe critical factor now is whether the volume of oil transported south along the pipeline decreases or actually ceases,or whether development of new oil fields will result in an increase in the flow of oil. The latter scenario will make the future of the ice cover very precarious,whereas cessation of use of the pipeline could possibly result in stability or even a slow recovery of the sea ice and the ecosystems associated with it. The only other problem is the ongoing thinning of the ice pack by melting from below. Because of the continual movement of the ice,it is difficult to assess whether this will stop.
6.6 The stability of the ice around the Arctic IslandsIt is very obvious from satellite imagery that the loss of ice cover is not very marked around the islands of the Canadian Archipelago. Some of the islands are bigger than Switzerland,and many represent the summits of a former mountain chain that has sunk into the ocean. For most of the year they are covered by snow,but in summer,bare ground is present at the surface. Since water absorbs three to five times the solar energy as soil,they remain colder than the ice over the sea water and the open water in summer, acting like ice cubes cooling a glass of a beverage.
6.7 The importance of these changes to Arctic marine ecosystemsThe changes in the ice cover have caused serious changes in the area and the nature of Arctic marine and near-shore ecosystems(Springer et al.,1996; Bering Ecosystem Study,2004; Grebmeier et al.,2006; Moore and Huntington,2008). The thicker the ice cover,the less cooling of the underlying water in winter. However, the loss of large areas of ice cover has put many species at risk,such as polar bears. In addition,birds, seals,walruses,whales,and the Inuit use the ice for hunting. Many birds nest on the ice; the loss of some arctic gyres is a major threat,since these are the locus of so much Arctic marine life.
The current estimate is that 67% of the polar bear population will be lost. However,polar bears can breed with brown bears to produce fertile grizzly-polar bear hybrids(DeMaster and Stirling,1981; Schliebe et al., 2006)and they have only recently diverged from brown bears some 400 ka B.P. ago(Gorman,2012). New evidence suggests more frequent mating has continued over a longer period of time,and thus the two bears remain genetically similar(Liu et al.,2014). Neither species can survive long in the other's ecological niche,and they have different morphology, metabolism,social,and feeding behaviours,and other phenotypic characteristics,so the two bears are generally classified as separate species(Stirling,1988). The oldest fossil jaw-bone is dated at 130–110 ka B.P. (Lindqvist et al.,2010),but they have obviously survived earlier loss of the Arctic sea ice cover,e.g.,7–5 ka B.P.,and during the previous interglacials.
7 Possible other oil and gas-producing areas with heat advection problemsIt seems likely that a similar advection of heat, probably on an even larger scale,may be occurring in the oil and gas fields of western Siberia(Spolanskaya and Evseyev,1973). The permafrost region there consists of a vast swamp,with palsas and lithalsas together with peat plateaus occupying a latitudinal range of almost 30° and extending north-south across the Russian Taiga,east of the Ural Mountains. Gazprom produces tremendous volumes of gas from the region and most of the oil being exported to Europe from this area,but has also encountered enormous problems in counteracting the effects of thermokarst and floating pipelines.
8 ConclusionsThe evidence for climatic change in northwest North America has been assumed by some authors to be occurring throughout the region due to increasing greenhouse gases(Serreze et al.,2007; IPCC,2013), but this does not seem to match the results from the MAAT observations at long-term weather stations at pristine sites across the region. The time-series of MAATs from the latter show negligible effects of warming,obviously not matching the continuous changes in greenhouse gas concentrations in the atmosphere. Instead,the major increases in MAAT are limited to the Arctic coast after the commencement of throughput of more than 17 trillion barrels of hot oil that have been brought to the surface of the ground and moved in pipelines to Prudhoe Bay. Since 1977 the oil has been pumped from there through the Trans-Alaska Pipeline to Valdez. This 38-year period of operation appears to have resulted in profound changes in both air temperature and sea ice cover in the adjacent Arctic Ocean.
Evidence for the accumulation of this advected heat is found in the substantial changes in MAATs found along the coast and along the actual pipeline right-of way,subsequent to the opening of the pipeline in 1977. This was followed by a sudden commencement of thawing of the outer part of the adjacent ice cover of the Arctic Ocean,westwards of the settlement. This decrease in ice cover increased exponentially over time,finally stabilizing in 2007. What happens next will depend on whether the throughput of oil along the Trans-Alaska Pipeline continues to decrease before the pipeline is no longer used and is removed. This should allow the MAAT at Prudhoe Bay to decrease to that of the climate affecting the pristine landscape to the south across the mountains of the Yukon Territory and Alaska. Removal of the pipeline might even result in a slow regrowth of the Arctic Sea ice cover if the climate does not change.
These changes in temperature in the environment surrounding a major pipeline provide strong evidence to suggest that the advected heat from underground, brought to the surface with oil and gas in producing wells in permafrost areas,can have a very significant effect on the temperature conditions in the adjacent environment. It is likely that a similar advection of heat has added to the problems in the oil and gas fields of western Siberia,although this possibility does not seem to have been previously considered. This needs to be allowed for when designing the associated engineering works. Otherwise,serious damage can be wrought on adjacent ecosystems,albeit unintentionally.
Acknowledgments:Rick Smith helped in obtaining the necessary data from the Canadian Atmospheric Environment Service and Alaskan weather stations,while Robin Poitras drew the diagrams and map.
| Alaska Climate Research Committee, 2012. Temperature change in Alaska.http://climate.gi.alaska.edu/ClimTrends/Change/TemperatureChanges.html. Accessed on May 5, 2016. Alaska Climate Research Committee, 2012. Temperature change in Alaska.http://climate.gi.alaska.edu/ClimTrends/Change/TemperatureChanges.html. Accessed on May 5, 2016. |
| Bering Ecosystem Study, 2004. Bering Ecosystem Study (BEST) Science Plan. Fairbanks, Alaska. Arctic Research Consortium of the U.S., pp. 82. Bering Ecosystem Study, 2004. Bering Ecosystem Study (BEST) Science Plan. Fairbanks, Alaska. Arctic Research Consortium of the U.S., pp. 82. |
| Colt-KBR, 2003. Conceptual geotechnical/geothermal design basis. In: Conceptual and Preliminary Engineering for Mackenzie Gas Project. Prepared for Imperial Oil Resources Ventures Limited Project # 99-C-3079. Colt-KBR, 2003. Conceptual geotechnical/geothermal design basis. In: Conceptual and Preliminary Engineering for Mackenzie Gas Project. Prepared for Imperial Oil Resources Ventures Limited Project # 99-C-3079. |
| Comiso JC, Parkinson CL, Gersten K, et al, 2008. Accelerated decline in the Arctic sea ice cover. Geophysical Research Letters, 35: L01703. |
| DeMaster DP, Stirling I, 1981. Ursus Maritimus. Mammalian Species, 145(145): 1–7. doi: 10.2307/3503828.JSTOR3503828.OCLC46381503 |
| Gorman J, 2012. Brown bears and polar bears split up, but continued coupling. The New York Times, July 23,: 2012. |
| Grebmeier JM, Overland JE, Moore SE, et al, 2006. A major ecosystem shift in the northern Bering Sea. Science, 311(5766): 1461–1464. doi: 10.1126/science.1121365 |
| Harris SA, 1986. The Permafrost Environment. London: Croomhelm. Harris SA, 1986. The Permafrost Environment. London: Croomhelm. |
| Harris SA, 2002. Causes and consequences of rapid thermokarst development in permafrost or glacial terrain. Permafrost and Periglacial Processes, 13: 237–242. doi: 10.1002/(ISSN)1099-1530 |
| Harris SA, 2009. Climatic change and permafrost stability in the eastern Canadian Cordillera: The results of 33 years of measurement. Sciences in Cold and Arid Regions, 1(5): 381–403. |
| Hinkel KM, Nelson FE, Klene AE, et al, 2003. The winter urban heat island at Barrow, Alaska. International Journal of Climatology, 23: 1889–1905. doi: 10.1002/(ISSN)1097-0088 |
| IP CC, 2013. Intergovernmental Panel on Climate Change 4th Assessment Report. In: Soloman S, et al. (eds.). The Physical Science Basis: Contribution of Working Group 1 to the IPCC. Cambridge, England: Cambridge University Press. |
| Jones BM, Arp CD, Jorgenson MT, et al, 2009. Increase in the rate and uniformity of coastline erosion in Arctic Alaska. Geophysical Research Letters, 36: L03503. |
| Klene AE, 2007. Comparison of two air temperature records, Barrow, Alaska, 1976-2005: Climate warming, heat island, or both? In: Proceedings, Cryogenic Resources of Polar Regions. International Permafrost Conference, Salekhard City. Russian Academy of Sciences, 1: 133–135. |
| Lindqvist C, Schuster SC, Sun Y, et al, 2010. Complete mitochondrial genome of a Pleistocene jawbone unveils the origin of polar bear. Proceedings of the National Academy of Sciences, 107(11): 5053–5057. doi: 10.1073/pnas.0914266107 |
| Liu S, Lorenzen ED, Fumagalli M, et al, 2014. Population genomics reveal recent speciation and rapid evolutionary adaptation in polar bears. Cell, 157(4): 785–794. doi: 10.1016/j.cell.2014.03.054 |
| Moore SE, Huntington, 2008. Arctic marine mammals and climatic change - Impacts and resilience. Ecological Applications, 18(2): S157–S165. |
| NOAA, 2014. Monthly mean CH4 concentrations for Cape Grim, Australia. ftp://cmdl.noaa.gov/data/tracegases/ch4/flask/surface/ch4_cagg_month.txt. Accessed on December 29, 2014. NOAA, 2014. Monthly mean CH4 concentrations for Cape Grim, Australia. ftp://cmdl.noaa.gov/data/tracegases/ch4/flask/surface/ch4_cagg_month.txt. Accessed on December 29, 2014. |
| NOAA, 2015. Monthly mean CH4 concentrations for Mauna Loa,Hawaii. ftp://ftp.cmdl.noaa.gov/data/trace_gases/ch4/in-situ/surface/mla/ch4/mla-surface-insitu_1_ccgg_month.txt. Accessed on June 5, 2015. NOAA, 2015. Monthly mean CH4 concentrations for Mauna Loa,Hawaii. ftp://ftp.cmdl.noaa.gov/data/trace_gases/ch4/in-situ/surface/mla/ch4/mla-surface-insitu_1_ccgg_month.txt. Accessed on June 5, 2015. |
| NOAA, 2016. Monthly mean carbon dioxide concentrations for Barrow, Alaska, Cape Matatula, American Samoa and the South Pole. ftp://ftp.cmdl.noaa.gov./data/trace_gases/co2/in-situ/surface. Accessed on April 14, 2016. NOAA, 2016. Monthly mean carbon dioxide concentrations for Barrow, Alaska, Cape Matatula, American Samoa and the South Pole. ftp://ftp.cmdl.noaa.gov./data/trace_gases/co2/in-situ/surface. Accessed on April 14, 2016. |
| Pavlov AV, 1999. The thermal regime of lakes in the Northern Plains Regions. Earth Cryosphere, 3(3): 59–70. |
| Romanovsky VE, Cable WL, Kholohov AL, et al., 2014. Changes in permafrost and active layer thickness due to climate in the Prudhoe Bay region and North Slope, Alaska. www.geobotany.uaf.sdu/library/posters/Romanovsky/2014_Ott awaAC2014_pas2014120 5.pdf. Accessed on May 5, 2016. Romanovsky VE, Cable WL, Kholohov AL, et al., 2014. Changes in permafrost and active layer thickness due to climate in the Prudhoe Bay region and North Slope, Alaska. www.geobotany.uaf.sdu/library/posters/Romanovsky/2014_Ott awaAC2014_pas2014120 5.pdf. Accessed on May 5, 2016. |
| Rothrock DA, Yu Y, Maykut GA, 1999. Thinning of the Arctic ice cover. Geophysical Research Letters, 26(23): 3469–3472. doi: 10.1029/1999GL010863 |
| Schliebe S, Evans T, Johnson K, et al., 2006. Range-Wide Status Review of the Polar Bear (Ursus maritimus) (PDF). Anchorage, Alaska. Schliebe S, Evans T, Johnson K, et al., 2006. Range-Wide Status Review of the Polar Bear (Ursus maritimus) (PDF). Anchorage, Alaska. |
| Serreze MC, Holland MM, Stroeve J, 2007. Perspectives on the Arctic's shrinking sea ice cover. Science, 315(5818): 1533–1536. doi: 10.1126/science.1139426 |
| Smith SL, Burgess MM, 1999. Mapping the sensitivity of Canadian permafrost to climatic warming. In: Interactions between the Cryosphere, Climate and Greenhouse Gases. Proceedings of the International Union of Geodesy and Geophysics, 99, Symposium HS2, Birmingham. IAHS #A256 71-80. Smith SL, Burgess MM, 1999. Mapping the sensitivity of Canadian permafrost to climatic warming. In: Interactions between the Cryosphere, Climate and Greenhouse Gases. Proceedings of the International Union of Geodesy and Geophysics, 99, Symposium HS2, Birmingham. IAHS #A256 71-80. |
| Spolanskaya NA, Evseyev VP, 1973. Domed-hummocky peat bogs of the Northern Taiga in Western Siberia. Biuletyn Peryglacjalny, 22: 271–283. |
| Springer AM, Mcroy CP, Flint MV, 1996. The Bering Sea green belt - Shelf-edge processes and ecosystem production. Fisheries Oceanography, 5(3-4): 205–223. doi: 10.1111/fog.1996.5.issue-3-4 |
| Stirling I, 1988. The first polar bears. In: Polar Bears. Ann Arbor: University of Michigan Press. |
| Stroeve J, Holland MM, Meier W, et al., 2007. Arctic sea ice decline- faster than forecast. Geophysical Research Letters, 34: L09501. http://dx.doi.org/10.1029/2007GL029703. Stroeve J, Holland MM, Meier W, et al., 2007. Arctic sea ice decline- faster than forecast. Geophysical Research Letters, 34: L09501. http://dx.doi.org/10.1029/2007GL029703. |
| Trans-Alaska Pipeline System, 2013. The Facts. www.alyeska.pipe.com. Accessed on May 8, 2016. Trans-Alaska Pipeline System, 2013. The Facts. www.alyeska.pipe.com. Accessed on May 8, 2016. |
| Wang M, Overland JE, 2007. A sea ice free summer Arctic within 30 years?. Geophysical Research Letters, 36(7): L07502. |
| Yu Y, Maykut GA, Rothrock DA, 2004. Changes in the thickness distribution of Arctic sea ice between 1958-1970 and 1993-1997. Journal of Geophysical Research, 109(c08004). |
| Zhang J, Lindsay R, Steele M, et al., 2008. What drove the dramatic retreat of arctic sea ice during the summer of 2007? Geophysical Research Letters, 35: L11505. http://dx.doi.org/10.1029/2008GL034005. Zhang J, Lindsay R, Steele M, et al., 2008. What drove the dramatic retreat of arctic sea ice during the summer of 2007? Geophysical Research Letters, 35: L11505. http://dx.doi.org/10.1029/2008GL034005. |
 2016, 8


