Article Information
- YongYong Zhang, PuTe Wu, XiNing Zhao, WenZhi Zhao . 2016.
- Measuring and modeling two-dimensional irrigation infiltration under film-mulched furrows
- Sciences in Cold and Arid Regions, 8(5): 419-431
- http://dx.doi.org/10.3724/SP.J.1226.2016.00419
Article History
- Received: April 18, 2016
- Accepted: June 20, 2016
2. Institute of Water Saving Agriculture in Arid Regions of China, Northwest A & F University, Yangling, Shaanxi 712100, China
Furrow irrigation is currently the most common surface irrigation practice in the arid region of northwest China. Water flow under furrows laterally infiltrates through the soil to meet the needs of the plants grown on the ridges or raised beds. In traditional furrow irrigation, more water and solute fluxes are transferred in the furrows than planting beds (Bargar et al., 1999; Chen et al., 2011; Zhang et al., 2015), and deep water percolation below the root zone more easily occurred in the furrows than the ridges (Bargar et al., 1999; Abbasi et al., 2003). Additionally, salt concentration within the surface soil below ridges was lower than below the furrows under furrow irrigation with saline water (Chen et al., 2015). Improper furrow irrigation design in the field has higher water deep percolation and lower irrigation uniformity (Moravejalahkami et al., 2009). Hence increased lateral spreading and decreased moisture penetration depth are desirable. Moreover, irrigation of mulched furrows may produce pronounced changes in soil water and solute distribution between furrows and ridges (Bezborodov et al., 2010).
Soil water dynamics under irrigation of mulched furrows are complex, but critical for management of irrigation design, soil storage, and water use efficiency (Tabuada et al., 1995; Abbasi et al., 2003). Both soil physical properties and irrigation design parameters affect water and solute fluxes within the soil media (Zhang et al., 2005; Nie et al., 2009; Zhang et al., 2012). Therefore, these influential variables must be taken into consideration for the optimized design of mulched furrow irrigation systems. Furthermore, effective management of irrigation systems requires accurate estimation of wetted soil volume. The wetted soil depth should be consistent with the anticipated root depth, while wetted soil width should correspond with the spacing of ridges (Zur, 1996). Proper irrigation design can minimize water leaching and nutrient loss (Skaggs et al., 2010). The traditional method of describing furrow infiltration and wetting patterns was investigated using simulation experiments (Nie et al., 2009; Chen et al., 2011). Soil water distribution at selected nodes was measured to draw iso-water content lines (Bargar et al., 1999; Abbasi et al., 2003; Li et al., 2003). Additionally, cumulative infiltration, wetting patterns, and soil water content (SWC) were monitored to investigate soil water dynamics (Strelkoff and Sousa, 1984; Izadi and Wallender, 1985; Trout, 1992; Abbasi et al., 2003). However, knowledge of the effects of soil physical properties and irrigation parameters on the wetted volume was limited due to the restriction of wetting pattern observations in the field. Therefore, specialized and efficient methods which could elaborate soil water dynamics under mulched furrow irrigation systems are necessary.
Mathematical simulation models provide a potential approach for investigating lateral and vertical soil water infiltration (Tabuada et al., 1995; Ebrahimian et al., 2013; Zhang et al., 2013). Many mathematical models have been established based on Richards' equation in a variably saturated, rigid, isotropic porous soil medium (Richards, 1931), which can simulate more flexible representation of the flow domain, boundary conditions, and soil properties (Warrick, 2003). Levenberg-Marquardt optimization algorithm is used to inversely estimate soil hydraulics and/or solute transport parameters. Numerous models have been developed to simulate water flow and solute transport (e.g., bromine and nitrogen) and assess the effects of irrigation schedule and management practices on nitrogen leaching under furrow irrigation (Abbasi et al., 2004; Mailhol et al., 2007; Crevoisier et al., 2008; Ebrahimian et al., 2013). Simulation methods are also less costly and time consuming than conventional field experiments. However, the effect of irrigation of plastic mulched furrows on soil water distribution remains elusive. Mulched treatment retained 40%~60% more water, and saturated hydraulic conductivity of mulched treatment was 123 times greater in unmulched treatment (Humberto and Lal, 2007). The modified soil properties caused by plastic mulching must be considered when estimating the wetted soil volume in the root zone (Chen et al., 2015). Therefore, it is essential to construct a model that represents two-dimensional soil water dynamics under mulched furrow irrigation systems.
In this study, irrigation of mulched furrows in a cross-sectional ridge-furrow configuration was investigated in a soil chamber, which avoided the added complexity caused by vegetation and site-specific factors. The objectives of this study were to: (1) analyze the physical infiltration process and effects of experimental variables on wetting patterns; (2) develop wetting pattern propagation equations to predict the wetted lateral and downward distances; (3) establish a mathematical model to simulate soil water flow under mulched furrow irrigation systems.
2 Materials and methods 2.1 Soil propertiesTwo-dimensional infiltration characteristics of two soil types under mulched furrow irrigation were tested in a cuboid soil chamber. Silt loam soil and sandy loam soil (US Department of Agriculture) were collected at 10~30 cm depth from fallow fields. Soil textural fractions were analyzed using the Laser Mastersizer 2000 (Malvern Instruments, Malvern, England). Bulk density was determined by ring soil samples. Saturated soil water content (SWC) of the soil samples was measured using the oven-dried method. Saturated hydraulic conductivity was estimated using the ROSETTA code (Schaap et al., 2001). Some physical properties of the field-collected soil samples are summarized in Table 1.
| Soil texture | Soil particle size distribution (%) | Bulk density (g/cm3) | Saturated SWC (cm3/cm3) | Saturated hydraulic conductivity (cm/min) | ||
| Sand (0.05~2.00 mm) | Silt (0.002~0.05 mm) | Clay ( < 0.002 mm) | ||||
| Silt loam | 8.79±0.75 | 69.24±0.50 | 21.96±0.77 | 1.35±0.01 | 0.48±0.01 | 0.011 |
| Sandy loam | 63.10±3.06 | 28.99±2.63 | 7.91±0.82 | 1.50±0.11 | 0.36±0.01 | 0.031 |
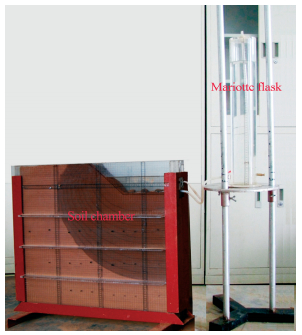
The experimental setup consisted of a cuboid soil chamber and water supply system (a Mariotte flask) (Figure 1). The cuboid soil chamber, made from 10-mm-thick plexiglass material, was 70 cm long, 5 cm wide, and 70 cm high. The bottom of the soil chamber included numerous 2-mm parallel air vents for ventilation. The soil wetting pattern was inscribed on two selected vertical surfaces of the soil chamber to validate the experimental accuracy. The Mariotte flask with a flexible hose was connected to a rubber hole on the soil chamber to supply water. This system maintained a constant water level under mulched furrows. Previous studies have found that the experimental chamber shape has negligible impact on the water flow pattern (Zhang et al., 2005; Nie et al., 2009). The middle of the furrow cross-section and ridge cross-section are zero flux boundaries in homogeneous soil conditions. Therefore, only half of the soil water distribution with mulched furrow irrigation (i.e., from the middle of the furrow to the middle of the ridge) was simulated in the soil chamber.
|
| Figure 1 Picture of the experimental setup |
The soil was air-dried at ambient temperature immediately after collection from the field. The air-dried soil was passed through a 2-mm sieve and prepared for packing into the soil chamber (Figure 1). Before packing, the soil was uniformly watered using a watering pot until the intended initial SWC (Table 2) was reached. The prepared soil was loaded and compacted into the soil chamber in 5-cm increments to obtain the required bulk density (Table 2) and homogeneous soil profiles. The packed soil in the entire chamber was allowed to equilibrate for 24 hours to ensure uniform distribution of the intended initial SWC throughout the chamber (Table 2). In order to avoid soil evaporation, the soil was covered with a polyethylene sheet before the experiment.
| Experiment | Soil texture | Initial SWC (cm3/cm3) | Bulk density (g/cm3) | Wetted perimeter | Time (min) | |
| H(cm) | F(cm) | |||||
| 1 | Silt loam | 0.107±0.004 | 1.35 | 8 | 40 | 240 |
| 2 | Silt loam | 0.163±0.003 | 1.35 | 8 | 40 | 240 |
| 3 | Silt loam | 0.107±0.003 | 1.35 | 14 | 40 | 240 |
| 4 | Sandy loam | 0.067±0.002 | 1.50 | 8 | 40 | 120 |
| 5 | Sandy loam | 0.122±0.007 | 1.50 | 8 | 40 | 120 |
| 6 | Sandy loam | 0.073±0.001 | 1.50 | 11 | 40 | 120 |
| SWC: Soil water content(Means±SD); H: Irrigation water level; F: Furrow size. | ||||||
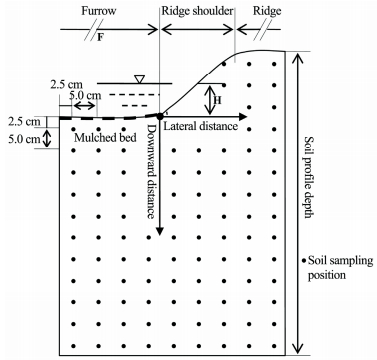
To investigate the effect of initial SWC, irrigation water level, and soil texture on two-dimensional infiltration under mulched furrow irrigation, six experimental treatments with two replications were conducted in the soil chamber (Table 2). The manipulated variables in the experimental treatments were determined using actual field values. The packed soil was excavated into an isosceles-trapezoid-shaped furrow and shaped into a ridge-furrow configuration (Figure 2). The furrow was mulched with plexiglass material and sealed using silicone rubber. The furrow was 15 cm below the ridge, with slope coefficient of 1. The furrow water level, the standing water height measured from the furrow bottom, was measured using a steel ruler. The water level was maintained by adjusting the Mariotte flask at the beginning of experimental treatments. Each experiment lasted for 120 min to 240 min to ensure free drainage at the bottom boundary. During each experiment, positions of the moving water front in horizontal and vertical directions were recorded with a marker on the two selected vertical surfaces of the soil chamber every 20 min. The cumulative infiltration was measured with readings of the graduated Mariotte flask water volume every 5 min. At the end of the experiment, the soil chamber was placed horizontally and opened from one vertical surface of the soil chamber for immediate soil sampling. The sampling layout was at horizontal intervals of 5 cm, starting 2.5 cm from the center of the furrow and moving outward to the edge of the wetted area. The soil was also vertically sampled in 5 cm intervals, starting 2.5 cm from the soil surface and moving downward to the wetted front (Figure 2). Soil samples were collected from outside the wetted soil to confirm the initial SWC. The sampled soil was oven dried at 105 ℃ for 8 hours to determine the gravimetric soil water content. The two-dimensional wetting patterns were characterized by the lateral and downward distances (Figure 2). The lateral distance (Rl) was measured from the foot of the ridge shoulder to the edge of the wetting front, and the downward distance (Rd) was measured from the soil surface to the wetting front.
|
| Figure 2 Schematic representation of mulched furrow irrigation and soil sampling positions |
| $\frac{{\partial \theta }}{{\partial t}} = \frac{\partial }{{\partial x}}\left({K(h)\frac{{\partial h}}{{\partial x}}} \right) + \frac{\partial }{{\partial z}}\left({K(h)\frac{{\partial h}}{{\partial z}}} \right) + \frac{{\partial K(h)}}{{\partial z}}$ | (1) |
| $K(h) = {K_s}{S_e}^l{[1 - {(1 - {S_e}^{\frac{1}{m}})^m}]^2}$ | (2) |
| $\theta \left(h \right) = \left\{ \begin{array}{l} {\theta _r} + \frac{{{\theta _s} - {\theta _r}}}{{{{\left({1 + {{\left| {\alpha h} \right|}^n}} \right)}^m}}}\;\;\;h < 0\\ {\theta _s}\;\;\;\;\;\;\;\;\;\;\;\;\;\;\;\;\;\;\;\;\;\;h \ge 0 \end{array} \right.$ | (3) |
| ${S_e} = \frac{{\theta - {\theta _r}}}{{{\theta _s} - {\theta _r}}}, m = 1 - \frac{1}{n}, n > 1$ | (4) |
|
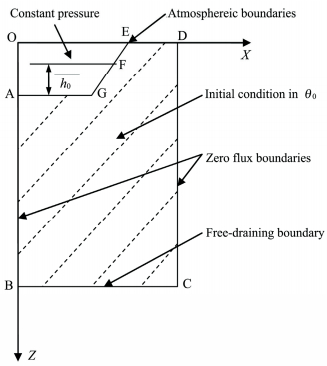
| Figure 3 Initial and boundary conditions for each irrigation experiment |
| Simulation | Soil texture | Treatment | Initial SWC (cm3/cm3) | H (cm) | Time (min) |
| 1 | Silt loam | Mulched furrows | 0.12 | 10 | 120 |
| 2 | Silt loam | Unmulched furrows | 0.12 | 10 | 120 |
| SWC: soil water content; H: Irrigation water level. | |||||
Performance of the HYDRUS-2D model was assessed using the root mean square error (RMSE), which provides a quantitative comparison of the goodness-of-fit between simulated and observed values (Patel and Rajput, 2008; Kandelous and Šimůnek, 2010). The RMSE was calculated using the formula:
| $RMSE = {\left[ {\frac{1}{n}\sum\limits_{i = 1}^n {{{(I{{(o)}_i} - I{{(s)}_i})}^2}} } \right]^{\frac{1}{2}}}$ | (5) |
where n is the total number of data in each experiment; I(o)i is the ith observed data; I(s)i is the ith simulated data.
The parameters of empirical wetting patterns propagation equations were estimated by using OriginLab 8.0 software (OriginLab Corporation, Northampton, MA, USA). Statistical analysis was performed using the software program SPSS, ver. 17.0 (SPSS Inc., Chicago, IL, USA). We prepared contour maps of the spatial distribution of soil water content increment (SWCI) in the SURFER package (Golden Software Version 8.0, 2002), using Kriging with a linear variogram.
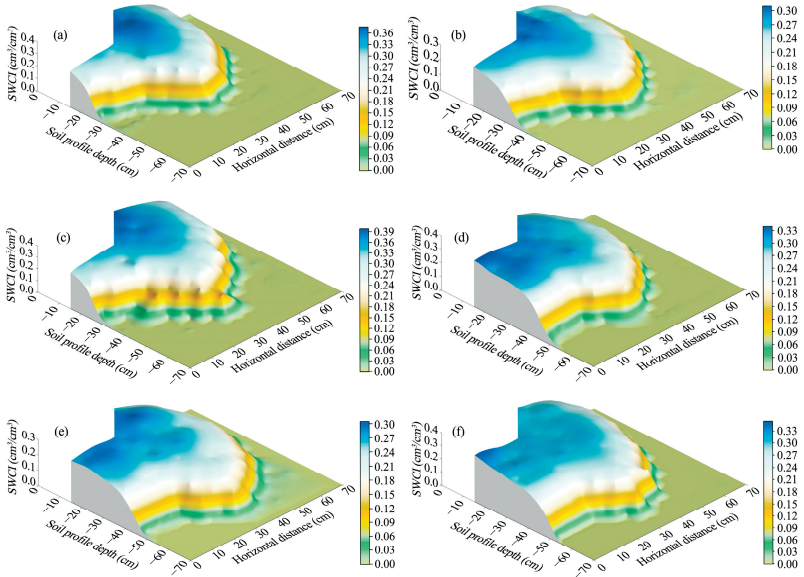
3 Results and discussion 3.1 Soil water distributionSoil water distribution under mulched furrow irrigation determines the optimum spacing and number of planting rows. The wetted soil volume achieved through irrigation should match the distribution of the root system. Soil water content increment (SWCI) in a semi ridge-furrow configuration for all the experimental treatments is illustrated in Figure 4. Mulched furrow irrigation clearly increased soil moisture lateral spreading, and resulted in excessively deep water infiltration under ridge shoulders and ridges. Capillary force initially drove lateral subsurface water flow, which wetted the ridges. Downward flow trends over time occurred due to gravitational forces. The volume of wetted soil tended to increase with an increase in initial SWC in both silt loam soil (Figures 4a and 4b) and sandy loam soil (Figures 4d and 4e). Previous studies have reported that soil hydraulic conductivity increased and unsaturated wetted zone can be easily saturated when initial SWC was greater (Enciso-Medina et al., 1998; Nie et al., 2009; Li and Liu, 2011). Similar results have also been reported in field measurements and model simulations under surface irrigation (Zhang et al., 2005; Zhang et al., 2013). Therefore, irrigation amount should take into account the initial SWC because soil moisture affects crop germination and growth. Higher furrow water level would trigger greater wetted soil volume in both silt loam soil (Figures 4a and 4c) and sandy loam soil (Figures 4d and 4f). Higher furrow water level produced a larger surface infiltration area and gravitational potential on furrow, which in turn increased the wetted soil volume. Previous studies show a positive correlation between cumulative infiltration and wetted perimeter without overlapped wetting patterns in stagnant blocked furrows (Strelkoff and Sousa, 1984; Izadi and Wallender, 1985; Abbasi et al., 2003). Irrigation with a higher furrow water level increased the uniformity of water distribution throughout the root zone. The volume of wetted soil was greater in sandy loam soil than silt loam soil, due to the greater saturated hydraulic conductivity of sandy loam soil (Table 1). Soil texture was the primary factor that determined the soil matric potential gradient to drive subsurface water movement.
|
| Figure 4 Soil water content increment (SWCI) after each irrigation experiment (Experiments 1 (a), 2 (b), 3 (c), 4 (d), 5 (e), and 6 (f)) |
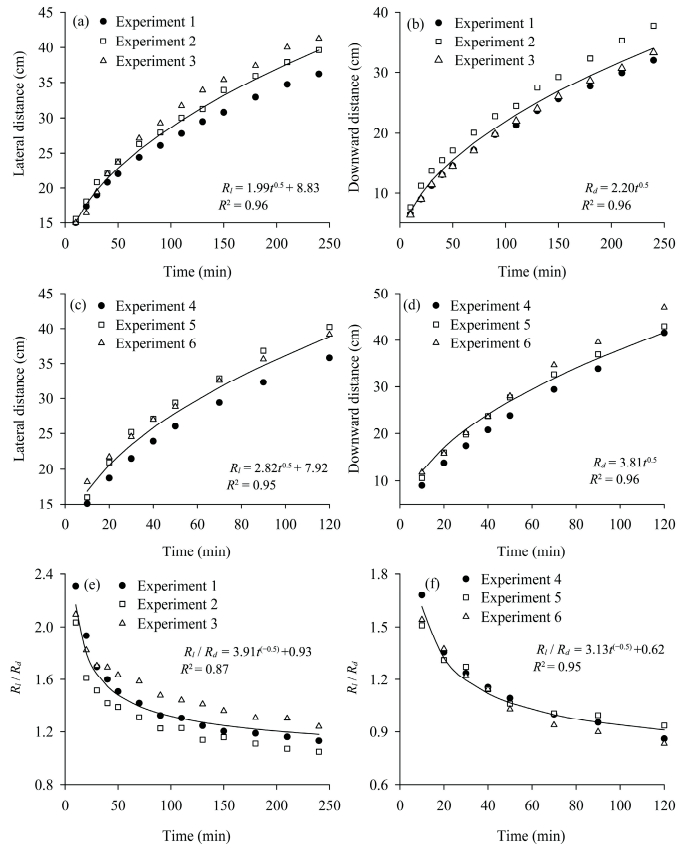
Ponding infiltration under cross-sectional irrigation of mulched furrows is regarded as a two-dimensional lateral and downward water fluxes (Figure 2). The lateral and downward wetted distances after each infiltration event are listed in Table 4. The wetting distances significantly differed between the two soil types. The lateral distance in silt loam soil was greater than the downward distance. The Rl/Rd ratio was more than 1 in Experiments 1-3. However, in sandy loam soil, the lateral distance never exceeded the downward distance. The average Rl/Rd ratio was 0.88 in Experiments 4-6.
| Experiment | Lateral distance (cm) | Downward distance (cm) | Lateral distance / Downward distance |
| 1 | 36.2 | 32.0 | 1.13 |
| 2 | 39.6 | 37.8 | 1.05 |
| 3 | 41.3 | 33.3 | 1.24 |
| Mean | 39.0 | 34.4 | 1.14 |
| 4 | 35.8 | 41.6 | 0.86 |
| 5 | 40.2 | 43.0 | 0.93 |
| 6 | 39.2 | 47.0 | 0.83 |
| Mean | 38.4 | 43.9 | 0.88 |
Soil water movement under mulched furrow irrigation was mainly driven by capillary and gravitational forces. The wetting patterns moved outward by the relative effect of gravitational over or below capillary driving forces. Lateral distance, downward distance, and Rl/Rd as a function of infiltration time in silt loam soil and sandy loam soil are presented in Figure 5. The wetting front initially moved laterally and downward rapidly, and then slowed down with the increase in infiltration time. Figure 5 illustrates the exponential relationship between the wetted lateral and downward distances and t0.5 for all experimental treatments. The variation of lateral distance (Rl, cm) with infiltration time (t, min) is described by the equation:
| ${R_l} = {L_1}{t^{0.5}} + {L_2}$ | (6) |
|
| Figure 5 Lateral distance, downward distance, and Rl/Rd as a function of time for the experimental treatments in silt loam soil and sandy loam soil |
A correlative analysis between downward distance (Rd, cm) and infiltration time is described by:
| ${R_d} = {L_3}{t^{0.5}}$ | (7) |
Similarly, the variation of Rl/Rd with infiltration time (t, min) is described by:
| ${R_l}/{R_d} = {L_4}{t^ - }^{0.5} + L{}_5$ | (8) |
where L1 to L5 are the fitting coefficients.
The R2 values of wetted lateral distance, downward distance, and Rl/Rd for all experimental treatments were more than 0.87. The regression parameters in Equations (6)-(8) were all significant at the P < 0.01 level (Figure 5). Thus, Equations (6) and (7) can be used to estimate the wetted lateral and downward distances for mulched furrow irrigation. The greater L1 and L3 in Experiments 4-6 illustrated that the wetting front moved faster in sandy loam soil than in silt loam soil. The asymptotic values of L5 in silt loam soil and sandy loam soil were 0.93 and 0.62, respectively (Figure 5). In silt loam soil, the downward wetting distance was relatively equal to the lateral distance. This result is comparable to findings of Nie et al. (2009), who reported a linear relation between the wetting distances and t0.5in furrow irrigation. As indicated in Equations (6) and (7), the fitting coefficients must be calibrated before these relationships can effectively be used to design the mulched furrow irrigation system.
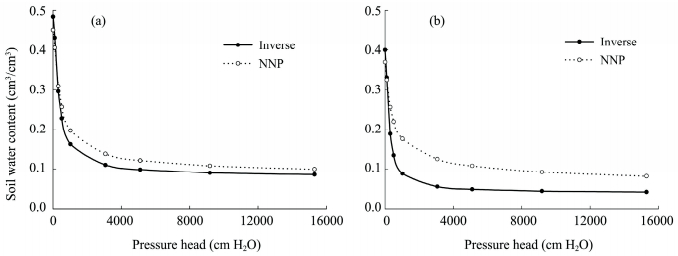
3.3 Model validationBefore modeling two-dimensional infiltration under mulched furrow irrigation, model calibrations were performed using experiment 1 and 4 for silt loam soil and sandy loam soil, respectively. In Figure 6, the optimized model parameters based on the inverse optimization (Inverse) were clearly different from the neural network parameter estimates (NNP). The soil water retention curve, θ(h), significantly differed between the two parameterization approaches. With the same pressure head, the Inverse simulation estimated lower soil water content than NNP. The estimated soil hydraulic parameters were compared with the parameter ranges documented in previous publications (Šimůnek et al., 2006; Nie et al., 2009).
|
| Figure 6 Comparison of the two simulation approaches with the van Genuchten-Mualem model in silt loam soil (a) and sandy loam soil (b) |
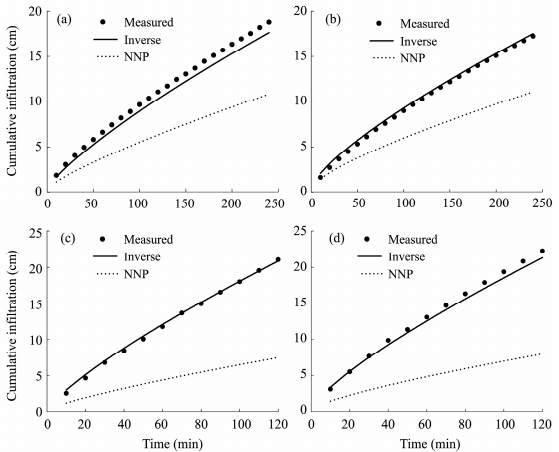
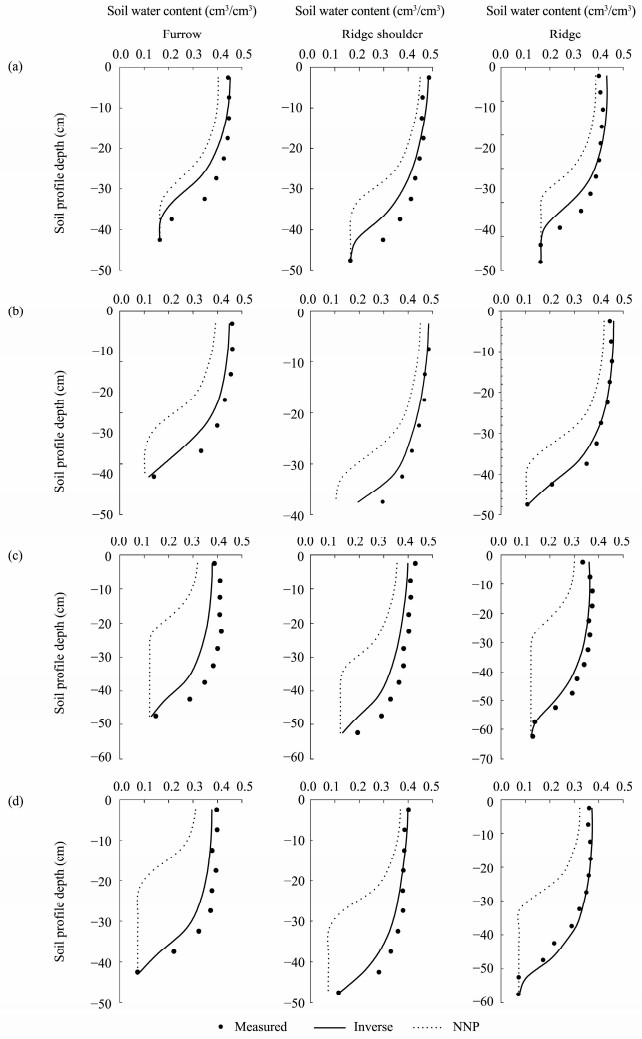
The soil hydraulic parameters estimated through the HYDRUS-2D model were validated using data from Experiments 2 and 3 for silt loam soil and Experiments 5 and 6 for sandy loam soil. The accuracy of model parameters was further assessed using RMSE. Cumulative infiltration and downward distance RMSE values showed a better goodness-of-fit for the Inverse methods relative to NNP (Table 5). The observed and predicted cumulative infiltration over time in the two soil types is presented in Figure 7. The HYDRUS-2D model with the inverse parameters effectively simulated cumulative infiltration and ridge, ridge shoulder, and furrow soil water content for both soil types (Figure 8). There were significant discrepancies between measured soil water content and predictions using the NNP method, with lower predicted soil water contents than the observed values. Therefore, the HYDRUS-2D simulations with the neural network-estimated parameters did not provide a good description of soil water movement. Saturated soil hydraulic conductivity was likely influenced by effects of soil repacking on the soil structure in the chambers used for these experiments. The hydraulic conductivity predicted by NNP was lower than the Inverse method predictions because of the effects of entrapped or dissolved air in the soil (Abbasi et al., 2004). Discrepancies between observed and predicted soil water contents are consistent with similar discrepancies reported in other studies (Abbasi et al., 2004; Ebrahimian et al., 2013), because no hysteresis of soil water characteristic curve was set in the simulations. Therefore, the inverse optimized parameters were more accurate than the estimated parameters based on neural network. These results confirm that the HYDRUS-2D model can be used to accurately simulate two-dimensional soil water dynamics under mulched furrow irrigation.
| Experiment | Model approach | Cumulative infiltration (cm) | Lateral distance (cm) | Downward distance (cm) |
| 2 | NNP | 5.162 | 1.608 | 4.098 |
| Inverse | 0.805 | 3.822 | 2.073 | |
| 3 | NNP | 3.915 | 2.751 | 2.758 |
| Inverse | 0.317 | 3.469 | 0.973 | |
| 5 | NNP | 8.628 | 4.057 | 8.809 |
| Inverse | 0.296 | 6.377 | 2.745 | |
| 6 | NNP | 9.353 | 1.759 | 11.098 |
| Inverse | 0.635 | 7.167 | 0.950 |
|
| Figure 7 Observed versus predicted cumulative infiltration for Experiments 2 (a), 3 (b), 5 (c), and 6 (d) in silt loam soil and sandy loam soil |
|
| Figure 8 Observed versus predicted soil water distribution for Experiments 2 (a), 3 (b), 5 (c), and 6 (d) in silt loam soil and sandy loam soil |
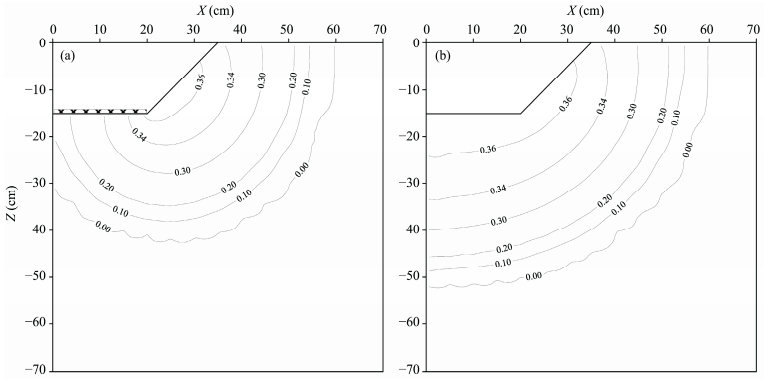
Field experiments and model simulations under furrow irrigation found that deep water and solute percolation below the root zone more easily occurred in furrows than ridges (Bargar et al., 1999; Abbasi et al., 2004; Chen et al., 2011). In order to increase the wetted lateral spreading, the effects of mulched and unmulched furrows on soil water distribution were simulated using the HYDRUS-2D model with inverse parameters. The wetting pattern under unmulched furrow irrigation differed from under mulched furrow irrigation in silt loam soil (Figure 9). The water infiltration contact area only reached the ridge shoulder position under mulched furrows, whereas the contact area with the furrow and ridge shoulder was greater under unmulched furrows. The greater wetted perimeter and gravitational potential under unmulched furrows, thus the more cumulative infiltration was produced. Lateral distances predicted by both simulation cases were relatively equal (Table 6). However, downward distance under unmulched treatment increased by 32.14% compared to under mulched treatment. The Rl/Rd ratio for mulched furrows was greater than for the unmulched furrows. These results confirm that deep water and solute percolation more easily occurred under unmulched furrow irrigation. The center of the wetted soil volume moved on ridge shoulder under mulched furrow treatment (Figure 9). The Rl was greater than Rd under mulched furrows (Table 6), illustrates that the effect of capillary forces driving lateral infiltration exceeded the gravitational forces driving downward infiltration. The speed of irrigated water flow under mulched furrows is faster, which promote irrigation uniformity between ridges and furrows and reduce soil evaporation (Zhang et al., 2005). Hence irrigation of film-mulched furrows is an effective practice.
|
| Figure 9 Changes in soil water content increment (SWCI) predicted by simulation 1 (a) and 2 (b) |
| Simulation | Treatment | Cumulative infiltration (cm2) | Rl (cm) | Rd (cm) | Rl/Rd |
| 1 | Mulched furrows | 365.12 | 38 | 28 | 1.36 |
| 2 | Unmulched furrows | 530.80 | 39 | 37 | 1.05 |
| Rl: Lateral distance; Rd: Downward distance. | |||||
Mulched furrow irrigation clearly increased soil moisture lateral spreading on ridge shoulders and ridges, due to enhancement of capillary driving force. Increasing initial SWC and irrigation water level resulted in an increase of the wetted soil volume. Simple regression equations describing the relationships between wetting front and elapsed time can be used to estimate the wetted lateral and downward distances, which conveniently provide guidelines and criteria for irrigation design. The optimized parameters by the Inverse approach were accurate, and the observed and simulated values were very close in the mathematical model. Based on model calibrations, HYDRUS-2D model provided a basis to evaluate the effect of mulched furrows on soil water distribution. There were significant differences in the wetting pattern and soil water distribution between unmulched and mulched furrows. The downward wetted distance under mulched furrows decreased by 32.14% compared to under unmulched furrows. Film-mulched furrows is recommended for furrow irrigation. The information provided by the HYDRUS-2D model is helpful for field mulched furrow irrigation design and management.
Acknowledgments:This work is supported by National Natural Science Foundation of China (NO. 41401036), China Postdoctoral Science Foundation (NO. 2015T81070, 2014M560818), and West Light Foundation of the Chinese Academy of Sciences. We would like to thank Christine Verhille at the University of British Columbia for her assistance with English language and grammatical editing of the manuscript. We also would like to thank reviewers and the editors for their constructive comments on this manuscript.
| Abbasi F, Adamsen FJ, Hunsaker DJ, et al, 2003. Effects of flow depth on water flow and solute transport in furrow irrigation:Field data analysis. Journal of Irrigation and Drainage Engi-neering-ASCE, 129: 237–246. doi: 10.1061/(asce)0733-9437(2003)129:4(237) |
| Abbasi F, Feyen J, van Genuchten MTh, 2004. Two-dimensional simulation of water flow and solute transport below furrows:model calibration and validation. Journal of Hydrology, 290: 63–79. doi: 10.1016/j.jhydrol.2003.11.028 |
| Bargar B, Swan JB, Jaynes D, 1999. Soil water recharge under uncropped ridges and furrows. Soil Science Society of America Journal, 63: 1290–1299. doi: 10.2136/sssaj1999.6351290x |
| Bezborodov GA, Shadmanov DK, Mirhashimov RT, et al, 2010. Mulching and water quality effects on soil salinity and sodicity dynamics and cotton productivity in Central Asia. Agriculture, Ecosystems & Environment, 138: 95–102. doi: 10.1016/j.agee.2010.04.005 |
| Chen LJ, Feng Q, Li FR, et al, 2015. Simulation of soil water and salt transfer under mulched furrow irrigation with saline wa-ter. Geoderma, 241: 87–96. doi: 10.1016/j.geoderma.2014.11.007 |
| Chen XL, Zhao XN, Wu PT, et al, 2011. Water and nitrogen dis-tribution in uncropped ridge-tilled soil under different ridge width. African Journal of Biotechnology, 10: 11527–11536. doi: 10.5897/AJB11.1344 |
| Crevoisier D, Popova Z, Mailhol JC, et al, 2008. Assessment and simulation of water and nitrogen transfer under furrow irriga-tion. Agricultural Water Management, 95: 354–366. doi: 10.1016/j.agwat.2007.10.021 |
| Ebrahimian H, Liaghat A, Parsinejad M, et al, 2013. Simulation of 1D surface and 2D subsurface water flow and nitrate transport in alternate and conventional furrow fertigation. Irrigation Science, 31(3): 301–316. doi: 10.1007/s00271-011-0303-3 |
| Enciso-Medina J, Martin D, Eisenhauer D, 1998. Infiltration model for furrow irrigation. Journal of Irrigation and Drainage Engi-neering-ASCE, 124: 73–80. doi: 10.1061/(asce)0733-9437(1998)124:2(73) |
| Humberto BC, Lal R, 2007. Impacts of long-term wheat straw management on soil hydraulic properties under no-tillage. Soil Science Society of America Journal, 71: 1166–1173. doi: 10.2136/sssaj2006.0411 |
| Izadi B, Wallender WW, 1985. Furrow hydraulic characteristics and infiltration. Transactions of the ASAE, 28: 1901–1908. doi: 10.13031/2013.32539 |
| Kandelous MM, Šimůnek J, 2010. Numerical simulations of water movement in as subsurface drip irrigation system under field and laboratory conditions using HYDRUS-2D. Agricultural Water Management, 97: 1070–1076. doi: 10.1016/j.agwat.2010.02.012 |
| Li JS, Liu YC, 2011. Water and nitrate distributions as affected by layered-textural soil and buried dripline depth under subsurface drip fertigation. Irrigation Science, 29: 469–478. doi: 10.1007/s00271-010-0255-z |
| Li JS, Zhang JJ, Ren L, 2003. Water and nitrogen distribution as affected by fertigation of ammonium nitrate from a point source. Irrigation Science, 22: 19–30. doi: 10.1007/s00271-003-0064-8 |
| Loos C, Gayler S, Priesack S, 2007. Assessment of water balance simulations for large scale weighing lysimeters. Journal of Hydrology, 335: 259–270. doi: 10.1016/j.jhydrol.2006.11.017 |
| Mailhol JC, Crevoisier D, Triki K, 2007. Impact of water applica-tion conditions on nitrogen leaching under furrow irrigation:experimental and modeling approaches. Agricultural Water Management, 87: 275–284. doi: 10.1016/j.agwat.2006.07.015 |
| Moravejalahkami B, Mostafazadeh-Fard B, Heidarpour M, et al, 2009. Furrow infiltration and roughness prediction for different furrow inflow hydrographs using a zero-inertia model with a multilevel calibration approach. Biosystems Engineering, 103: 374–381. doi: 10.1016/j.biosystemseng.2009.04.005 |
| Mualem Y, 1976. A new model for predicting the hydraulic con-ductivity of unsaturated porous media. Water Resources Re-search, 12: 513–522. doi: 10.1029/wr012i003p00513 |
| Nie WB, Ma XY, Wang SL, 2009. Forecast model for wetting front migration distance under furrow irrigation infiltration. Trans-actions of the Chinese Society of Agricultural Engineering, 25: 20–25. |
| Patel N, Rajput TBS, 2008. Dynamics and modeling of soil water under subsurface drip irrigated onion. Agricultural Water Management, 95: 1335–1349. doi: 10.1016/j.agwat.2008.06.002 |
| Richards LA, 1931. Capillary conduction of liquids through porous mediums. Physics, 1: 318–333. doi: 10.1063/1.1745010 |
| Schaap MG, Leij FJ, van Genuchten MTh, 2001. ROSETTA:a computer program for estimating soil hydraulic properties with hierarchical pedotransfer functions. Journal of Hydrology, 251: 163–176. doi: 10.1016/s0022-1694(01)00466-8 |
| Šimůnek J, Van Genuchten MTh, Šejna M, 2006. The HYDRUS software package for simulating the two-and three-dimensional movement of water, heat, and multiple solutes in varia-bly-saturated media. Technical Manual, Version 1.0. PC pro-gress, Prague, Czech Republic. Šimůnek J, Van Genuchten MTh, Šejna M, 2006. The HYDRUS software package for simulating the two-and three-dimensional movement of water, heat, and multiple solutes in varia-bly-saturated media. Technical Manual, Version 1.0. PC pro-gress, Prague, Czech Republic. |
| Skaggs TH, Trout TJ, Rothfuss Y, 2010. Drip irrigation water distribution patterns:effects of emitter rate, pulsing, and ante-cedent water. Soil Science Society of America Journal, 74: 1886–1896. doi: 10.2136/sssaj2009.0341 |
| Strelkoff T, Souza F, 1984. Modeling effect of depth on furrow infiltration. Journal of Irrigation and Drainage Engineering-ASCE, 110: 375–387. doi: 10.1061/(asce)0733-9437(1984)110:4(375) |
| Tabuada MA, Rego ZJC, Vachaud G, et al, 1995. Two-dimensional infiltration under furrow irrigation:Modeling, its validation and application. Agricultural Water Management, 27: 105–123. doi: 10.1016/0378-3774(95)01136-7 |
| Trout TJ, 1992. Flow velocity and wetted perimeter effects on furrow infiltration. Transactions of the ASAE, 35: 855–863. doi: 10.13031/2013.28670 |
| van Genuchten MTh, 1980. A closed-form equation for predicting the hydraulic conductivity of unsaturated soils. Soil Science Society of America Journal, 44: 892–898. doi: 10.2136/sssaj1980.03615995004400050002x |
| Warrick AW, 2003. Soil Water Dynamics. New York: Oxford University Press. |
| Zhang L, Wu PT, Fan XK, 2010. Numerical simulation of soil water movement with drip irrigation of multiple point source. Transactions of the Chinese Society of Agricultural Engineer-ing, 26(9): 40–45. |
| Zhang XY, Cai HJ, Wang J, 2005. Experimental study on influence factors of two-dimensional infiltration in furrow irrigation. Transactions of the Chinese Society of Agricultural Engineer-ing, 21: 38–41. |
| Zhang YY, Wu PT, Zhao XN, et al, 2012. Evaluation and modelling of furrow infiltration for uncropped ridge-furrow tillage in Loess Plateau soils. Soil Research, 50(5): 360–370. doi: 10.1071/sr12061 |
| Zhang YY, Wu PT, Zhao XN, et al, 2013. Simulation of soil water dynamics for uncropped ridges and furrows under irrigation conditions. Canadian Journal of Soil Science, 93(1): 85–98. doi: 10.4141/cjss2011-081 |
| Zhang YY, Zhao XN, Wu PT, 2015. Soil wetting patterns and water distribution as affected by irrigation for uncropped ridges and furrows. Pedosphere, 25(3): 468–477. doi: 10.1016/s1002-0160(15)30014-x |
| Zur B, 1996. Wetted soil volume as a design objective in trickle irrigation. Irrigation Science, 16: 101–105. doi: 10.1007/s002710050008 |
 2016, 8


