Article Information
- Bing Liu, HeLing Jin, Fan Yang . 2016.
- A late Holocene winter monsoon record inferred from the palaeo-aeolian sand dune in the southeastern Mu Us Desert, northern China
- Sciences in Cold and Arid Regions, 8(5): 388-399
- http://dx.doi.org/10.3724/SP.J.1226.2016.00388
Article History
- Received: June 16, 2016
- Accepted: August 13, 2016
2. State Key Laboratory of Earth Surface Processes and Resource Ecology, Beijing Normal University, Beijing 100875, China
The Asian monsoon is one of the most active components of the global climate system, and plays a significant role in global climate modulation (Kutzbach, 1981; An, 2000; Kutzbach et al., 2008). The Asian monsoons mainly consist of southeasterly and southwesterly Asian summer monsoons (East Asian summer monsoon (EASM), Indian summer monsoon, and the northerly Asian winter monsoon (EAWM)). The Asian summer monsoon was driven by the atmospheric pressure gradient between the Pacific, the Indian Ocean and Eurasia (Xiao JL et al., 2006). Increased EASM strength brings more precipitation or water vapor toward the Asian continent, especially in the typical monsoon region and monsoon marginal regions across China. The EAWM generally refers to the atmospheric flow over Asia associated with the eastward and southward movement of cold air coming from the Siberian High (Li and Morrill, 2015), whose surges dominate the winter weather over East Asia and affect the Southern Hemisphere (SH) monsoon.
In the past few decades the Asian summer monsoons have evolved greatly in terms of the framework process, abrupt events, and potential mechanisms; these have been discussed in the Holocene epoch based on different proxies from lakes, peat, caves, and aeolian archives (Hong et al., 2003; Xiao et al., 2004; Wang et al., 2005; Hu et al., 2008; Yu et al., 2011; Lu et al., 2013; Liu et al., 2014a; Chen et al., 2015), which established the high resolution of Asian summer monsoonal variation in different key study areas. Recently, integrated analysis methods were successfully applied to assess the spatial heterogeneity and phase relationships of the EASM in the different biology-climate belts (Herzschuh, 2006; Zhao et al., 2009; Wang et al., 2010; Zhang et al., 2011; Zhao and Yu, 2012; Wang and Feng, 2013; Li Q et al., 2014; Li Y et al., 2014; Wang et al., 2014; Liu et al., 2015; Rao et al., 2016). In comparison, the reconstruction of the EAWM is still relatively weak, being reflected in the lack of reliable results and inconsistent evidences from the existing records. At present, the relatively continuous winter monsoonal records are mainly distributed on the northwestern, southwestern, and southeastern lakes and shallow sea deposits in China (Xiao S et al., 2006; Yancheva et al., 2007; Liu et al., 2010; An et al., 2011; Huang et al., 2011; Wang et al., 2012; Tu et al., 2016; Zhang et al., 2016). There is still a lack of detailed data pertaining to winter monsoonal variation across the extensive monsoon marginal deserts and sandylands of northern China (Liu et al., 2013).
Aeolian sediments from the dry lands of the Loess Plateau and adjacent desert regions in northern China have been used as indicators to reconstruct the changes of the EAWM at different time scales (Xiao et al., 1995; An and Porter, 1997; Xia et al., 2014; Li and Morrill, 2015; Zhao et al., 2016). In the Gobi Desert in western China, Li and Morrill (2015) concluded that strong Early Holocene winter monsoon occurred and then declined since the Middle-Late Holocene, according to the robust proxies from the aeolian deposits and transient simulations. In the southern Loess Plateau, Xia et al. (2014) discovered that maximum winter monsoonal intensity dominated in the Early Holocene, whereas the minimum intensities occurred in the Middle and Late Holocene. In the southeastern Mu Us Desert, Zhao et al. (2016) demonstrated a long-term weakening trend of winter monsoon during 7.5-2.5 ka, which is probably attributable to the reduced thermal contrast between the Ocean and the Asian continent in both winter and summer, forced by the decreasing summer insolation and increased winter insolation. A comprehensive analysis by Zhang et al. (2015) indicated stronger EAWM during the Early Holocene than during the Middle and Late Holocene, although there was a remarkable regional difference from northwestern to southeastern China. These features were similar to the results from Wuxu Lake, Huguang Maar Lake, and the South China Sea (Yancheva et al., 2007; Huang et al., 2011; Wang et al., 2012; Zhang et al., 2016). Recently, new result (Wen et al., 2016) confirmed that the evolution of the EASM and EAWM is correlated at the orbital scale in response to precessional forcing, but is anti-correlated at the millennial time scale in response to meltwater forcing and the resulting changes in the Atlantic Meridional Overturning Circulation (AMOC).
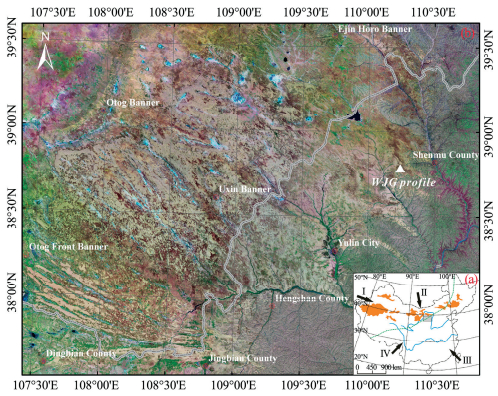
Obviously, in order to further verify the phase relationship and regional consistencies and differentiation, we must reconstruct the detailed winter variation in a key study area based on a reliable chronology and proxy. Therefore, we here report on a new winter monsoon record in the past 4.2 ka in the Mu Us Desert in northern China (Figure 1a), through the systematic analysis of grain size, carbonate and organic matter (OM), together with high-density optically stimulated luminescence (OSL) ages from the palaeo-aeolian sand dune in that desert. We discuss (1) what parameter most effectively reflects the Asian winter monsoon? (2) What is the scope of variation of the EAWM in the Late Holocene? and (3) What are the consistencies or differences of the EAWM record between our results and other archives in the different latitudes of the Northern Hemisphere?
|
| Figure 1 (a) Location of the Mu Us Desert (grey rectangle), green dashed line shows the present limit of the modern Asian summer monsoon, Ⅰ: Westerly, Ⅱ: Asian winter monsoon; Ⅲ: Southeastern summer monsoon; Ⅳ: Southwestern summer monsoon; yellow patches indicate deserts in northern China. (b) Wangjiagou Profile (WJG) and physical environment of the Mu Us Desert |
The Mu Us Desert (37°27'N-39°22'N, 107°20'E-111°30'E) has an area of 4.22×10⁴ km2 and an altitude between 1, 100 and 1, 500 m a.s.l. Its ground surface is dominated by fixed, semi-fixed, and mobile dunes. The semi-fixed and fixed dunes consist of honeycomb dunes, shrub-coppice dunes, and longitudinal dunes, while the mobile dunes are composed of trellis dunes and barchan dunes and chains (Figure 1b). The region has a typical arid and semi-arid continental monsoonal climate, with an annual average temperature of 6.0-9.0 ℃ and annual precipitation of 200-400 mm; 70% of the rainfall occurs in the summer. The modern vegetation is temperate steppe and desert steppe types, mainly Artemisia ordosica, Caragana microphylla, and xerophytic Gramineae spp. Additionally, Salix mongolica, Salix psammophila, Achnatherum splendens, and Kalidium foliatum (Pall.) also grow in interdunal depressions. The zonal soils consist of brown soil, light chestnut soil, and dark loessial soils from the west to east in this region, and the azonal soils are saline-alkali soil, meadow soil, and sandy soil (Liu et al., 2014b).
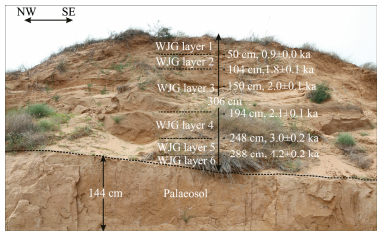
3 Materials and methodsThe Wangjiagou Profile (WJG) (38°47'N, 110°09'E) is situated in Shenmu County in the southeastern Mu Us Desert. It is a typical palaeo-mobile sand dune, dominated by typical aeolian sand in the top 306 cm, below which is palaeosol (306 to 450 cm). The aeolian sand is composed of turbid yellow-orange and greyish-yellow, medium-and fine-grained sand, moderately well-sorted, loose and with typical aeolian oblique bedding, which consists of six layers of aeolian sand deposited at different times. The OSL dating results (Figure 2) indicated that the six aeolian sand layers were accumulated around 4.2, 4.2-3.0, 3.0-2.1, 2.1-1.8, 1.8-0.9 ka, and since 0.9 ka, respectively. The palaeosol is grayish-yellow and light grey, medium-and fine-grained sand, weakly to moderately sorted, compacted to hard, and non-stratified (Figure 2; Liu et al., 2016).
|
| Figure 2 Lithostratigraphic units and OSL ages of the WJG Profile |
A total of 151 samples were collected at 2-cm intervals from the six sedimentary layers of the WJG Profile, to be tested for OM, carbonate content, and grain size. OM content was determined by loss on ignition (LOI) when the samples were heated at 550 ℃ for 2 hours. The CaCO3 content was analyzed by the gas method, using a carbonate content meter (Eijkelkamp Co., The Netherlands) at the Key Laboratory of Desert and Desertification, Northwest Institute of Eco-Environment and Resources, Chinese Academy of Sciences. Measurements were repeated four times and the results averaged. Grain-size analysis was performed at the Key Laboratory of Western China Environmental System (Ministry of Education), Lanzhou University. The dry sample (1.0~2.5 g) pretreatment was as follows: (1) 10 mL of 30% H2O2 was added to remove OM and soluble salts; (2) 10 mL of 10% HCl was added for 10 min to remove carbonates, using the heating method; (3) 10 mL of 0.05 g/L (NaPO3)6 was added to each sample and dispersed for about 10 min in an ultrasonic vibrator; and (4) each sample was transferred to a laser grain-size analyzer (Mastersizer 2000, Malvern Instruments Ltd., UK) for measurement. The estimated error was within 0.3%. The contents of the different grain size and mean and median grain size were obtained from the measurement software. In addition, several samples of surface deposits (0~5 cm) in some fixed, semi-mobile, and mobile sand dunes in the Mu Us Desert were analyzed for comparative study.
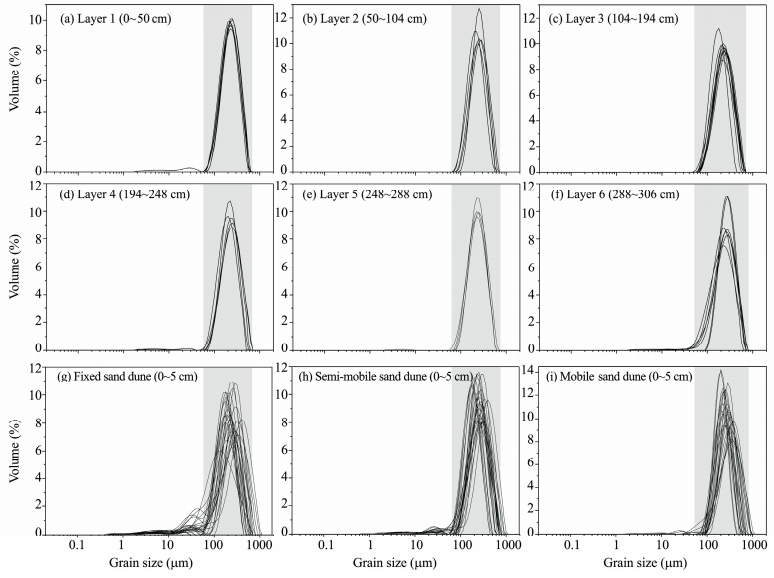
4 Results and analysis 4.1 Grain size characteristics of the palaeo-aeolian sand duneThe frequency curves of grain size from the different units of the aeolian sand in the WJG Profile are presented in Figure 3. The results indicated there was a remarkable main peak around 60~700 mm in the profile, which reflected the relatively stable sedimentary environment and single material source (Figures 3a-f). We also found a secondary peak around 10~50 mm, although there was a much lower content in a few samples, as shown by the aeolian sand units in layers 1, 3, 4, and 5 (Figure 3). These results were very similar to those of the grain-size frequency curves from the surface deposits of the different types of sand dunes in the Mu Us Desert (Figures 3g-i). We also calculated the grain-size components of the WJG Profile based on the Wentworth sizing grade. The results (Table 1) demonstrated that the material components were dominated by the fine and medium sand, with averages of 46.09% and 41.57%, respectively. The contents of the very fine sand and coarse sand were secondary and their averages were 8.63% and 3.33%, respectively. The contents of the other types (clay, silty, and very coarse sand) were all less than 1%.
|
| Figure 3 Frequency curves of the grain size from the different units of the WJG Profile and surface deposits of different types of sand dunes in the Mu Us Desert |
| Soil type | Content(%) | WJG N=l5l | WJG 1 N=26 | WJG 2 N=21 | WJG 3 N=45 | WJG 4 N=27 | WJG 5 N=20 | WJG 6 N=6 | Fixed dune N=25 | Semi-mobile dune N=25 | Mobile dune N=23 |
| Very coarse sand | Range | (Kl.79 | 0 | 0 | 0~1.79 | 0 | 0 | 0 | 0~0.31 | 0~0.15 | 0~0.36 |
| Average | 0.01 | 0 | 0 | 0.04 | 0 | 0 | 0 | 0.02 | 0.01 | 0.01 | |
| Coarse sand | Range | 0~12.25 | 0.2~6.33 | 0.09~8.14 | 0~8.50 | 0~12.25 | 0.47~7.41 | 3.0~9.94 | 0~26.63 | 0~16.76 | 0~28.41 |
| Average | 3.33 | 2.52 | 3.52 | 3.11 | 3.33 | 3.42 | 7.3 | 5.61 | 7.6S | 9.05 | |
| Medium sand | Range | 19.67~56.98 | 33.86~52.26 | 35.32~56.98 | 19.67~47.17 | 24.67~49.56 | 36.58~56.75 | 35.59~56.44 | 26.78~64.35 | 11.51~52.21 | 17.76^56.42 |
| Average | 41.57 | 42.35 | 45.76 | 37.62 | 39.79 | 45.52 | 43.86 | 34.21 | 42.69 | 47.6 | |
| Fine sand | Range | 34.04~61.15 | 39.68~51.60 | 36.39~54.37 | 39.18~61.15 | 34.24~54.67 | 35.03~54.26 | 34.04~43.37 | 17.82~67.67 | 24.56~56.84 | 15.33~56.40 |
| Average | 46.09 | 46.8 | 44.95 | 47.51 | 46.71 | 45.33 | 37.29 | 39.38 | 40.28 | 39.28 | |
| Very fine sand | Range | 0.01~20.62 | 2.19~14.48 | 0.6~10.86 | 5.97~20.18 | 3.96~20.62 | 0.8卜9.62 | 1.02~16.28 | 0.04~9.08 | 1.22~28.00 | 0.41~27.76 |
| Average | 8.63 | 8.02 | 5.86 | 11.34 | 9.76 | 5.58 | 9.33 | 11.7 | 6.89 | 3.52 | |
| Silty | Range | 0~3.14 | 0~3.14 | 0~1.72 | 0~1.99 | 0~1.71 | 0~0.70 | 0~2.71 | 0~3.38 | 0~11.00 | 1.27~18.37 |
| Average | 0.3 | 0.27 | 0.06 | 0.31 | 0.31 | 0.1 | 1.97 | 7.83 | 2.2 | 0.5 | |
| Clay | Range | 0~0.68 | 0~0.45 | 0~0.39 | 0~0.68 | 0~0.56 | 0~0.42 | 0~0.39 | 0~0.48 | 0~1.89 | 0~2.80 |
| Average | 0.06 | 0.04 | 0.01 | 0.07 | 0.1 | 0.05 | 0.25 | 1.25 | 0.25 | 0.02 |
In the different units of the aeolian sand in the WJG Profile, the variation of the grain-size components remained relatively stable in general. Compared to those of the surface deposits in the Mu Us Desert, we discovered that the medium and fine sand dominated the surface deposits, and their average contents were 34.21% and 39.38%, respectively, in the fixed dunes, 42.69% and 40.28% in the semi-mobile dunes, and 47.60% and 39.28% in the mobile dunes. The contents of the coarse sand and very fine sand were relatively low, with means of 5.61% and 11.70%, 7.68% and 6.89%, and 90.5% and 3.52%, respectively, in the surface deposits (Table 1). Clearly, the frequency curves and grain-size components in the WJG Profile and the surface sediments in the Mu Us Desert, as well as the sedimentology characteristics in the field study, were very similar, and we therefore assumed that the WJG Profile is probably a palaeo-aeolian sand dune.
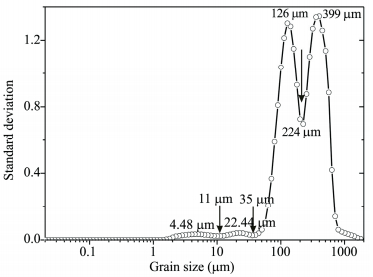
4.2 Sensitive components and environmental significancesGrain size is very sensitive proxy for the variation of the sedimentary environment and Asian monsoonal evolution (Porter and An, 1995; Xiao et al., 1995; Ding et al., 1999; Lv et al., 2004). Over the past decade, environmentally sensitive grain-size components extracted from grain-size data according to different methods have been widely used to reconstruct the past climatic conditions, especially regarding EAWM strength (Xiang et al., 2006; Liu et al., 2010; Hu et al., 2012; Li and Morrill, 2015). In this study, we applied the grain-size standard deviation model to extract environmentally sensitive grain-size components from the grain-size frequency distribution curve. The standard deviation reflects the dispersion degree of the data; a large standard deviation means the data are widely spread out, while a small value means the data are grouped closely together. Hence, the environmentally sensitive grain-size component can be acquired by analyzing the standard deviation of the frequency distribution data for all the samples, and then determining the sensitivity of every grain-size component.
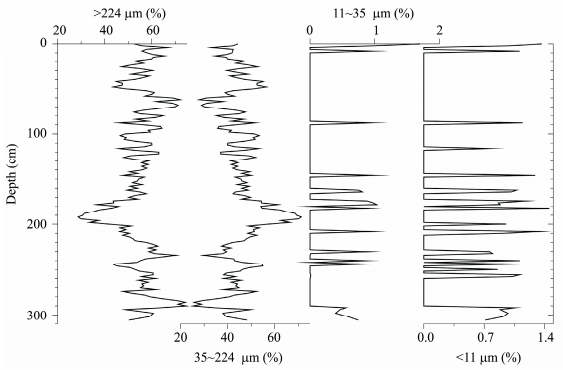
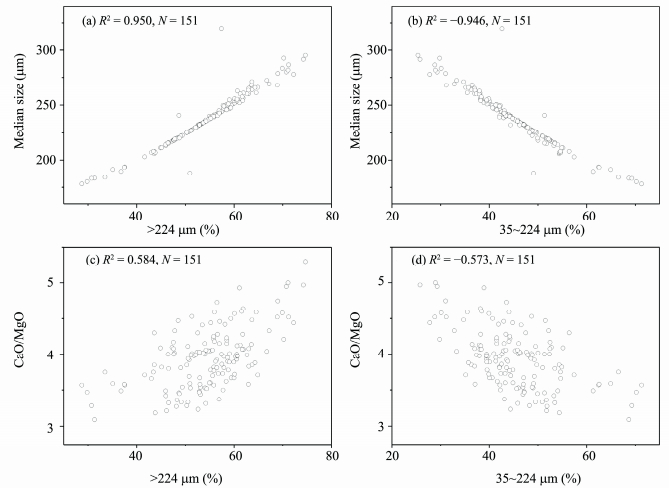
Figure 4 shows the curves of the grain-size standard deviation model for the WJG Profile. There were four environmentally sensitive grain-size components: > 224, 35~224, 11~35, and < 11 mm. We then extracted the contents of each grain-size category from the WJG Profile; Figure 5 indicates that the > 224 and 35~224 mm components dominated (~98%) the sediments content in the profile, whereas the contents of 11~35 and < 11 mm were very low ( < 2%). Because the fine-particle material was probably subsided by long-distance transported dust and regional biogeochemical weathering (Pye, 1987; Gao et al., 1993), it was not suitable for reflecting the regional climatic factors. Modern observations have indicated that stronger aeolian activity occurs in the winter season, with its intense surface winds; the surface components had more coarse grain sizes during those times. This phenomenon is also supported by the geological record, which indicated that the Mu Us Desert experienced a large-scale southward migration in the glacial epoch, accompanying intensive EAWM and cold-dry environment (Ding et al., 1999). The coarse particles mainly migrated in the form of creep and saltation at nearly the ground surface (Pye, 1987), so we therefore assessed its environmental significance. In the Loess Plateau the median grain size can be regarded as the indicator for wind power and winter monsoonal strength (Xiao et al., 1995). Figures 6a, b indicate a positive relationship between the median and the > 224 mm size in the WJG Profile, whereas there was a negative correlation with the 35~224 mm size. These results demonstrated that the > 224 mm content increased with enhanced winter monsoonal intensity, owing to their immobility, while the 35~224 mm content was gradually reduced with stronger winter monsoon. The Mu Us Desert is located at the frontier of the Asian winter monsoonal region, so in winter the deflation of stronger winter monsoons leads to increased coarse particles ( > 224 mm) and decreased relatively fine material (35~224 mm). Also, we also found a positive relation between CaO/MgO content and > 224 mm grains (Figure 6c), because increased CaO/MgO is coincident with the enhanced aridification forced by powerful winter monsoon (Liu et al., 2015, 2016). In contrast, the CaO/MgO and 35~224 m grains presented a negative relation in the WJG Profile (Figure 6d), which also supports our decision to select the > 224 mm content as the EAWM indicator with cold and dry conditions.
|
| Figure 4 Grain-size standard deviation model of the WJG Profile |
|
| Figure 5 Sensitive grain-size components extracted from the WJG Profile |
|
| Figure 6 Relationship of the sensitive grain-size components and other proxies in the WJG Profile |
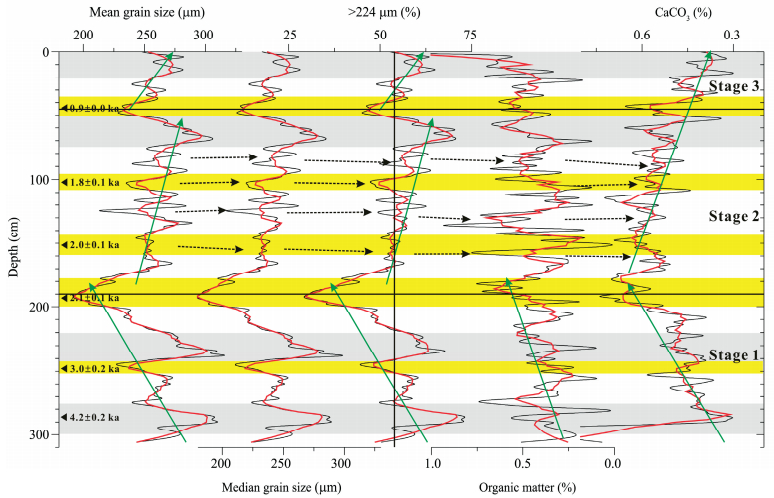
OM of aeolian sediments can also be related to the EAWM in northern China, since the dry conditions produced by strong winter monsoon reduces the plant growth and preservation in the surface of the aeolian deposits (Xiao et al., 2002; Li and Morrill, 2015). The carbonate is an important index for weighing the variation of dry and wet conditions and related winter monsoon strength. At present, the Mu Us Desert is situated in the transitional belt, which is very favorable for accumulation of carbonate, accompanied by semi-arid and semi-humid conditions. However, the carbonate content becomes low when the climate tends to be aridified by expansive winter monsoon (Gao et al., 1993). The OM content variation was 0%~1.79% in the WJG Profile, with an average of 0.44%. This parameter presented a series of peaks and valleys with the depth, which probably illustrates the alternately cold and warm events during that time. Generally, the variation of the OM content was negative with the winter monsoon index in the profile, whereas the opposite change occurred between carbonate and > 224 mm content. The carbonate was 0.28%~0.96% and its average was 0.52%. The carbonate content remained high below the 200-cm depth, then clearly declined around 200 to 180 cm, and gradually increased above that in the profile (Figure 7). This mirrored a framework variation of the EAWM in the Mu Us Desert during the past 4.2 ka.
|
| Figure 7 Variations of EAWM revealed by the grain size, OM and carbonate proxies in the WJG profile |
We reconstructed the Late Holocene EAWM history on the basis of the grain-size standard deviation model and the OM and carbonate content, together with six OSL ages. As a whole, the variation of the winter monsoonal strength could be divided into three stages: the gradually declined winter monsoon in 4.2-2.1 ka, the rapidly enhanced but unstable winter monsoon in 2.1-0.9 ka, and rapidly increased winter monsoon after 0.9 ka (Figure 7).
Stage 1: 4.2-2.1 ka. The winter monsoonal strength gradually declined, as evidenced by the grain-size parameters and the OM and carbonate contents. Figure 7 indicates the rapidly reduced mean and median grain sizes, the content of environmentally sensitive components, and the increased OM content in this stage; the carbonate content was clearly high, although there were several apparent fluctuations. Around 4.2 ka, the mean, median, and > 224 mm grain sizes approached their maxima in the profile, while the OM content presented clearly low, which recorded an interval of intense winter monsoon around the study area. These variations were very accordant with those characteristics at the 220~240 cm depth in the profile, which were probably associated with 2.8 ka cold events in the Northern Hemisphere. In contrast, two intervals of declined winter monsoon took place around 3.0 and 2.1 ka; the latter can be deduced by the minimum mean and median grain sizes, the lowest content of the sensitive component, and enhanced vegetation coverage, which was coincident with the maximum carbonate content.
Stage 2: 2.1-0.9 ka. The winter monsoons were gradually enhanced but unstable. All parameters presented several peak and valley cycles, which were closely related to the periodic variation of the winter monsoon, i.e., the relatively small mean and median grain sizes, and low > 224 mm and enhanced OM contents in the depth intervals of 80~90, 100, 115~125, and 140~160 cm, which implied secondary and weak winter monsoon. Conversely, relatively stronger winter monsoon events are documented between them. Combined with direct OSL dating, two weak winter monsoonal intervals occurred around 2.1 and 1.8 ka, while evidence of a stronger, widespread winter monsoon event was found around the 50~80 cm depth, corresponding to a 1.4 ka cold event, accompanied by increased contents of the sensitive fraction and carbonate. It is notable that the winter monsoonal strength became obviously weak again around 0.9 ka (Medieval Warm Period, MWP), as revealed by the declined grain-size parameters and increased OM content, although the carbonate content remained relatively high.
Stage 3: after 0.9 ka. The winter monsoon became strong again, which was indicated by the increased amount of the sensitive grain size and the maximum carbonate above 20 cm. We preliminarily concluded that this interval was possibly related to the Little Ice Age (LIA) after 0.9 ka.
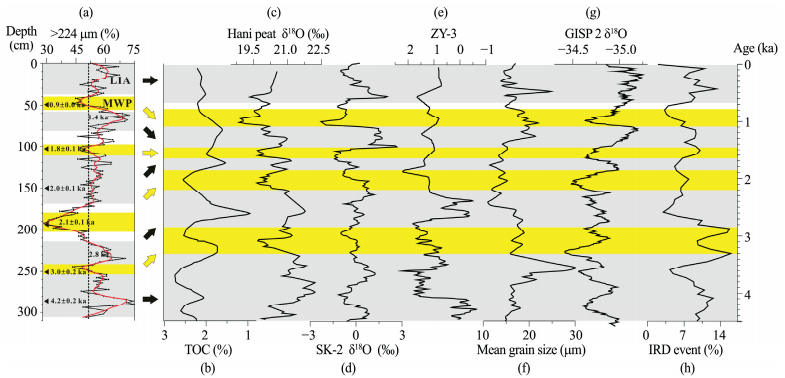
5.2 Comparison of winter monsoonal variations and typical climate eventsAs mentioned above, we reconstructed the framework process of the winter monsoon and discovered several typical climate events in the Mu Us Desert during the last 4.2 ka (Figure 8a). These are the cold events (stronger winter monsoon) around 4.2, 2.8, 1.4 ka, and the LIA, and relatively warm intervals (weak winter monsoon) around 3.0, 2.1, 1.8, and 0.9 ka. These similar climate events were also recorded in various archives in lakes, stalagmites, aeolian materials, and sea sediments. In northwestern China, the TOC content of the Huangyanghe Profile indicated that there had been several stronger and weaker cycles of winter monsoon, as illustrated by Figure 8b, although declined winter monsoonal intensity since the Mid-Holocene (Li and Morrill, 2015). In the Mu Us Desert, the gradually reduced mean, median, and modal grain sizes mirrored weakening winter monsoon during 4.0-2.5 ka (Zhao et al., 2016). In northeastern China, the Hani peat cellulose δ18O indicated that several cold events (temperature anomalies) occurred around 4.8-3.8, 3.6-2.8, 1.8-1.3, and 0.45-0.25 ka after the MWP (Figure 6c; Hong et al., 2009). In the Fukugaguchi Cave in western Japan, Sone et al. (2013) discovered that EAWM intensity quickly decreased and remained at a lower level around 4.5-3.0 ka. Afterwards, the winter monsoon presented high-amplitude changes at millennial time scales, with two peak intervals in 2.9-2.5 and 1.3-0.7 ka. Similar results were derived from northern Japan, where Sagawa et al. (2014) reconstructed the centennial-scale variability of the EAWM during the past 6.0 ka using the signal of stalagmite δ18O, which revealed enhanced winter monsoon around 3.8-3.5, 2.4-2.0, 1.5-1.0, and 0.4-0.2 ka (Figure 6d). In the southwestern Jeju Island, weak winter monsoon dominated the region before 1.9 and 1.45-0.78 ka, while it was relatively intensive around 1.9-1.45 and 0.78-0.22 ka (Xiang et al., 2006). In the inner shelf of the East China Sea, centennial-scale strong winter monsoonal events occurred at 3.65, 2.8, 2.35, 1.95, 1.05, 0.55, and 0.25 ka (Liu et al., 2010), which were roughly consistent with that of records from the muddy sediments close to the side of the southern Yellow Sea continental shelf (Figures 8e and f; Hu et al., 2012). Recently, Ge et al. (2012) concluded that eight increased winter monsoon events in the South China Sea were accordant with the δ18O evidence in Greenland in the past 3.0 ka, i.e., 2.55-2.38, 2.1-1.98, 1.65-1.54, 0.98, 0.73, 0.63, 0.47-0.42, and 0.17-0.12 ka. The archives of ice cores and deep-sea sediments also showed periodic cold intervals in the North Atlantic Ocean region, which probably had a close teleconnection with the Mongolia-Siberian High pressure system, resulting in the relatively synchronous variation of extreme climate events in the monsoonal boundary region, islands, and coastal areas in East Asia (The Greenland Summit Ice Cores, 1997; Bond et al., 2001; Wen et al., 2016). In comparison, the weak winter monsoonal events also gave rise to relatively warm intervals in the aforementioned areas, as documented by the WJG Profile in the southeastern Mu Us Desert around the MWP, 1.8, 2.1, and 3.0 ka (Figures 7 and 8). Previous study has indicated that millennial-or centennial-scale cold events are mainly controlled by weakening EASM (Liu et al., 2015, 2016), resulting in the lessened effective moisture/dry conditions around the East Asian monsoon marginal region, whereas new evidence provided in this study suggests that cold-dry intervals are forced by intensive winter monsoon. In a sense, our results support the opinion of an anti-correlation between the Asian winter and summer monsoon on the millennial-centennial time scale, especially in the Late Holocene epoch.
|
| Figure 8 Comparison of the EAWM record in East Asia and high latitudes of the Northern Hemisphere. (a) Sensitive grain-size components in the WJG profile (this study), (b) TOC content in the Huangyanghe profile (Li and Morrill, 2015), (c) Hani peat cellulose δ18O record (Hong et al., 2009), (d) δ18O record of the SK-2 stalagmite in northern Japan (Sagawa et al., 2014), (e) ZY-3 core in the southern Yellow Sea (Hu et al., 2012), (f) mean grain size in the muddy area on the inner shelf of the East China Sea (Liu et al., 2010), (g) δ18O record of the GISP 2 (The Greenland Summit Ice Cores, 1997), (h) ice rafting debris event (IRD) in the North Atlantic Ocean (Bond et al., 2001). |
A systematic grain-size analysis was conducted on materials from the palaeo-aeolian sand dune in the southeastern Mu Us Desert in northern China, to verify the history of the Late Holocene winter monsoon evolution in that region. These grain-size components were combined with the OM and carbonate contents and OSL ages of the materials. Based on the grain-size standard deviation model and correlation analysis, our results indicated that the > 224 mm content of the sand profile can be regarded as an indicator of winter monsoonal intensity. The winter monsoon gradually declined in 4.2-2.1 ka, enhanced but unstable in 2.1-0.9 ka, and then the winter monsoon strength became strong again. A series of abrupt climate events, i.e., stronger winter monsoon, occurred in 4.2, 2.8, 1.4 ka, and the LIA, and relatively weak phases occurred around 3.0, 2.1, 1.8 ka, and the MWP, which were roughly consistent with the records of various archives in East Asia and the high latitudes of the Northern Hemisphere. We also found preliminary evidence of an anti-correlation relationship between the Asian winter and summer monsoons in the Late Holocene at millennial or centennial time scales, in view of the variations of the EASM domain.
Acknowledgments:This research was funded by the Knowledge Innovation Program of the Chinese Academy of Sciences (No. KZZD-EW-04-04), the National Natural Science Foundation of China (Nos., 41271215, 41501220), the China Postdoctoral Science Foundation (No. 2015M570861), and the State Key Laboratory of Earth Surface Processes and Resource Ecology, Beijing Normal University (No. 2015-KF-13). We kindly thank Prof. Hua Zhao from the Institute of Hydrogeology and Environmental Geology, Chinese Academy of Geological Sciences for the determination of the OSL ages.
| An CB, Zhao JJ, Tao SC, et al, 2011. Dust variation recorded by lacustrine sediments from arid Central Asia since~15 cal ka BP and its implication for atmospheric circulation. Quaternary Research, 75: 566–573. doi: 10.1016/j.yqres.2010.12.015 |
| An ZS, 2000. The history and variability of the East Asian pale-omonsoon climate. Quaternary Science Reviews, 19: 171–187. doi: 10.1016/S0277-3791(99)00060-8 |
| An ZS, Porter SC, 1997. Millennial-scale climatic oscillations during the last interglaciation in central China. Geology, 25: 603–606. doi: 10.1130/0091-7613(1997)025 |
| Bond G, Kromer B, Beer J, et al, 2001. Persistent solar influence on North Atlantic climate during the Holocene. Science, 294: 2130–2136. doi: 10.1126/science.1065680 |
| Chen F, Xu Q, Chen J, et al, 2015. East Asian summer monsoon precipitation variability since the last deglaciation. Science Reports, 5: 11186. doi: 10.1038/srep11186 |
| Ding ZL, Sun JM, Liu TS, 1999. A sedimentological proxy indi-cator linking changes in loess and deserts in the Quaternary. Science in China (Series D), 4(2): 146–152. doi: 10.1007/BF02878513 |
| Gao SY, Cheng WN, Jin HL, et al, 1993. Preliminary study on the desert changes at the northwest edge of China. Science in China (Series B), 23(2): 203–208. |
| Ge Q, Chu FY, Ye LM, et al, 2012. East Asian winter monsoon records from the mud area, northern shelf of the South China Sea. Journal of Marine Sciences, 30(3): 56–62. |
| Herzschuh U, 2006. Palaeo-moisture evolution in monsoonal Central Asia during the last 50, 000 years. Quaternary Science Reviews, 25: 163–178. doi: 10.1016/j.quascirev.2005.02.006 |
| Hong B, Liu CQ, Ling QH, et al, 2009. Temperature evolution from the δ18O record of Hani peat, Northeast China, in the last 14, 000 years. Science in China (Series D):Earth Sciences, 52(7): 952–964. doi: 10.1007/s11430-009-0086-z |
| Hong YT, Hong B, Lin QH, et al, 2003. Correlation between Indian Ocean summer monsoon and North Atlantic climate during the Holocene. Earth and Planetary Sciences Letters, 211: 371–380. doi: 10.1016/S0012-821X(03)00207-3 |
| Hu BQ, Yang ZS, Zhao MX, et al, 2012. Grain size records reveal variability of the East Asian winter monsoon since the middle Holocene in the Central Yellow Sea mud area, China. Science China (Earth Sciences), 55: 1656–1668. doi: 10.1007/s11430-012-4447-7 |
| Hu C, Henderson GM, Huang J, et al, 2008. Quantification of Holocene Asian monsoon rainfall from spatially separated cave records. Earth and Planetary Science Letters, 266: 221–232. doi: 10.1016/j.epsl.2007.10.015 |
| Huang EQ, Tian J, Steinke S, 2011. Millennial-scale dynamics of the winter cold tongue in the southern South China Sea over the past 26 ka and the East Asian winter monsoon. Quaternary Research, 75: 196–204. doi: 10.1016/j.yqres.2010.08.014 |
| Kutzbach JE, 1981. Monsoon climate of the early Holocene:climate experiment with the earth's orbital parameters for 9000 years ago. Science, 214: 59–61. doi: 10.1126/science.214.4516.59 |
| Kutzbach JE, Liu XD, Liu ZY, et al, 2008. Simulation of the evolutionary response of global summer monsoon to orbital forcing over the past 280, 000 years. Climate Dynamics, 30: 567–579. doi: 10.1007/s00382-007-0308-z |
| Li Q, Wu HB, Yu YY, et al, 2014. Reconstructed moisture evolu-tion of the deserts in northern China since the Last Glacial Maximum and its implications for the East Asian Summer Monsoon. Global and Planetary Change, 121: 101–112. doi: 10.1016/j.gloplacha.2014.07.009 |
| Li Y, Morrill, 2015. A Holocene East Asian winter monsoon record at the southern edge of the Gobi Desert and its comparison with a transient simulation. Climate Dynamics, 45: 1219–1234. doi: 10.1007/s00382-014-2372-5 |
| Li Y, Wang NA, Zhou XH, et al, 2014. Synchronous or asyn-chronous Holocene Indian and East Asian summer monsoon evolution:A synthesis on Holocene Asian summer monsoon simulations, records and modern monsoon indices. Global and Planetary Change, 116: 30–40. doi: 10.1016/j.gloplacha.2014.02.005 |
| Liu B, Jin HL, Sun LY, et al, 2014b. Holocene moisture change revealed by the Rb/Sr ratio of aeolian deposits in the south-eastern Mu Us Desert, China. Aeolian Research, 13: 109–119. doi: 10.1016/j.aeolia.2014.03.006 |
| Liu B, Jin HL, Sun LY, et al, 2015. Geochemical evidence for Holocene millennial-scale climatic and environmental changes in the southeastern Mu Us Desert, northern China. International Journal of Earth Sciences, 104: 1889–1900. doi: 10.1007/s00531-015-1161-7 |
| Liu B, Jin HL, Sun Z, et al, 2013. Winter and summer monsoonal evolution in Gonghe Basin, northeastern Qinghai-Tibetan Plateau since the Last Glacial Maximum. Sciences in Cold and Arid Regions, 5(3): 0282–0292. doi: 10.3724/SP.J.1226.2013.00282 |
| Liu B, Jin HL, Sun Z, et al, 2014a. Evidence of Holocene millen-nial-scale climatic change from Gonghe Basin peat deposit, northeastern Qinghai-Tibet Plateau. Journal of Arid Environ-ments, 106: 1–10. doi: 10.1016/j.jaridenv.2014.03.003 |
| Liu B, Jin HL, Sun Z, et al, 2016. Geochemical weathering of aeolian sand and its palaeoclimatic implications in the Mu Us Desert, northern China, since the Late Holocene. Journal of Arid Land, 8(5): 647–659. doi: 10.1007/s40333-016-0014-y |
| Liu JB, Chen JH, Zhang XJ, et al, 2015. Holocene East Asian summer monsoon records in northern China and their incon-sistency with Chinese stalagmite δ18O records. Earth-Science Reviews, 148: 194–208. doi: 10.1016/j.earscirev.2015.06.004 |
| Liu SF, Shi XF, Liu YG, et al, 2010. Records of the East Asian winter monsoon from the mud area on the inner shelf of the East China Sea since the mid-Holocene. Chinese Science Bulletin, 55: 2306–2314. doi: 10.1007/s11434-010-3215-3 |
| Lu H, Yi S, Liu Z, et al, 2013. Variation of East Asian monsoon precipitation during the past 21 ka and potential CO2 forcing. Geology, 41: 1023–1026. doi: 10.1130/G34488.1 |
| Lv LQ, Fang XM, Lu HY, et al, 2004. Millennial-scale climate change since the last glaciation record by grain size of loess deposits on the northeastern Tibetan Plateau. Chinese Sciences Bulletin, 49(11): 1157–1164. doi: 10.1360/03wd0467 |
| Porter SC, An ZS, 1995. Correlation between climate events in the North Atlantic and China during the last Glaciation. Nature, 375: 305–308. doi: 10.1038/375305a0 |
| Pye K, 1987. Aeolian Dust and Dust Deposits. London: Academic Press. |
| Rao ZG, Li YX, Zhang JW, et al, 2016. Investigating the long-term palaeoclimatic controls on the δD and δ18O of precipitation during the Holocene in the Indian and East Asian monsoonal regions. Earth-Science Reviews, 159: 292–305. doi: 10.1016/j.earscirev.2016.06.007 |
| Sagawa T, Kuwae M, Tsuruoka K, et al, 2014. Solar forcing of centennial-scale East Asian winter monsoon variability in the mid-to late Holocene. Earth and Planetary Science Letters, 395: 124–135. doi: 10.1016/j.epsl.2014.03.043 |
| Sone T, Kano A, Okumura T, et al, 2013. Holocene stalagmite oxygen isotopic record from the Japan Sea side of the Japanese Islands, as a new proxy of the East Asian winter monsoon. Quaternary Science Reviews, 75: 150–160. doi: 10.1016/j.quascirev.2013.06.019 |
| The Greenland Summit Ice Cores, 1997. Available from the Na-tional Snow and Ice Data Center, University of Colorado at Boulder, and the World Data Center-A for Paleoclimatology, National Geophysical Data Center, Boulder, CO. Also available online at:www.ngdc.noaa.gov/paleo/icecore/greenland/summit/index.html. The Greenland Summit Ice Cores, 1997. Available from the Na-tional Snow and Ice Data Center, University of Colorado at Boulder, and the World Data Center-A for Paleoclimatology, National Geophysical Data Center, Boulder, CO. Also available online at:www.ngdc.noaa.gov/paleo/icecore/greenland/summit/index.html. |
| Tu LY, Zhou X, Wang WH, et al, 2016. Holocene East Asian winter monsoon changes reconstructed by sensitive grain size of sediments from Chinese coastal seas:A review. Quaternary International,. doi: 10.1016/j.quaint.2016.03.024 |
| Wang HP, Chen JH, Zhang XJ, et al, 2014. Palaeosol development in the Chinese Loess Plateau as an indicator of the strength of the East Asian summer monsoon:Evidence for a mid-Holocene maximum. Quaternary International, 334-335: 155–164. doi: 10.1016/j.quaint.2014.03.013 |
| Wang L, Li JJ, Lu HY, et al, 2012. The East Asian winter monsoon over the last 15, 000 years:its links to high-latitudes and tropical climate systems and complex correlation to the summer mon-soon. Quaternary Science Reviews, 32: 131–142. doi: 10.1016/j.quascirev.2011.11.003 |
| Wang W, Feng ZD, 2013. Holocene moisture evolution across the Mongolian Plateau and its surrounding areas:A synthesis of climatic records. Earth-Science Reviews, 122: 38–57. doi: 10.1016/j.earscirev.2013.03.005 |
| Wang YB, Liu XQ, Herzschuh U, 2010. Asynchronous evolution of the Indian and East Asian Summer Monsoon indicated by Holocene moisture patterns in monsoonal central Asia. Earth-Science Reviews, 103: 135–153. doi: 10.1016/j.earscirev.2010.09.004 |
| Wang YJ, Cheng H, Edwards RL, et al, 2005. The Holocene Asian Monsoon:links to solar changes and North Atlantic Climate. Science, 308: 854–857. doi: 10.1126/science.1106296 |
| Wen XY, Liu ZY, Wang SW, et al, 2016. Correlation and an-ti-correlation of the East Asian summer and winter monsoons during the last 21, 000 years. Nature Communications,. doi: 10.1038/ncomms11999 |
| Xia DS, Jia J, Li GH, et al, 2014. Out-of-phase evolution between summer and winter East Asian monsoons during the Holocene as recorded by Chinese loess deposits. Quaternary Research, 81: 500–507. doi: 10.1016/j.yqres.2013.11.002 |
| Xiang R, Yang ZS, Saito Y, et al, 2006. East Asia winter monsoon changes inferred from environmentally sensitive grain size component records during the last 2, 300 years in mud area southwest off Cheju Island, ECS. Science in China (Series D), 49: 604–614. doi: 10.1007/s11430-006-0604-1 |
| Xiao JL, Nakamura T, Lu H, et al, 2002. Holocene climate changes over the desert/loess transition of north-central China. Earth Planetary Science Letters, 197: 11–18. doi: 10.1016/S0012-821X(02)00463-6 |
| Xiao JL, Porter SC, An ZS, et al, 1995. Grain-size of quartz as an indicator of winter monsoon strength on the Loess Plateau of central China during the last 130, 000 a. Quaternary Research, 43: 22–29. doi: 10.1006/qres.1995.1003 |
| Xiao JL, Wu JT, Si B, et al, 2006. Holocene climate changes in the monsoon/arid transition reflected by carbon concentration in Daihai Lake of Inner Mongolia. The Holocene, 16(4): 551–560. doi: 10.1191/0959683606hl950rp |
| Xiao JL, Xu QH, Nakamura T, et al, 2004. Holocene vegetation variation in the Daihai Lake region of north-central China:a direct indication of the Asian monsoon climatic history. Qua-ternary Science Reviews, 23: 1669–1679. doi: 10.1016/j.quascirev.2004.01.005 |
| Xiao S, Li A, Liu J, et al, 2006. Coherence between solar activity and the East Asian winter monsoon variability in the past 8, 000 years from Yangtze River-derived mud in the East China Sea. Palaeogeography, Palaeoclimatology, Palaeoecology, 237: 293–304. doi: 10.1016/j.palaeo.2005.12.003 |
| Yancheva G, Nowaczyk NR, Mingram J, et al, 2007. Influence of the intertropical convergence zone on the East Asian monsoon. Nature, 445: 74–77. doi: 10.1038/nature05431 |
| Yu XF, Zhou WJ, Liu Z, et al, 2011. Different patterns of changes in the Asian summer and winter monsoons on the eastern Ti-betan Plateau during the Holocene. The Holocene, 21(7): 1031–1036. doi: 10.1177/0959683611400460 |
| Zhang EL, Wang YB, Sun WW, et al, 2016. Holocene Asian monsoon evolution revealed by a pollen record from an alpine lake on the southeastern margin of the Qinghai-Tibetan Plateau, China. Climate of the Past, 12: 415–427. doi: 10.5194/cp-12-415-2016 |
| Zhang JW, Chen FH, Holmes JA, et al, 2011. Holocene monsoon climate documented by oxygen and carbon isotopes from lake sediments and peat bogs in China:a review and synthesis. Quaternary Science Reviews, 30: 1973–1987. doi: 10.1016/j.quascirev.2011.04.023 |
| Zhang XJ, Jin LY, Li N, 2015. Asynchronous variation in the East Asian winter monsoon during the Holocene. Journal of Geo-physical Research:Atmospheres, 120: 5357–5370. doi: 10.1002/2014JD022585 |
| Zhao S, Xia DS, Jin HL, et al, 2016. Long-term weakening of the East Asian summer and winter monsoons during the mid-to late Holocene recorded by aeolian deposits at the eastern edge of the Mu Us Desert. Palaeogeography, Palaeoclimatology, Palaeoecology, 457: 258–268. doi: 10.1016/j.palaeo.2016.06.011 |
| Zhao Y, Yu ZC, 2012. Vegetation response to Holocene climate change in East Asian monsoon-margin region. Earth-Science Reviews, 113: 1–10. doi: 10.1016/j.earscirev.2012.03.001 |
| Zhao Y, Yu ZC, Chen FH, et al, 2010. Vegetation response to Holocene climate change in monsoon-influenced region of China. Earth-Science Reviews, 97: 242–256. doi: 10.1016/j.earscirev.2009.10.007 |
 2016, 8


