Article Information
- Ding Han Tian, Zheng Pu Hong, Cheng Peng, Qin Jiao Ke . 2016.
- Hydrological effects of alpine permafrost in the headwaters of the Urumqi River, Tianshan Mountains
- Sciences in Cold and Arid Regions, 8(3): 241-249
- http://dx.doi.org/10.3724/SP.J.1226.2016.00241
Article History
- Received: January 10, 2016
- Accepted: March 26, 2016
2. Urumqi Meteorological Bureau, Urumqi, Xinjiang 830002, China
Changes in the cryosphere are impacting the global climate system, and much of the current interest in high-latitude hydrology has been fueled by concerns about climate change. There is sufficient evidence that the ongoing global warming has exerted significant impact on hydrologic cycles including precipitation and its distribution, snow accumulation or thawing, evapotranspiration, and surface or underground runoff (IPCC, 2001). Climate warming and associated precipitation changes are expected to lead to decreased winter snow accumulation and earlier snowmelt in many, although not all, regions that currently have seasonal snow cover (Adam et al., 2009). In certain Arctic environments, lakes are believed to be sensitive to changes in climate, with some lakes disappearing slowly and others in areas with ice-rich permafrost becoming prone to rapid or catastrophic drainage (Marsh et al., 2009). Climate changes have led to changes in permafrost temperature and active layer thickness (Overduin and Kane, 2006), which has had profound change effects on the regional hydrologic processes and ecological environments. The main hydrologic processes in permafrost regions are infiltration, migration, and the phase change process of snowmelt water and rain into the active layer.
Previous analyses showed an asymptotic curve between winter streamflow and both the thickness of the active layer and the winter temperature in the Tianshan Mountains and the Qinghai-Tibet Plateau, China (Liu et al., 2003, 2005; Gong et al., 2006). They imply that winter streamflow increases with a thickening of the active layer and a decrease in the depth of seasonal frost penetration in winter. Other studies have shown that the interannual variability of the depth of the active layer will inevitably lead to a decline in groundwater levels, which will result in less water content in the active layer. This change affects not only the amount of runoff, but also (and mainly) the fragile ecological environments in permafrost regions (Yang et al., 2000). In addition, some studies have indicated that climate change and permafrost degradation can cause degradation of alpine meadows and a wide range of steppe vegetation, which in turn affects the status of water and heat in soil, and the change of hydrologic cycle in the active layer and permafrost will further accelerate the permafrost degradation (Wang et al., 2001, 2012).
Over the past two decades, based on records and observations of changes in glaciers, streamflows, meteorological parameters, and the permafrost active layer in the Urumqi River Basin, a significant increase in ice and snowmelt runoff has occurred. An increasing trend in precipitation has been significant since 1986(Wang et al., 2005) and, particularly after 1995, there have been increases in both air temperature and precipitation at the headwaters of the Urumqi River (Li et al., 2003). Correspondingly, the soil temperature of the permafrost at the depth of 30-60 cm has slowly increased, and the active layer is getting thicker (Jin et al., 1998). Based on the significant impact of climate change on hydrologic processes, we here analyze the response of changes of runoff to the changes of air temperature, precipitation, and other parameters at the high-mountain headwaters of the Urumqi River. This has great significance in improving our understanding of the impact of climate change on cold and arid regions runoff changes and the rational use of water resources.
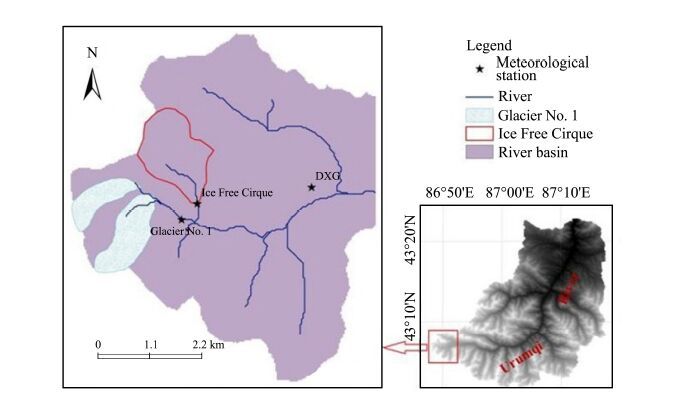
2 Study areaThe Ice-Free Cirque (43°04′N, 86°30′E; Figure 1), located at the headwaters of the Urumqi River in eastern Tianshan, is in close proximity to the Urumqi Glacier No. 1(43°05'N, 86°48'E). In order to study the hydrologic processes of runoff that are from precipitation, snow, and permafrost, a hydrological station (3, 805 m a.s.l.) was built at the outlet ofthe Ice-Free Cirque, whose catchment area is 1.68 km2. Precipitation and runoff from snow and permafrost have been observed there since 1982. In 2003 an observation system for temperature, humidity, precipitation, radiation, etc., was built. During 2003-2010, the thawing runoff, meteorological elements, soil water content, and water movement in the active layer of alpine mountain permafrost were monitored at the gauging station; these data were used to analyze the change characteristics of runoff from permafrost in the basin and the hydrological effects of the thawing-freezing process.
|
| Figure 1 Map showing the hydrologic stations at the source of the Urumqi River |
Temperature and precipitation data recorded during 1959-2010 are available at the Daxigou meteorological station (DXG)(elevation 3, 539 m a.s.l.), which is located 3 km downstream of the Urumqi Glacier No. 1. The Ice-Free Cirque hydrologic station has recorded the water level data during the snowmelt periods (May to September) from 1982 to 2010; the discharges were obtained by developing a stage-discharge relationship (rating curve) for each thawing season to convert water levels into discharges. The observations for discharge and air temperature were made every hour. The measurements for soil temperature, soil water content, and heat flux were started since August 2003 when an active layer monitoring system was established.
The linear regression analysis was carried out for the long-term observation data series, and the standard t-test was used to determine the statistical significance of the factors' changing trends. Furthermore, the relationships between temperature, precipitation, and runoff were analyzed to quantify the impact of climate change on the discharge variations.
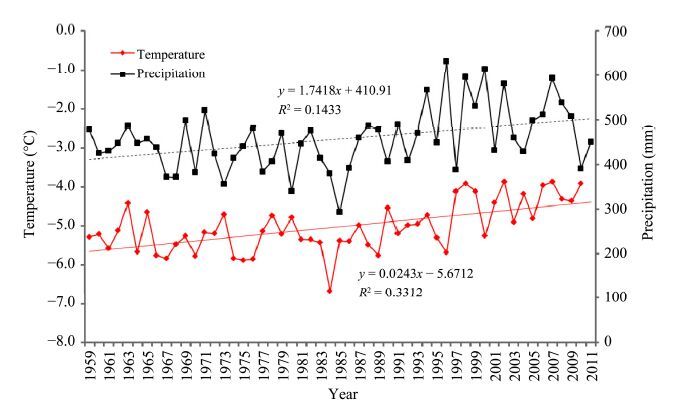
4 Results and analysis 4.1 Interannual variations of temperature, precipitation, runoff, and their correlationsThe local air temperature appears to show an overall increasing trend, especially during the period of 1997-2010(Figure 2). The annual average temperature has increased about 1.1 ℃ (averaged by 0.02 ℃/a) from 1959 to 2010. Compared with the mean air temperature of −5.3 ℃ in 1959-1996, the mean air temperature of −4.0 ℃ in 1997-2010 indicated an increase of 1.3 ℃.
|
| Figure 2 Variations of yearly air temperature and precipitation at the Daxigou meteorological station from 1959 to 2010 |
The precipitation was fairly constant during the period of 1959-1985, but increased rapidly from 1986 to 2010(Figure 2).
The runoff from the Ice-Free Cirque has been exhibiting a significantly increasing trend since the mid-1980s and especially since 1996, as it has been presenting a much higher level than the average value during the previous 10 years (Han et al., 2003).
Preliminary analysis showed that the significant increase of runoff was related to significantly increased precipitation and generally upward-trending temperature at the Ice-Free Cirque since the 1980s. The runoff and precipitation changes were significantly correlated; however, there was a relatively weak positive correlation between runoff and temperature (Figure 3). Because of air temperature rise, the active layer of permafrost in the headwaters of the Urumqi River has been getting thicker. During the study period, the maximum thickness of the active layer reached 1.60 m in 2007. This was an increase of 0.35 m compared with 1992(Zhao et al., 2010). The thawing of underground ice in the active layer has certainly contributed to runoff.

|
| Figure 3 Relationships between runoff and air temperature and precipitation in the Ice-Free Cirque |
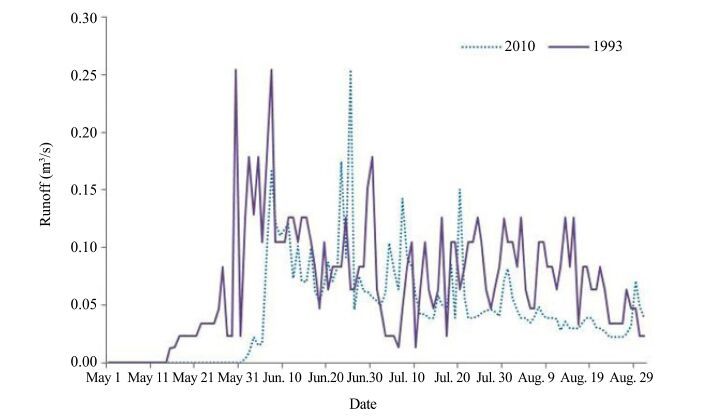
Moreover, related studies showed that the annual variation of precipitation during the period from May through June clearly increased in the high-mountain headwaters of the Urumqi River, and the onset of thawing and forming snowmelt runoff in spring were also obviously later than before (Han et al., 2004, 2010). The result of the duplicate effects was that the thawing flood peak just happened after the onset of snowmelt runoff. Whereas, the runoff in summer decreased significantly, implying that the maximum runoff peak occurred earlier than before in response to global warming (Shen et al., 2013). These change characteristics can be visualized by analyzing the monthly runoff variations in two typical years (Figure 4). The air temperature, precipitation, and runoff during the snowmelt season and in April (before snowmelt) in these two years are listed in Table 1. More than 90% of the precipitation in the headwaters of the Urumqi River occurs from April to September, and more than 95% of the whole annual runoff at the station occurred during the May-September observation period; for the rest of the year, the streamflows are mostly frozen. In early snowmelt season (May), runoff has a relatively close relation with air temperature; in the main snowmelt season, runoff is mainly from precipitation.
|
| Figure 4 Runoff changes in the Ice-Free Cirque hydrologic station at the source of the Urumqi River in 1993 and 2010 |
| Year | April | May | May-August | June-August | |||||||||||
| T(℃) | P(mm) | Q(m3/s) | T (℃) | P(mm) | Q (m3/s) | T(℃) | P(mm) | Q (m3/s) | T(℃) | P(mm) | Q (m3/s) | ||||
| 1993 | −5.4 | 81.0 | 0.000 | −2.4 | 68.3 | 0.024 | 2.0 | 401.8 | 0.069 | 4.4 | 333.3 | 0.100 | |||
| 2010 | −5.0 | 22.8 | 0.000 | −3.4 | 78.0 | 0.000 | 2.5 | 301.0 | 0.045 | 4.5 | 223.0 | 0.060 | |||
The runoff process has a close relationship with the hydrothermal conditions in permafrost active layer, and is mainly controlled by the thawing depth of permafrost in different seasons. In spring, the thawing depth of the active layer in permafrost is so shallow that melt water infiltrates very weakly (Kane et al., 1989). The water content in the top layer of permafrost is relatively larger because snowmelt water mainly contributes to evaporation of snow and top soil and some infiltration. Some of the melt water infiltrates into the seasonal active layer and is stopped by the frozen layer, forming suprapermafrost water. When the process is relatively stable, snowmelt water will supply rivers as type of shallow water.
Actually, the hydrologic process in permafrost has a close relationship with the surface snow depth before thawing season, and the snowmelt duration and intensity are also closely related to air temperature and soil temperature during the thawing period. The hydrologic processes in permafrost are also the comprehensive reflection of temperature and precipitation during the thawing period. In spring, day and night temperatures change so sharply that melt water in snow and the active layer refreezes in the nighttime, which keeps much melt water in the surface soil or fills depressions (Woo, 1983). This is also the reason why the melt runoff is scant in the early spring (Yang, 1988). In late spring and early summer (May to June), air temperature rises over 0 ℃, snow melts strongly and yield snowmelt peak runoff in spring, which is often larger than the precipitation peak runoff in summer (Figure 4) due to the waterproofing function of permafrost (Yang, 1981). In summer, river runoff is mainly from precipitation. With soil temperature rising, the active layer in permafrost gets thicker. Precipitation or meltwater infiltrates into the active layer and makes the underground water level rise, and then the redundant water can supply runoff. In fall, runoff is orderly affected by soil temperature, soil water content, and air temperature. When the temperature drops below 0 ℃, usually in September, the active layer is frozen until the next ablation period.
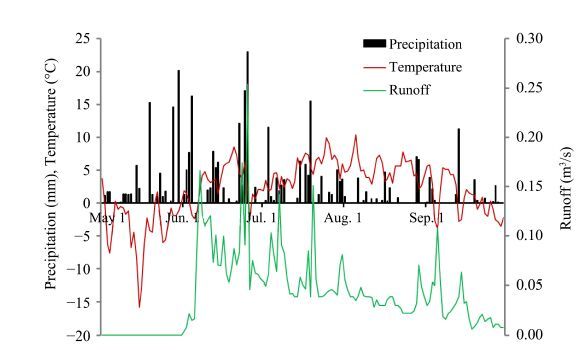
Our observation in 2010 has demonstrated these significant seasonal changes of runoff in permafrost (Figure 5). The snow accumulation in May reached about 108 mm. From May 31 to June 4, the air temperature was continuously higher than 0 ℃, and on June 7 the first snowmelt runoff peak occurred. From June 10 onward, precipitation continuously increased and air temperature rose sharply, which led to a larger mixed peak runoff on June 25. The supply for runoff was from permafrost thawing and surface snow melting. In the beginning of runoff forming, the runoff process was influenced by the soil temperature at the 10 cm depth; in spring, runoff was mainly correlated with the soil water content of the 10-20 cm deep active layer, and the runoff production was delayed by three to four days; in summer, the runoff process was mainly controlled by the soil water content in the active layer more than 60 cm. Besides, during the spring floods period, what played a leading role in runoff was soil water content and temperature in the active layer shallower than 65 cm (Li et al., 2009).
|
| Figure 5 Hydrometeorological data on May 1 to September 30, 2010 for daily precipitation (P), air temperature (T), and runoff (Q) at the Ice-Free Cirque hydrologic station |
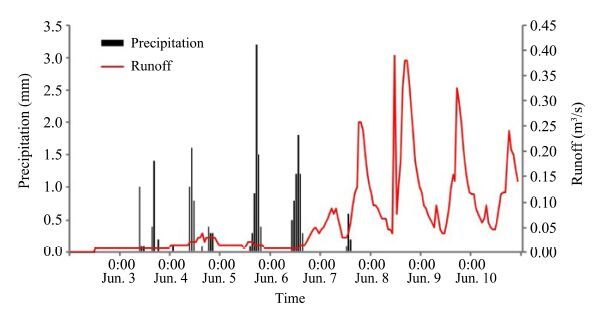
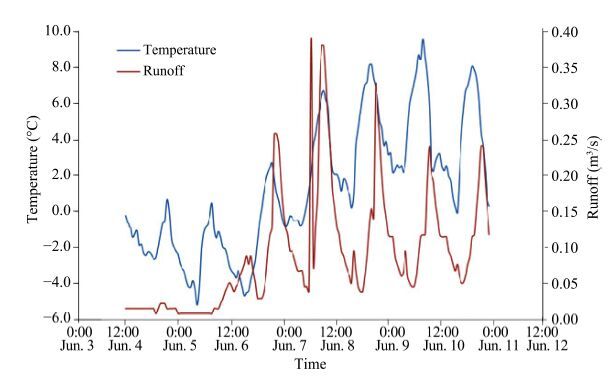
At the beginning of spring, runoff flow generation and concentration are mainly controlled by the snow accumulation in previous days, which melt and form runoff along with temperature gradually rising (Figure 6). From May 28 to June 4 in 2010, when the air temperature fluctuated at 0 ℃, weak runoff only appeared at about 13:00. When the daily air temperature rose and stayed above 0 ℃, continuous runoff appeared. It began on June 6 in 2010. The correlation between runoff and air temperature from June 4 to June 11 in 2010 in the Ice-Free Cirque was similar to that in the Glacier No. 1 on clear weather days (Han et al., 2010), but the time-lag of runoff behind air temperature was more 4 hours later than that in Glacier No. 1. The maximum runoff often appeared at about 20:00 in the Ice-Free Cirque (Figure 7). This could be attributed to the delaying characteristics of the runoff from the freeze-thaw process in the permafrost active layer. There was a correlation between the runoff (Q) and the air temperature four hours ago (t−4):
|
| Figure 6 The relationship between runoff and precipitation from June 4 to June 11, 2010 |
|
| Figure 7 The relationship between runoff and temperature from June 4 to June 11, 2010 |
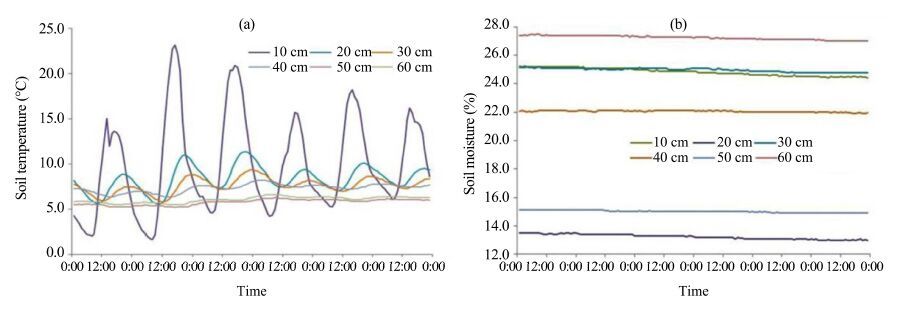
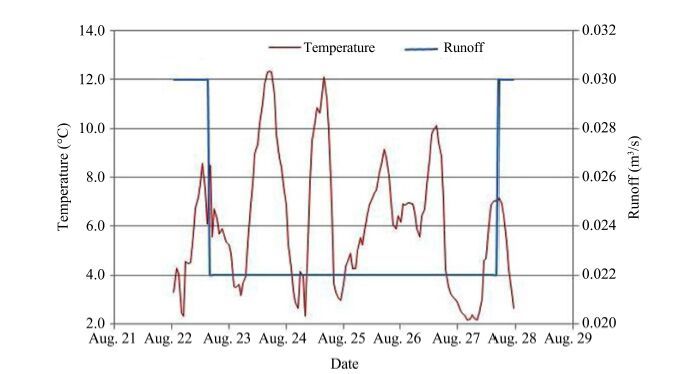
During the strong thawing stage in summer (from August 22 to August 27), when the average daily maximum air temperature occurred at about 14:00, the runoff process had no obvious diurnal variation and also had hardly any correlation with daily air temperature variation (Figures 8, 9). The runoff change characteristics reflected the water and heat changes in the active layer.
|
| Figure 8 Daily variations of soil temperature (a) and soil water content (b) in active layer in clear weather days |
From the ground surface to the 60 cm depth, the daily soil temperature changes from fluctuant to relatively even, and the changing phase was delayed downwards (Figure 8a). Reaching at the 30 cm depth, the maximum soil temperature happened with a delay to the next day when compared with the air temperature, and the temperature variation amplitude of the deeper soil was small due to the weak impact of the atmosphere.
The soil water content in the active layer generally increased with the increase of active layer depth, and the minimum water content (about 13%) was at the 20 cm deep active layer, the maximum water content (about 27%) was at the 60 cm deep active layer (Figure 8b). The diurnal variations of soil water content at different depths in the active layer all were relatively stable, which reflected the commonly stable features of the active layer in permafrost during no precipitation period, and had some relation with the permafrost profile property. With the time coursing of soil surface evaporation and transpiration, this stable soil water status would be disturbed, further bringing about the destruction of permafrost and the degradation of grassland.
|
| Figure 9 Curves of temperature and runoff for a sunshine period in the Ice-Free Cirque at the source of the Urumqi River |
In the alpine region of the Urumqi River, summer precipitation consists of rainfall and snow. Runoff processes are often the result of precipitation infiltration; when soil become saturated, runoffgenerating.
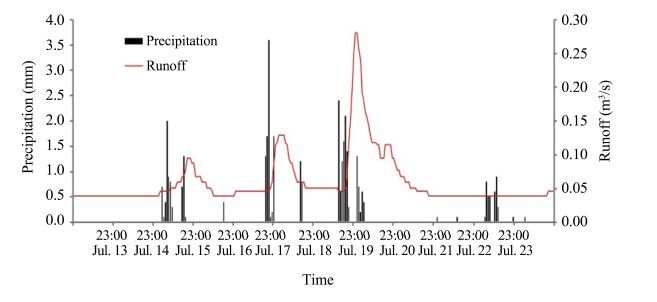
Figure 10 shows the runoff process during a precipitation event. The precipitation started on July 12, 2010, and the soil became wetted in the process. The ensuing concentrated precipitation that happened from 16:00 on July 14 to 16:00 on July 15 had resulted in the first runoff peak. Along with the snow melting from three concentrated precipitation stages, the maximum runoff (0.28 m3/s) appeared at near 1:00 on July 20.
|
| Figure 10 The processes of runoff and precipitation during a precipitation event (July 13 to July 24, 2010) |
The variations of soil hydrothermal regime in the runoff process during a precipitation event are considerably different from those on clear weather days (Figure 11). The amplitude of soil temperature variation gradually decreased from the surface to the depth of 60 cm. On July 14, the air temperature dropped sharply when the weather was snowfall; snowfall stopped on July 15. Correspondingly, the soil temperature decreased first then rose quickly again after July 15, with some time lag against the air temperature change phase. This phenomenon was especially noticeable in the 10-20 cm active layers (Figure 11a).

|
| Figure 11 Daily variations of soil temperature (a) and soil water content (b) in active layer during a precipitation event |
The soil water change in the active layers from 0 to 60 cm during the precipitation event was similar to that on clear weather days. The soil water content in the active layer generally increased from the surface to deeper soil. The maximum water content (about 29%) was relatively constant and appeared at the 60 cm depth in the active layer, and the minimum water content (about 15%) was at the depth of 20 cm (Figure 11b). For temporal variation, the soil water content in each active layer, except for the 60 cm depth, changed markedly. The soil water content rose sharply one day after the precipitation, but only some hours later, it became steadywith snowmelt forming ground runoff (Figure 11b).
5 Conclusions1) Runoff on the alpine permafrost in the Ice-Free Cirque at the headwaters of the Urumqi River changed significantly from the mid-1980s to the early 1990s. The runoff change has a statistically significantly positive correlation with the temperature and precipitation. During the months from May to October, the ice in the active layer and even the fossil ice in earth thaw deeply, resulting in remarkably increased runoff.
2) The onset of runoff is three to five days later than the beginning of thawing of 10-20 cm soil in permafrost. In the early runoff process, runoff has close relation with the soil hydrothermal regime of the surface layer less than 10 cm depth. In summer, it has close relation with the soil hydrothermal regime at the layer deeper than 60 cm, and precipitation was the majorrechargesource to rivers.
3) In response to global warming, the maximum runoff peak in a year occurs earlier than before, and the onset of the winter-spring snowmelt runoff is clearly later than before, which are assumed as that the summer runoff decreases remarkably and the spring snow melt flood happens just after the onset of runoff.
This study only involves issues on runoff process of alpine permafrost under global warming background and problems on how much water from the melting of permafrost are contributed to runoff need further studying.
Acknowledge:This work is supported by the Natural Science Foundation of China (Nos. 41271035 and 41201060), Chinese Academy of Sciences and the National Scientific and Technological Support Projects (KJZD-EW-G03-04; 2013BAB05B03). The authors thank all those colleagues who worked on hydrological and glacial observations at the Tianshan Glacier Station during 1958-2010, and thank the anonymous reviewers for their helpful comments.
| Adam JC, Hamlet AF, Lettenmaier DP, 2009. Implications of global climate change for snowmelt hydrology in the twenty-first century. Hydrological Processes, 23(7): 962–972. doi: 10.1002/hyp.7201 |
| Gong TL, Liu CM, Liu JS, 2006. Hydrological response of Lhasa River to climate change and permafrost degradation in Xizang. Acta Geographica Sinica, 61(5): 519. |
| Han TD, Gao MJ, Ye BS, et al, 2010. Characteristic of runoff process of the glacier and permafrost in the headwaters of Urumqi River. Journal of Glaciology and Geocryology, 32(3): 573–579. |
| Han TD, Li ZQ, Ye BS, 2003. Increasing in runoff in the Ice-free Cirque at the headwaters of the Urumqi River. Journal of Glaciology and Geocryology, 25(4): 389. |
| Han TD, Ye BS, Ding YJ, et al, 2004. Precipitation variations in the southern and northern slopes of Mt. Tianger in the Tianshan Mountains. Journal of Glaciology and Geocryology, 26(6): 761–766. |
| IPCC.2001. Third Assessment Report - Climate Change: Summary to Policymakers. London: University of Cambridge. |
| Jin HJ, Liu ZX, Sone T, 1998. Permafrost temperature in the ice pass at the source of the Urumqi River, Tianshan Mountains. Journal of Glaciology and Geocryology, 20(1): 25. |
| Kane DL, Hinzman LD, Benson CS, et al, 1989. Hydrology of Imnavait Creek, an arctic watershed. IPCC.2001. Third Assessment Report - Climate Change: Summary to Policymakers. London: University of Cambridge., 12(3): 262–269. doi: 10.1111/j.1600-0587.1989.tb00845.x |
| Li TB, Wang GX, Hu HC, et al, 2009. Hydrological process in a typical small permafrost watershed at the headwaters of Yangtze River. Journal of Glaciology and Geocryology, 31(1): 82–88. |
| Li ZQ, Han TD, Jing ZF, et al, 2003. A summary of 40-year observed variation facts of climate and Glacier No. 1 at the Headwater of Urumqi River Tianshan, China. Journal of Glaciology and Geocryology, 25(2): 117–123. |
| Liu JS, Hayakawa N, Lu MJ, et al, 2003. Winter streamflow, ground temperature and active-layer thickness in northeast China. Permafrost Periglacial Process, 14(1): 11–18. doi: 10.1002/ppp.436 |
| Liu JS, Wei WS, Huang YY, et al, 2005. Hydrological response of winter streamflow to climate change and permafrost degradation in Manas watershed, Tianshan Mountains. Journal of Glaciology and Geocryology, 28(5): 656–662. |
| Marsh P, Russell M, Pohl S, et al, 2009. Changes in thaw lake drainage in the western Canadian Arctic from 1950 to 2000. Hydrological Processes, 23(1): 145–158. doi: 10.1002/hyp.7179 |
| Overduin PP, Kane DL, 2006. Frost boils and soil ice content: field observations. Permafrost and Periglacial Processes, 17(4): 291–307. doi: 10.1002/ppp.567 |
| Shen YP, Su HC, Wang GY, et al, 2013. The responses of glaciers and snow cover to climate change in Xinjiang (I): Hydrological effect. Journal of Glaciology and Geocryology, 35(3): 513–527. doi: 10.7522/j.issn.1000-0240.2013.0061 |
| Wang GX, Li Q, Cheng GD, et al, 2001. Climate change and its impact on eco-environment in the source regions of the Yangtze River and Yellow River in recent 40 years. Journal of Glaciology and Geocryology, 23(4): 346–352. |
| Wang GX, Liu GS, Li CJ, 2012. Effects of changes in alpine grassland vegetation cover on hillslope hydrological processes in a permafrost watershed. Journal of Hydrology,: 444–445. doi: 10.1016/j.jhydrol.2012.03.033 |
| Wang GY, Shen YP, Mao WY, 2005. Climate warming at headwater of Urumqi river, Xinjiang in past 44 years and its impact on glacier shrinking. Journal of Glaciology and Geocryology, 27(6): 813–819. |
| Woo MK, 1983. Hydrology of a drainage basin in the Canadian high Arctic. Annals of the Association of American Geographers, 73(4): 577–596. doi: 10.1111/j.1467-8306.1983.tb01860.x |
| Yang ZN, Liu XR, Zeng QZ, et al, 2000. Hydrology in Cold Regions of China. Beijing: Science Press. |
| Yang ZN, 1981. Basic characteristic of runoff in contemporary glaciated area of China. Science in China, 4: 467–476. |
| Yang ZN, 1988. General situation of research on hydrology of glaciers in China in the last thirty years. Journal of Glaciology and Geocryology, 10(3): 256–261. |
| Zhao L, Liu GY, Jiao KQ, et al, 2010. Variation of the permafrost in the headwaters of the Urumqi River in Tianshan mountains since 1991. Journal of Glaciology and Geocryology, 32(2): 223–230. |
 2016, 8

