Article Information
- Bo Xie Sheng, Jun Qu Jian, Wang Tao . 2016.
- Wind tunnel simulation of the effects of freeze–thaw cycles on soil erosion in the Qinghai–Tibet Plateau
- Sciences in Cold and Arid Regions, 8(3): 187-195
- http://dx.doi.org/10.3724/SP.J.1226.2016.00187.
Article History
- Received: February 22, 2016
- Accepted: May 03, 2016
Freeze-thaw erosion refers to the whole process of volume change and expansion-shrinkage difference of different minerals in soil or rock, including the rock body, mechanical destruction and material transport under gravity of the soil body or rock, as well as the migration and deposition processes in the alpine frost region because of temperature variations (Zhang et al., 2007). Freeze-thaw erosion mostly occurs in cold regions at high latitude and altitude. Freeze-thaw erosion is China's third major type of soil erosion after wind and water erosion. The second National Soil Erosion Remote Sensing Survey and Statistical Data indicate that 1.27×10⁶ km2 of freeze-thaw erosion land in China account for 35.6% of the country's total soil erosion area, or approximately 13.36% of the total land area in China. This type of erosion mainly occurs in northeastern China, the mountainous region of northwestern China, and the Qinghai-Tibet Plateau region (Wang et al., 2008). Soil erosion in the Qinghai-Tibet Plateau is dominated by freeze-thaw erosion, which occurs in the alpine frost zone at an average elevation exceeding 4, 000 m (Dong et al., 2000). The plateau has the most concentrated distribution and most severe freeze-thaw erosion in China, which covers an area of 1.04×10⁶ km2, accounting for 82% of China's total freeze-thaw erosion area. Eroded product from the Qinghai-Tibet Plateau is one of the main sediment sources of the Yangtze, Yellow, and Lancang rivers (Fan and Cai, 2003). Freeze-thaw erosion is a major eco-environmental problem facing the Qinghai-Tibet Plateau (Dong et al., 2000).
Freeze-thaw and wind erosion, which is an expression of freeze-thaw erosion, refers to a type of wind erosion resulting from the destruction of soil microstructure under freeze-thaw action. Owing to its high altitude, a large part of the Qinghai-Tibet Plateau has an alpine, cold, arid, and semiarid climate, and average air temperature is low. The daily and annual amplitudes of temperature in the plateau is large, and the number of days with alternately occurring positive and negative air temperatures varies between 150 and 230 d/a. All these conditions result in the plateau's prolonged freeze-thaw alternation (Yang et al., 2007). Frequent freeze-thaw actions destroy the soil structure and produce loose and clastic materials, thus providing abundant sand materials for wind erosion. Furthermore, the plateau has sparse vegetation on the ground surface (Li et al., 2005), dry climate, frequent strong winds, and simultaneous occurrence of dry and windy seasons. Therefore, freeze-thaw erosion mainly takes the form of freeze-thaw and wind erosion on the Qinghai-Tibet Plateau. Recent studies regarding the soil freeze-thaw in Qinghai-Tibet Plateau were conducted by Wang et al. (2007) and Xie et al. (2015) , but only a few studies involved the freeze-thaw and wind erosion in the plateau. The current research was conducted to elaborate the effects of daily and seasonal freeze-thaw on wind erosion and its relationship with the intensity of wind-sand activities on the ground surface of the Qinghai-Tibet Plateau. This research not only has theoretical significance for exploring the formation mechanism of freeze-thaw and wind erosion in the Qinghai-Tibet Plateau, but also provides a scientific basis for freeze-thaw desertification control in the plateau.
2 Experimental designThe experiments were carried out in Dunhuang Gobi and Desert Research Station, Key Laboratory of Desert and Desertification, Chinese Academy of Sciences (CAS). The wind erosion experiment was completed in a direct current closed blowing wind tunnel, which has a test section 10 m in length and a 0.6m×0.6m cross section. In the tunnel, experiment wind velocity could be continuously adjusted within the range of 0-20 m/s. Soil samples with a dry density of 1.8 g/cm3 were collected for the experiments on freeze-thaw cycles from the primitive surface of Honglianghe of the Qinghai-Tibet Plateau. The morphology and composition of particles are presented in Figures 1 and 2, respectively. The soil sample was sieved through a 2 mm square-hole sieve and made into 4cm×4cm×4cm test blocks. Distilled water was slowly and uniformly added dropwise to the test blocks to reach the water content of 0%, 3%, 6%, 9%, and 12%, respectively. To ensure uniformity and stability of water during the freezing-thawing process, the soil blocks were sealed using double-layer plastic foil and a self-seal bag and left to stand overnight. The blocks were then used to simulate the freeze-thaw processes of the plateau's surface in the freeze-thaw circulation experiment box. In a circulation period of 24 hours, both the freezing and thawing durations were 12 hours, and the numbers of freeze-thaw cycles were 0, 1, 3, 6, 9, 12, and 15, respectively. Freeze-thaw temperature differences were divided into three groups: −10 ℃ to 10 ℃, −25 ℃ to 15 ℃, and −40 ℃ to 20 ℃. During the freeze-thaw processes, water damaged the test blocks and evaporation took place in the wind erosion processes. Thus, the test blocks were oven-dried at 110 ℃ for 12 hours after the freeze-thaw circulation and prior to the wind erosion experiments to eliminate the wind erosion experiment error caused by water evaporation. The oven-dried test blocks were placed in a wind tunnel to conduct wind erosion experiments under the conditions of clean wind and sand-bearing wind (The oven-dried test blocks were placed in a wind tunnel for the wind erosion experiments under two conditions. One experiment had sand transported from upwind of the experimental blocks and in the other set of experiments no sand came from upwind. The clean wind refer to the latter, the sand-bearing wind refer to the former). The experimental wind velocities were set at 6, 8, 10, 12, and 14 m/s (wind velocity at the entrance center of the wind tunnel's test section, 30 cm height). After finishing the wind erosion experiment, the wind erosion rates were calculated in accordance with the erosion area, erosion duration, and mass loss of the tested soil blocks. The calculation formula is as follows:
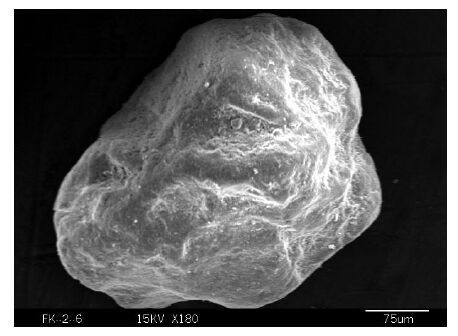
|
| Figure 1 Particle morphology of the tested soil sample (photo scanned by electron microscope) |
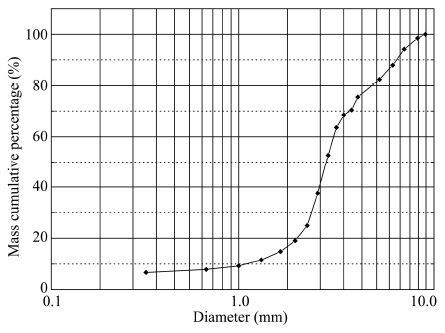
|
| Figure 2 Particle morphology of the experimental sand (photo scanned by electron microscope) |
where E is the wind erosion rate (kg/ (m2·h)), m1 is the mass before wind erosion (g), m2 is the mass after wind erosion (g), s is the eroded area of the tested block (m2), and t is the eroded duration of the tested block (h).
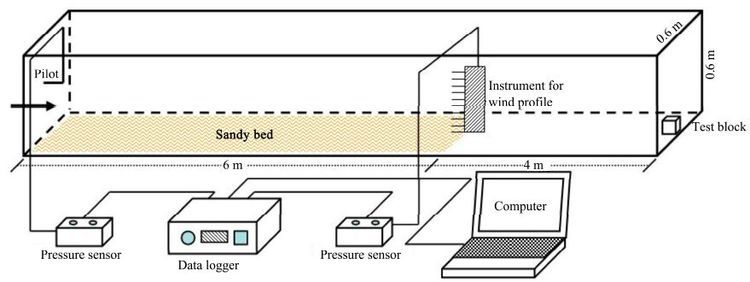
The experimental sand for wind erosion was collected from the primitive surface sand of Honglianghe of the Qinghai-Tibet Plateau, the morphology and composition of particles of the sand are respectively presented in Figures 3 and 4. To ensure the stability of axial velocity of wind-sand flow in the wind tunnel, the length of the sand bed at the entrance of test section was laid up to 6 m, and the sand bed thickness was 5 cm. The tested block bearing the wind erosion was located at the end center of the wind tunnel's test section, and the nearest distance from the surface of the sand bed was 4 m. Figure 5 illustrates the layout of wind erosion experiment in the wind tunnel.
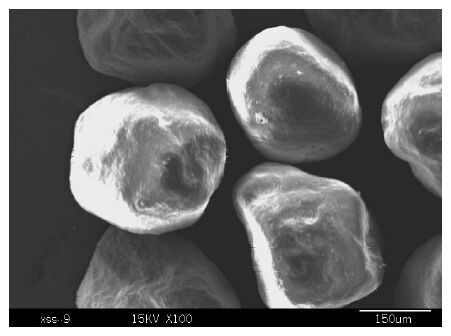
|
| Figure 3 Particle morphology of the experimental sand (photo scanned by electron microscope) |
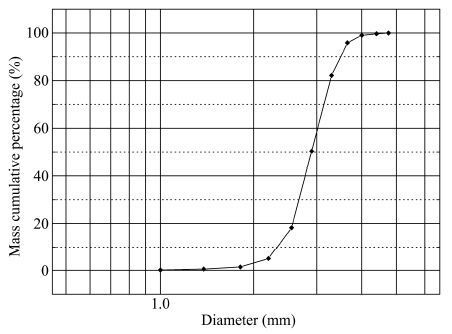
|
| Figure 4 Grain size distribution curve of the experimental sand |
|
| Figure 5 Schematic diagram of the wind erosion experiment in a wind tunnel |
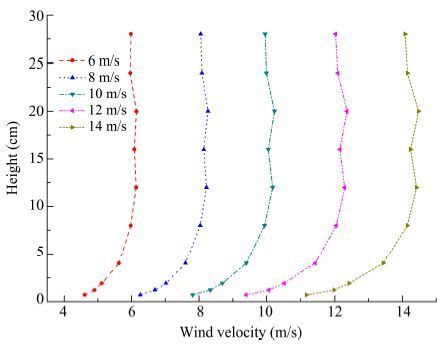
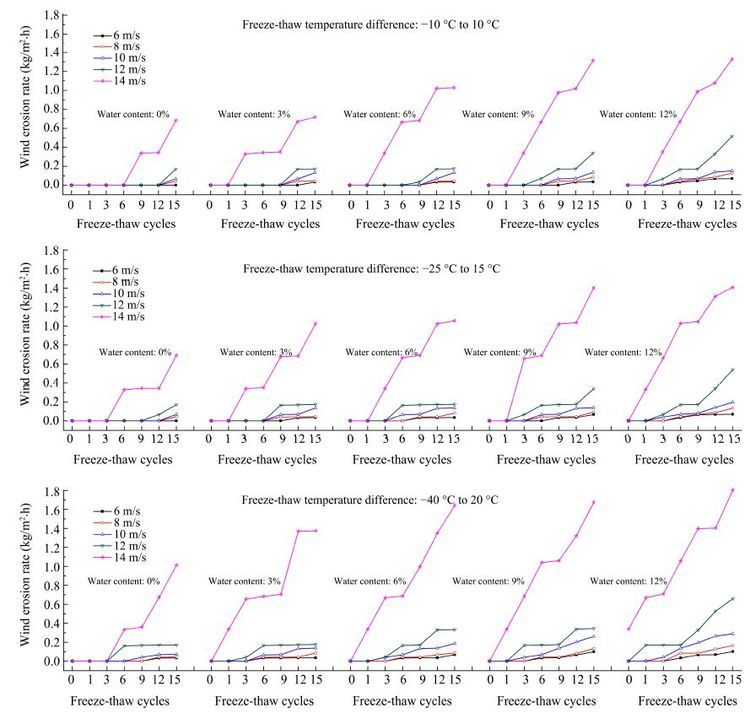
Under clean wind conditions (Figure 6), no wind erosion occurred on the test blocks that did not experience freeze-thaw cycles under all the preset experimental wind velocities, whereas the test blocks that experienced a few freeze-thaw cycles and had low water content showed almost no wind erosion under low experiment wind velocity. Only when the number of freeze-thaw cycles increased did water content and experiment wind velocity also increase and wind erosion gradually took place. When the number of freeze-thaw cycles reached 15, water content was 12%, and experiment wind velocity was 14 m/s, the corresponding maximum wind erosion rates were 1.33, 1.41, and 1.81 kg/ (m2·h)under the three sets of freeze-thaw temperature difference conditions (Figure 7).
|
| Figure 6 Wind profile under clean wind condition |
|
| Figure 7 Wind erosion strength of the test blocks under clean wind condition |
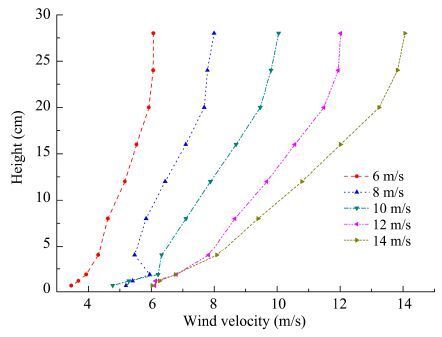
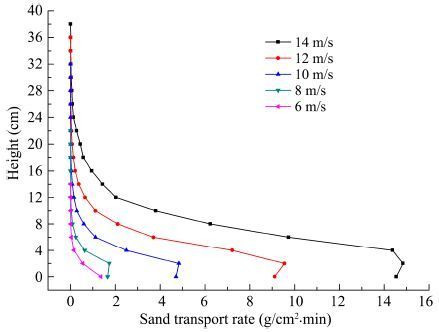
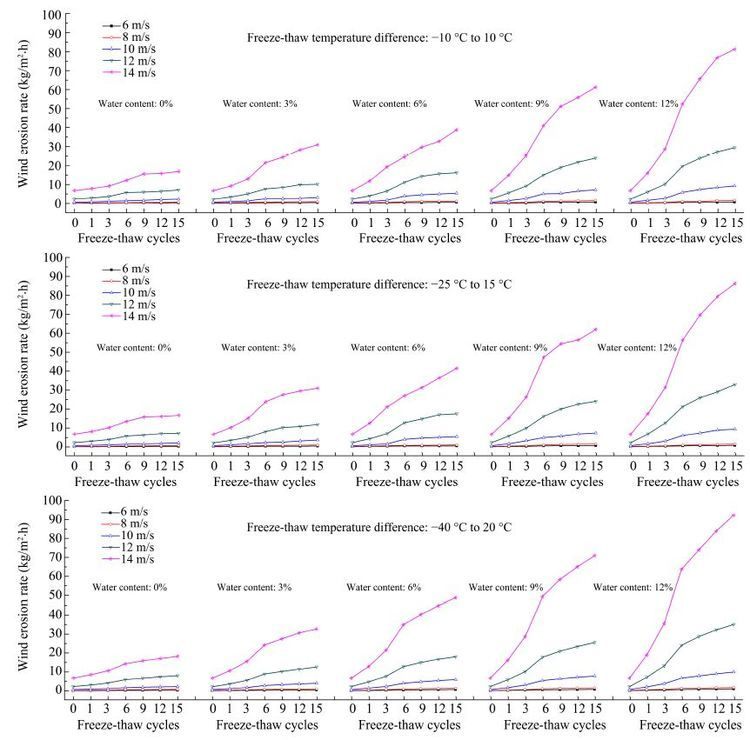
Figure 8 shows the sand-bearing wind profile, and its corresponding profile of wind-sand flow intensity is showed by Figure 9. Figure 10 shows the experiment results of wind erosion in the wind tunnel. Under the same three sets of freeze-thaw temperature difference conditions as in Figure 7, the wind erosion severity of the test block eroded by sand-bearing wind was far larger than that by clean wind. For example, when water content was 12%, the freeze-thaw temperature difference was −40 ℃ to 20 ℃, the number of freeze-thaw cycles reached 15, and experiment wind velocity was 14 m/s, the wind erosion rate of the test block under the clean wind condition was 1.81 kg/ (m2·h), but the wind erosion rate of the test block eroded by sand-bearing wind was 92.25 kg/ (m2·h), which was 50 times higher than that by clean wind. Under the five sets of experimental wind velocities, the wind erosion rates of the tested soil blocks that did not experience freeze-thaw cycles and had 0 water content, were 0.14, 0.23, 0.68, 2.36, and 6.76 kg/ (m2·h), respectively. When the test block experienced a few freeze-thaw cycles, it had low water content and low experiment wind velocity, and the wind erosion rates under three sets of temperature difference were very small. For example, for the test block that experienced one freeze-thaw cycle, with 3% water content, a freeze-thaw temperature difference of −10 ℃ to 10 ℃, and experiment wind velocity of 6 m/s, the wind erosion rate was 0.20 kg/ (m2·h). Wind erosion strength significantly increased with the increasing number of freeze-thaw cycles, water content, freeze-thaw temperature difference, and experiment wind velocity. When the number of freeze-thaw cycles reached 15, water content was 12%, freeze-thaw temperature difference was −40 ℃ to 20 ℃, and experiment wind velocity was 14 m/s, the wind erosion rate of the test block was up to 92.25 kg/ (m2·h).
|
| Figure 8 Wind velocity profile under sand-bearing wind condition |
|
| Figure 9 wind-sand flow intensity profile under sand-bearing wind condition |
When the water content, freeze-thaw temperature difference, and experiment wind velocity were the same, the wind erosion strength increased with increasing number of freeze-thaw cycles (Figure 10). The approximate piecewise point was six times; when the number of freeze-thaw cycles was ≤6, wind erosion strength increased rapidly, and when the number of freeze-thaw cycles was >6, the increase in wind erosion strength tended to slow down. For example, when water content was 12%, freeze-thaw temperature difference was −25 ℃ to 15 ℃, and experiment wind velocity was 14 m/s, the wind erosion rates of the test blocks were 6.69, 17.60, 31.58, 56.44, 69.71, 79.42, and 86.20 kg/ (m2·h)after they experienced 0, 1, 3, 6, 9, 12, and 15 freeze-thaw cycles, respectively.
|
| Figure 10 Wind erosion strength of the test blocks under the sand-bearing wind condition |
When the number of freeze-thaw cycles, freeze-thaw temperature difference, and experiment wind velocity were the same, the wind erosion strength increased with increasing water content of the freeze-thaw processes (Figure 10). For example, when the freeze-thaw temperature difference was −25 ℃ to 15 ℃, the number of freeze-thaw cycles reached 15, and experiment wind velocity was 14 m/s, under the water contents of 0%, 3%, 6%, 9%, and 12%, the wind erosion rates of the test blocks were 16.68, 30.97, 41.50, 62.01, and 86.20 kg/ (m2·h), respectively.
3.4 Effects of freeze-thaw temperature difference on wind erosion strengthWhen the number of freeze-thaw cycles, water content, and experiment wind velocity were the same, the wind erosion strength tended to increase with increasing freeze-thaw temperature difference (Figure 10). For example, when the number of freeze-thaw cycles reached 15, water content was 12%, and experiment wind velocity was 14 m/s, the wind erosion rates of the test blocks under the freeze-thaw temperature difference of −10 ℃ to 10 ℃, −25 ℃ to 15 ℃, and −40 ℃ to 20 ℃ were 81.23, 86.20, and 92.25 kg/ (m2·h), respectively.
4 Analyses and discussions1) The test blocks in the clean wind were only affected by the wind shear force, and the magnitude of the acting force was only related to wind velocity and air density. In contrast, in the sand-bearing wind, the test block surface was affected by both the wind shear force and abrasion of moving sand particles, and the magnitude of the acting force not only depended on the impact velocity of sand particles (about 1/10 or less of the wind velocity)but also on sand density. Sand and air densities differed dramatically. Under the standard condition, air density δ was 1.25 mg/cm3, whereas sand density δ' was 2.65 g/cm3; the density of these two materials differed by 2, 000 times or more. In addition, the test blocks in the sand-bearing wind were affected by the two phase flows of gas and solid, and the capacity of airflow to carry sand increases with increasing wind velocity. The sand source on the upwind side was abundant and the wind velocity exceeded the sand-moving wind. Hence, wind erosion took place and the wind erosion rate increased rapidly with the increasing sand-carrying ability of airflow. Meanwhile, sand particles also experienced a huge rotation velocity of 1, 000-2, 000 r/s in the saltation and creep processes, which produced strong abrasion on the surface of the test block and formed cracks (Dong et al., 1987). The cracks suffered from the dredging and erosion of sand particles in the wind-sand flow and resulted in an increased wind erosion rate. Hence, the wind erosion caused by sand-bearing wind was stronger than that by clean wind.
2) After the test blocks repeatedly experienced freeze-thaw cycles, some physical and mechanical properties, such as cohesion, porosity, and strength of soils, varied (Formanek et al., 1984; Sharratt et al., 2000; Williams and Robinson, 2001; Kurylyk and Watanabe, 2013); the original connection between soil particles was destroyed; and cementation force decreased, all of which resulted in a loose soil structure, and weakened resistance to wind erosion of the test block. The destruction of the soil internal structure by freeze-thaw action was most severe particularly in the first several freeze-thaw cycles, rapidly increasing the wind erosion rate of the test block. However, when the number of freeze-thaw cycles exceeded six, simultaneous to the destruction of the structure between soil particles, the freeze-thaw actions also caused the soil particles to rearrange and develop a new stability (Konrad, 1989). Such effects tended to slow down the increase of wind erosion strength after the test block experienced six freeze-thaw cycles. The weakening of the physical and mechanical properties of the test blocks caused by the freeze-thaw action was the main reason for the decrease in resistance to wind erosion.
3) The water in freezing and thawing processes can destroy the soil body. This destruction is caused by the action of water migration, and the dynamical force of such migration is the temperature gradient caused by the positive and negative variations of air temperature (Wang et al., 2007). Owing to the frequent positive and negative variations of temperature, soil water undergoes repeated freezing and thawing, and soil particles continuously experience thermal expansion and cool shrinkage. When the temperature is below the freezing temperature of soil water, part of the water is frozen and expands, exerting a large pressure on the pore walls in soils, thereby enlarging pore volume between soil particles. As soil water content increases, frost heaving exacerbates, and the enlarged pore volume cannot be entirely recovered after the ice is melted. Based on the above effects, the soil structure is destroyed and becomes loose, both of which affect soil erodibility and exacerbate wind erosion (Edwin and Anthony, 1979; Mostaghimi et al., 1988; Kok and McCool, 1990; Wang et al., 2014). In this study, the particle-size composition of the tested soil samples was uniform (Figure 1)and their thermal properties had no significant difference. Thus, in the freeze-thaw processes, the test blocks mainly exhibited bulk expansion and shrinkage, and the damaged form of the test blocks was dominated by cracks and blocky structure. Therefore, the combined effects of temperature and water aggravated the wind erosion severity of the test blocks.
4) Freeze-thaw processes are dynamic developmental processes from the instable state to a new balance state of the soil body. Owing to the frequent positive and negative air temperature variations in the Qinghai-Tibet Plateau, water in the soils repeatedly freezes and thaws, a process that destroys soil interparticle structure and alters the arrangement of soil particles. These outcomes, in turn, alter the physical mechanical property of the soil body and cause it to develop toward a new dynamical balance state (Lee et al., 1995). As derived from the experiment results, after freezing and thawing, the variation trend of wind erosion strength of the test blocks and the variation trend of physical and mechanical properties of the test samples, such as strength, cohesion, porosity, bulk density, and frost heaving amount, in freeze-thaw processes have good consistency (Wang et al., 2007; Güllü and Khüdir, 2014; Kurylyk et al., 2014; Xie et al., 2015). This finding indicates that the effects of freeze-thaw on wind erosion in the Qinghai-Tibet Plateau are mainly manifested through altering the physical and mechanical properties of the soil. With regard to performance in the freezing-thawing process, the phase variation of water caused volume expansion and contraction, destroyed the structure between soil particles, which then affected soil erodibility. Such a destructive effect increased the material sources of wind erosion and aggravated the wind erosi on strength of soil.
Overall, under clean wind conditions, the wind erosion strength of the test block was small, whereas under the conditions of sand-bearing wind, when experiment wind velocity, number of freeze-thaw cycles, and water content were compared, the effect of freeze-thaw temperature difference on wind erosion strength was much smaller. In addition, the wind erosion strength of the test block was mainly affected by the experiment wind velocity, number of freeze-thaw cycles, and water content. Therefore, considering the influence of the above three factors, according to the experimental results of this freeze-thaw process and wind erosion, and by using the computer for fitting, the approximate formula of wind erosion strength of sand-bearing wind under the influence of the three factors can be obtained.
In Function (2) , E is the wind erosion rate (kg/ (m2·h)), v is the experiment wind velocity (m/s), n is the number of freeze-thaw cycles (times), w is the water content in the processes of freezing and thawing (%), and P, a, b, c, are the parameters. P1 and P2 can be calculated by:
where,
where,
The wind erosion severity of the test block eroded by sand-bearing wind was far larger than that by clean wind in the Qinghai-Tibet Plateau, wind erosion strength increases along with the increase in the number of freeze-thaw cycles, water content in the freezing-thawing process, and the difference in freeze-thaw temperature.
The freeze-thaw and wind erosion strength of Qinghai-Tibet Plateau were significantly affected by factors such as wind velocity, type of wind, number of freeze-thaw cycles, freeze-thaw temperature difference, and water content of the freeze-thaw processes. In the conditions of water participation, the soil structure damaged by the repeated, fierce freeze-thaw actions is the main reason for the freeze-thaw and wind erosion in the Qinghai-Tibet Plateau. Furthermore, sand-bearing wind is the main driving force to this process.
Acknowledgments:This research project was funded by the National Natural Science Foundation of China (Grant No. 41401611) , the China Postdoctoral Science Foundation (Grant Nos. 2014M560817 and 2015T81069) , one of Special Fund for Forest Scientific Research in the Public Welfare (201504401) , the Science and Technology Program of Gansu Province (Grant No. 145RJZA118) .
| Dong GR, Li CZ, Jin J, et al, 1987. Some results of the wind tunnel simulation experiment of soil erosion. Chinese Science Bulletin, 32(4): 297–301. |
| Dong RK, Xu ZY, Yang CY, 2000. Dynamic and characteristic of freezing-thawing erosion on Qinghai-Tibet Plateau. Journal of Soil and Water Conservation, 14(4): 12–16. doi: 10.13870/j.cnki.stbcxb.2000.04.003 |
| Edwin JC, Anthony JG, 1979. Effect of freezing and thawing on permeability and structure of soils. Engineering Geology, 13(1-4): 73–92. doi: 10.1016/0013-7952(79)90022-X |
| Fan HM, Cai QG, 2003. Review of research progress in freeze-thaw erosion. Science of Soil and Water Conservation, 1(4): 50–55. |
| Formanek GE, McCool DK, Papendick RI, 1984. Freeze-thaw and consolidation effects on strength of a wet silt loam. Transactions of the ASAE, 27(6): 1749–1752. doi: 10.13031/2013.33040 |
| Güllü H, Khüdir A, 2014. Effect of freeze-thaw cycles on unconfined compressive strength of fine-grained soil treated with jute fiber, steel fiber and lime. Cold Regions Science and Technology, 106-107: 55–65. doi: 10.1016/j.coldregions.2014.06.008 |
| Kok H, McCool DK, 1990. Quantifying freeze/thaw-induced variability of soil strength. Transactions of the ASAE, 33(2): 501–506. doi: 10.13031/2013.31357 |
| Konrad JM, 1989. Physical processes during freeze-thaw cycles in clayey silts. Cold Regions Science and Technology, 16(3): 291–303. doi: 10.1016/0165-232X(89)90029-3 |
| Kurylyk BL, MacQuarrie KTB, McKenzie JM, 2014. Climate change impacts on groundwater and soil temperatures in cold and temperature regions: Implications, mathematical theory, and emerging simulations tools. Earth-Science Reviews, 138: 313–334. doi: 10.1016/j.earscirev.2014.06.006 |
| Kurylyk BL, Watanabe K, 2013. The mathematical representation of freezing and thawing processes in variably-saturated, non-deformable soils. Advances in Water Resources, 60: 160–177. doi: 10.1016/j.advwatres.2013.07.016 |
| Lee W, Bohra NC, Altschaeffl AG, 1995. Resilient modulus of cohesive soils and the effect of freeze-thaw. Canadian Geotechnical Journal, 32(4): 559–568. doi: 10.1139/t95-059 |
| Li S, Gao SY, Yang P, et al, 2005. Some problems of freeze-thaw desertification in the Tibetan Plateau: a case study on the decertification regions of the western and northern plateau. Journal of Glaciology and Geocryology, 27(4): 476–485. |
| Mostaghimi S, Young RA, Wilts AR, et al, 1988. Effects of frost action on soil aggregate stability. Transactions of the ASAE, 31(2): 435–439. doi: 10.13031/2013.30727 |
| Sharratt BS, Lindstrom MJ, Benoit GR, et al, 2000. Runoff and soil erosion during spring thaw in the northern U. S. Corn belt. Journal of Soil and Water Conservation, 55(4): 487–494. |
| Wang DY, Ma W, Niu YH, et al, 2007. Effects of cyclic freezing and thawing on mechanical properties of Qinghai-Tibet clay. Cold Regions Science and Technology, 48(1): 34–43. doi: 10.1016/j.coldregions.2006.09.008 |
| Wang F, Fan HM, Guo CJ, et al, 2008. Comparison and analysis of climate environmental variation in two main freeze-thaw erosion regions in China. Ecology and Environment, 17(1): 173–177. |
| Wang L, Shi ZH, Wu GL, et al, 2014. Freeze/thaw and soil moisture effects on wind erosion. Geomorphology, 207: 141–148. doi: 10.1016/j.geomorph.2013.10.032 |
| Williams RBG, Robinson DA, 2001. Experimental frost weathering of sandstone by various combinations of salt. Earth Surface Processes and Landform, 26(8): 811–818. doi: 10.1002/esp.227 |
| Xie SB, Qu JJ, Lai YM, et al, 2015. Effects of freeze-thaw cycles on soil mechanical and physical properties in the Qinghai-Tibet Plateau. Journal of Mountain Science, 12(4): 999–1009. doi: 10.1007/s11629-014-3384-7 |
| Yang MX, Yao TD, Gou XH, et al, 2007. Diurnal freeze/thaw cycles of the ground surface on the Tibetan Plateau. Chinese Science Bulletin, 52(1): 136–139. doi: 10.1007/s11434-007-0004-8 |
| Zhang JG, Liu SZ, Yang SQ, 2007. The classification and assessment of freeze-thaw erosion in Tibet. Journal of Geographical Sciences, 17(2): 165–174. doi: 10.1007/s11442-007-0165-z |
 2016, 8


