 2016, 8
Article Information
- XiaoYu Zhang, ZhongQin Li, Ping Zhou, ShengJie Wang. 2016.
- Characteristics and source of aerosols at Shiyi Glacier,Qilian Mountains, China
- Sciences in Cold and Arid Regions, 8(2): 135-146
- http://dx.doi.org/10.3724/SP.J.1226.2016.00135
Article History
- Received: October 16, 2015
- Accepted: December 16, 2015


2. College of Geography and Environment Science, Northwest Normal University, Lanzhou, Gansu 730070, China
1 Introduction
Aerosols are an important atmospheric constituent that influences climate, and they are related to human activities(Buseck and Pósfai,1999). The climatic influence of aerosols is complex. Light scattering by aerosols decreases penetration of solar radiation through the atmosphere and absorption at the surface,increases cloud reflectance,enhancescloud lifetimes, and suppresses precipitation,thereby exerting a cooling influence(Schwartz and Andreae, 1996; Ramanathan et al., 2007). Althougha considerable amount of attention has been paid to the radiative properties ofaerosols,there are still uncertainties in qualifying their net effect on the globalclimate,largely due to the high spatial and temporal variability of aerosol concentrations and properties(Cong et al., 2010). Therefore,better underst and ing of the various effects of aerosols in the atmosphere requires more detailed information on aerosol chemical and physical properties from diverse geographic locations.
Water-soluble ions comprise a large partof aerosol particles and play an important role in the atmospheric chemistry(Deshmukh and Deb, 2013). It was reported that water-soluble ions such as sulfate,nitrate, and other acid-rain-related pollutants have severe effects on human health(Raizenne et al., 1996).
Individual-particle analysis through scanning electron microscopy and energy dispersive X-ray analysis(SEM-EDX)can providea great amount of information on the differences in morphology,elementalcomposition, and particle density of aerosols to further investigate their potential sources as well as the transport of pollutants,which cannot be obtained through bulk ionic analysis(Paoletti et al., 2002; Reid et al., 2003; Srivastava et al., 2009).
Glaciers of the Qilian Mountains are sensitive indicators of climate change and are natural archives of variations in atmospheric processes. The Qilian Mountains are located at the center of thearid and semi-arid regions of central Asia,in the northeastern edge of theTibetan Plateau which is connected to the arid region of northwest China. It isthe major water source and climate regulation zone of the Hexi Corridor, and also the interaction zone of the Qinghai-Tibet Plateau and Asian dust activities.
Asian dust storms originating from thisarea as well as from the larger deserts on the planet,which include the Gobi,Taklimakan, and BadainJaran deserts of Asia,are the primary sources of mobilized desert topsoilsthat move great distances through the atmosphere each year. Transport and deposition of this dust plays a significant role in the biogeochemical cycles and atmospheric chemistry of the Northern Hemisphere(Arimoto et al., 1996; Griffin,2007).
The Shiyi Glacier in the Qilian Mountains(Figure 1),with its highest elevation of 4,711 m a.s.l.,provides a unique opportunity to improve our underst and ing of aerosols transport in the freetroposphere,which has potentially significant impacts on regional and global climates, and can deepen our knowledge of physical processes in the cryosphere(Wang et al., 2013).
 |
| Figure 1 Location map of the Shiyi Glacier with geographic environment |
Studies on atmospheric chemistry have been very limited to date on both temporal and spatial scales in this area. Ion chemistry studies of aerosols have suggested that the atmospheric environmentis mainly controlled by natural sources; however,during summer monsoons,man-made pollution emissions cannot be ignored(Wang et al., 2013).Nevertheless,there is no data reported to reflect the air conditions directly.Therefore,in order to obtain updated knowledge of the air conditions,anintensive aerosol sampling experiment was conducted during a scientific expedition to Shiyi Glacier in the Qilian Mountains from July 24 to August 19,2012.
The purposes of this study were to underst and the inorganic ion chemistry properties of the aerosols,determine the elemental compositions and morphological properties of individual aerosol particles,identify their sources of origin, and evaluate the influence of anthropogenic pollutants on the atmosphere over the Qilian Mountains. The 13-dayintensive sampling was intended to elucidate the characteristics of aerosols in summer time. This field experiment was the first-ever investigation of inorganic ion chemistry and individual particle analysis of aerosols.
2 AerosolsamplingAerosol samples were collected for a 26-day period fromJuly 24 to August 19,2012. Aerosol samples were recovered on Zefluo TeflonTMfilters(2.0-μm pore size,47-mm diameter; Gelman Sciences)using a 12-V diaphragm pump powered by solar cells. The filters were loaded in the field and mountedface-down about 1.5 m above the ground surface. Air volume through each filter was measured byan in-line meter and then converted into st and ard conditions according to the local ambient pressure and temperature. The particle collection efficiency(for particles as small as 0.035 μm)was estimated to be >97% based on the mean flow rate of 1.27 m3/h over the filter(Liu et al., 1984; Zhao et al., 2011).
The sampling period for each aerosol sample was 3-10 h,with samples taken from09:00 to 18:00(Beijing time)depending on weather conditions. No samples were collected during rain or snow events. After sampling,the filters were removed from the filter holder and placed in cleaned airtight plastic containers and stored at 4 ℃ before analysis. Meteorological parameters,including air temperature,wind speed and direction,precipitation,air pressure, and relative humidity were measured simultaneously by an automatic weather station that was placed near the aerosol sampling site. The actual measured meteorological parameters are summarized in Table 1.
| Parameters | Units | Mean | Range |
| Air pressure | hPa | 700 | 70-900 |
| Temperature | ℃ | 7.2 | 4.7-10.4 |
| Relative humidity | % | 71.8 | 51.3-87.7 |
| Wind speed | m/s | 5.5 | 0.7-12.0 |
Eight major inorganic ions(Cl−,NO3−,SO42−,Na+,NH4+,K+,Mg2+, and Ca2+)of the aerosol samples were analyzed in aclass 100 clean room,using a Dionex ion chromatograph(model DX-320; ThermoFisher Scientific Inc.). To efficiently extract the water-soluble ions from theTeflonTM aerosol filters,each filter was first wetted with 200 μLof ultra-pure methanol and then extracted with 25 mL of deionized water for about 30 min using an ultrasonic water bath device(Sun et al., 1998;Zhao and Li, 2004; Zhao et al., 2011).
The cation chromatography conditions were as follows: a Dionex IonPac CS12A(4mm×250mm)analytical column,15 mmol/L and 1.0 mL/min methane eluent, and 200 μL sample injected; for anions,an AS11-HC(4mm×250mm)analyti calcolumn,15 mmol/L and 1.0 mL/min NaOH eluent, and 200 μL sample injected(Zhao and Li, 2004).
The average concentrations of 10 laboratory blanks were: Cl− (8.50 ng/g),NO3−(48.43 ng/g),SO42−(6.07ng/g),Na+(7.76 ng/g),NH4+(11.71 ng/g),K+(7.11ng/g),Mg2+(2.36 ng/g), and Ca2+(13.65 ng/g). These were obviouslylower than the concentrations detected in the aerosol samples. Mean blank values were subtracted from the sample concentrations and then the sample concentrations were divided by the sample volumes(at st and ard conditions)ofeach sample and converted into micrograms per cubic meters,which are listed inTable 2. Detailed sampling methods and analytical techniques of aerosols are described by Zhao and Li(2004) and Zhao et al.(2011).
 |
For each membrane,a section of the total filter was cut and mounted onto the electron microprobe stub, and coated with a thin gold film(10 nm)for a higher-quality secondary electron image. The signal of Au in the EDX diagrams appeared at the fixed opposition, and the gold film was too thin to prevent proper identificationof the other elemental compositions. In our study,individual particles were analyzed using a scanning electron microscopy-energy dispersive X-rayspectrometer(SEM-EDX). Asection of each filter was cut and mounted onto the electron microprobe stub, and coated with a thin gold film(16 nm)for a higher-quality secondaryelectron image. The operating conditions were: accelerating voltage in range of 5-10 kV; spectral acquisition time is 60 s. NoranTM System software(ThermoFisher Scientific Inc.)for energy-dispersive microanalysis was used for the quantitative analysis of individual particles.
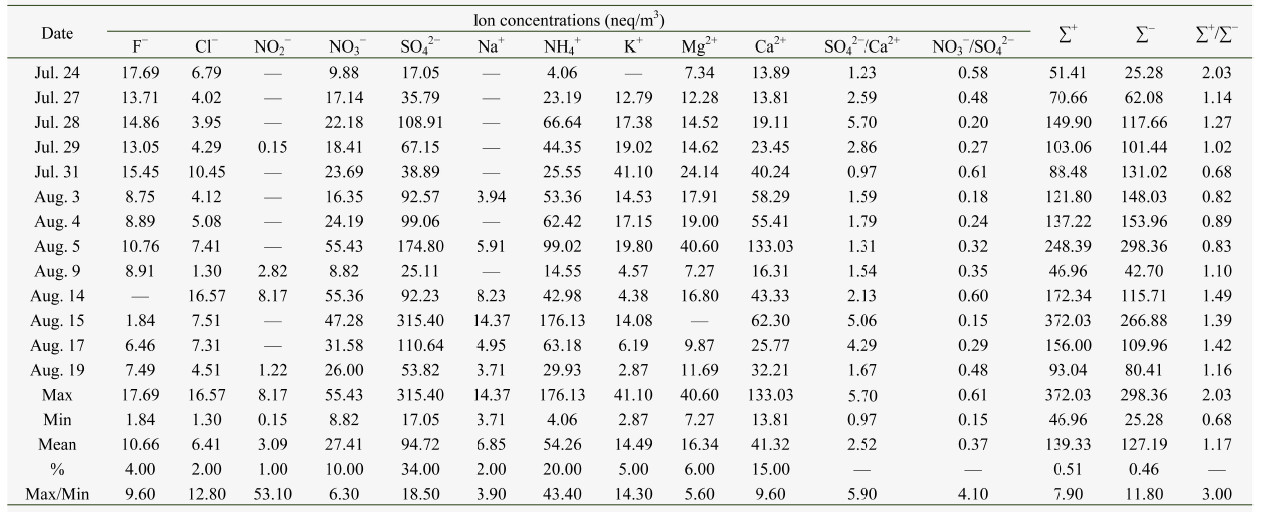
4 Results and discussion 4.1 Mass loading of chemical composition of aerosolsover Shiyi Glacier 4.1.1 Concentrations of water-soluble inorganicions in total aerosolsA totalof 13 atmospheric aerosol samples were collected during the scientific expedition to Shiyi Glacier. To provide an overview of the chemical composition characteristics,the daily concentrations of the major inorganic ions(F−,Cl−,NO2−,NO3−,SO42−,Na+,NH4+,K+,Mg2+, and Ca2+)are shown in Table 2. Of all the anions,sulfate was the dominant component,followed by nitrate; of the cations,ammonia had thehighest concentration,while the concentrations of chloride and nitrite were much lower than the others.
The concentration of SO42− ranged from 17.05 to 315.40 ng/m3,with a mean value of 94.72 ng/m3,while the concentration of NO3−varied from 55.43 to 8.82 ng/m3,with a mean value of 27.41 ng/m3.The mean concentration of NO2− was about 3.09 ng/m3 and Cl− was about 6.41 ng/m3. Ammonia and calcium werethe most prominent components. The concentration of Ca2+ ranged from 13.81 to 133.03 ng/m3 with an average value of41.32 ng/m3, and the concentration of ammonia varied from 4.06 to176.13 ng/m3 with an average value of 54.26 ng/m3; K+ and Na+ had lower levels of concentration than the otheranalyzed cationic species,averaging about 6.85-14.49 ng/m3.
The following ion balance calculations are commonly used to evaluate the acid-basebalance of aerosol particles:
| ${\sum ^ + } = N{a^ + }/23 + N{H_4}^ + /18 + {K^ + }/39 + M{g^{2 + }}/12 + C{a^{2 + }}/20$ | (1) |
| ${\sum ^ - } = {F^ - }/19 + C{l^ - }/35.5 + N{O_2}^ - /46 + N{O_3}^ - /62 + S{O_4}^{2 - }/48$ | (2) |
Theratios of the sum of the equivalent concentrations of cations to anions(∑+/∑−)were calculated and presented in Table 2. The ion balance expressed by the sumof the concentrations of anion-to-cation is a good indicator to study theacidity of the environment(Verma et al., 2010).
The ratios calculated for all aerosol samples ranged from 0.675 to 2.033. Such variation of ion balance can probably be attributed to the different air masses that arrived at the sampling site,which meant there were different origins with different air conditions.
The ∑+/∑− ratios for the aerosol samples on July 31 and August 3-5 were <1.0,which indicated that these samples were acidic.This was possibly due to the NO3− and SO42−increasing much more than the cations. The ∑+/∑− ratios for the aerosol sample collected on July 29 was 1.02,suggesting that aerosol particles on that day were almost neutral. The ratios of the other samples were >1.0,indicating that they were more alkaline. The total equivalents of anions were plotted against the total equivalents of cations, and the slope of the regression line was slightly lower than unity(Figure 2,slope = 0.97,R2 = 0.77),which implied cation deficiencies.
 |
| Figure 2 Ionbalance of the major water-soluble inorganic ions in the aerosols of ShiyiGlacier, Qilian Mountains |
High temperature is probably the primary reason for the volatilization of NH4+(Khoder and Hassan, 2008). However,the lower temperature over this glacierizedregion(Table 1)may have contributed to the very low vaporization or volatilization of NH4+ in our samples. Thus,the cation deficiencies could mostly be attributed to H+,which was not counted inEquations (1) and (2) above(Zhao et al., 2011).
Because organic ions are another important constituent of aerosol particles,the lack of organic ions would cause some errors in estimation of the ion balances.Because ions like formate,acetate, and other organic acid ions will contribute to the sum of the equivalent concentration of anions ∑−,thereal values of the ∑+/ ∑− ratios will become smaller. Therefore,the deviation to the upper side of the theoretical lineindicates a deficiency of anions,since bicarbonate,organic ions(formate and acetate),CO32−,HCO3−,PO43− and Br−were not determined in the present study(Khoder and Hassan, 2008).
4.1.2 Correlation between ionic species inaerosolsIn order to identify and separate the impacts of various sources,correlation coefficients between the ionic species were calculated and are shown in Table 3. The sum mass concentration of SO42−,NH4+,NO3− and Ca2+ accounted for about 80% of all the 10 ions measured, and significantly positive correlation coefficients were found between SO42− and NH4+ (r = 0.98),NO3− and SO42−(r = 0.79), and Ca2+ and NO3−(r = 0.79).
| F− | Cl− | NO2− | NO3− | SO42− | Na+ | NH4+ | K+ | Mg2+ | Ca2+ | |
| F− | 1.00 | |||||||||
| Cl− | 0.05 | 1.00 | ||||||||
| NO2− | −0.03 | 0.46 | 1.00 | |||||||
| NO3− | −0.19 | 0.61 | −0.19 | 1.00 | ||||||
| SO42− | −0.05 | 0.41 | −0.15 | 0.79 | 1.00 | |||||
| Na+ | −0.33 | 0.57 | 0.10 | 0.75 | 0.84 | 1.00 | ||||
| NH4+ | −0.01 | 0.44 | −0.01 | 0.74 | 0.98 | 0.82 | 1.00 | |||
| K+ | 0.53 | 0.44 | 0.03 | 0.34 | 0.45 | 0.22 | 0.50 | 1.00 | ||
| Mg2+ | 0.42 | 0.41 | −0.15 | 0.59 | 0.40 | 0.23 | 0.38 | 0.68 | 1.00 | |
| Ca2+ | 0.13 | 0.43 | −0.15 | 0.79 | 0.77 | 0.62 | 0.74 | 0.56 | 0.84 | 1.00 |
Querol et al.(1998)proposed the presence of(NH4)2SO4·CaSO4·2H2O for the NH4+/SO42− molar ratio close to 1.0 based on XRD(X-ray diffraction)observations. In the present study,the NH4+/SO42− ranged from 0.24 to 0.66,with a meanvalue of 0.37, and all of the ratios were <1.0,indicating that sulfate may have been present as CaSO4 and (NH4)2SO4·CaSO4·2H2O. Consistent with the observations of previous investigators,NH4+/SO42− molar ratios <1.0 could be explained by the combination of sulfate withcalcium to form CaSO4, and with ammonium and calcium to form(NH4)2SO4·CaSO4·2H2O(Duan et al., 2003; Khoder and Hassan, 2008).
To separate anthropogenic sources from natural sources of SO42−,we calculated the value of the equivalent concentration ratio of SO42−/Ca2+ as described by Ming et al.(2007). High values of SO42−/Ca2+(43.2 and 138.8)near Mount Qomolangma suggested that SO42− hadprimarily anthropogenic sources,while lower value(3.8)suggested primarilydust sources(Ming et al., 2007). The values of SO42−/Ca2+ in our samples ranged from 0.97 to 5.70(Table 2). This indicated thatdomestic house heating in winter,industrial coal burning, and other fossilfuel burning were the major potential pollution sources of SO42−in this region. This means the SO42− in our samples wascontrolled by both natural processes and anthropogenic sources.
Gaseous NH3 can be either wet- or dry-deposited,or can neutralize H2SO4,HNO3 and HCl to form ammonium bisulphate(NH4HSO4),ammonium nitrate(NH4NO3), and ammonium chloride(NH4Cl)via particle gas formation and gas-to-particle conversion(Baek and Aneja, 2005; Aneja et al., 2009; Ianniello et al., 2011). They areusually formed in these formulae: H2SO4+NH3→NH4HSO4; HNO3 + NH3 ↔ NH4NO3; HCl +NH3 ↔ NH4Cl; therefore,some of the NH4+in this study could also exist as NH4HSO4,NH4NO3, and NH4Cl(Ianniello et al., 2011). The formations are significantin summer due to the conversion of gaseous precursors(Wang et al., 2005),while the potential sources for ammonia in the formula are human and agriculture activities such as animal farming,use of fertilizers, and organicdecomposition(Sun et al., 1998; Kreutz et al., 2001; Wu et al., 2006; Verma et al., 2010).
Nitrogen oxides emissions from mobile sources are an important contributor to NO3−in the atmosphere. Therefore,the mass ratio of NO3−/SO42−has been used as an indicator of the relative importance of stationary versusmobile sources of sulfur and nitrogen in the atmosphere(Arimoto et al., 1996; Khoder and Hassan 2008;). Arimoto et al.(1996)ascribed a high NO3−/SO42−mass ratio to the predominance of mobile sources over stationary sources ofpollutants. In the present study,the average mass ratios of NO3−/SO42−were 0.37 on average,relatively similar to that found in some cities in China,such as Shanghai(0.43; Yao et al., 2002),Qingdao(0.35; Hu et al., 2002). This was slightly higher than those reported in Taiwan(0.2; Fang et al., 2002) and Guiyang(0.13; Xiao and Liu, 2004), and lower than thosefound in Beijing during 2001-2003(0.71; Wang et al., 2005) and Shanghaiin 2006(0.83; Wang et al., 2006). Generally,the mass ratio of NO3−/SO42−in the aerosols of Shiyi Glacier was <1.0,suggesting that stationary sourceemissions were more predominant.
NO3− is the most of the reaction product of NOx emission,while the NOx emission is mainly due to fossil fuelcombustion and biomass burning(Wang et al., 2006; Wu et al., 2006). Under an alkaline atmospheric environment,gaseous HNO3formed by the oxidation of NOx can be absorbed on the surfaceof mineral particles and reacted to form salts(Mamane and Gottlieb, 1992).This may be the reason why NO3− has significantcorrelations with Na+,NH4+ and Ca2+(r = 0.75,0.74, and 0.79,respectively).Previous studies found that automobile exhaust is a major contributor of NO3−(Arimoto et al., 1996; Wang et al., 2005,2006; Bhaskar et al., 2010). Glacio-chemical investigation from the Belukha Glacier(Olivier et al., 2003)also pointed out that increased nitrates resulted from thegrowth of traffic and the associated rise of the emission of precursor gases NOx.Therefore,the higher content of NO3− in our study waslikely related to anthropogenic pollutions, and traffic emissions from QilianCounty may also be a potential source.
Significant correlations with Ca2+,Na+,SO42− and NO3− suggest that there are some other compounds originatingfrom desert dust,existing as Na2SO4,NaNO3 and Ca(NO3)2. Calcium is usually rich in desert and loess soils, and even in atmospheric aerosol particles collected from thedesert and loess areas,Ca2+ was always accepted as a proxy for dustin past studies of snow and ice chemistry(Mayewski et al., 1993; Wolff,1996; Zhang and Edwards, 2011). Previous studies over the Tianshan Mountainsfound that the surrounding desert and arid regions were usually considered tobe the primary sources of Ca2+(Williams et al., 1992; Sun et al., 1998; Aizen et al., 2004; Zhang et al., 2008; Zhang et al., 2012). Okada and Kai(2004)also found thatthe calcium-rich mineral particles in deserts usually present as CaCO3,CaSO4, and internal mixtures of CaCO3 and CaSO4or silicates. However,in this study the potential existence of Ca(NO3)2 gave us a new revelation,that is,human activity has already affectedthis region by the use of chemical fertilizers,because calciumnitrate is a typical fast-acting fertilizer material used in agriculture. It is also used in the electronics industry for coating cathodes.
Halite(NaCl)particles were commonly detected in aerosolparticles collected over the Taklimakan Desert(Okada and Kai, 2004). Wake et al.(1990) and Sun et al.(1998)also pointed out that Na+ and Cl− in the TianshanMountains represent an input of Na+ and Cl− rich dustoriginating from the extensive evaporate deposits in the arid regionssurrounding these mountain ranges.
Potassium is also probably derived from the evaporation of insecticides,chemical fertilizers, and dust,because it has higher correlations with F− and SO42−(r = 0.53 and 0.45,respectively).
4.1.3 Comparison with data of the other areasIn our study,mean ion concentrations of the aerosol samples were ordered as SO42−> NH4+ > Ca2+ > NO3− >Mg2+ >K+ > F− >Na+> Cl−>NO2−.These mean ion concentrations of the Shiyi Glacier were generally comparablewith the background conditions in remote sites in the Qilian Mountains and theTianshan Bogda Glacier,except that SO42− and Ca2+were slightly higher, and the ion concentrations were much lower than those incities such as Beijing of China and Raipur of India(Table 4).
| Sampling place | Study period | Cl− | NO3− | SO42− | Na+ | NH4+ | K+ | Mg2+ | Ca2+ | References |
| Shiyi Glacier | Jul. 2012-Aug. 2012 | 0.23 | 1.70 | 4.55 | 0.16 | 0.98 | 0.56 | 0.20 | 0.83 | This study |
| Raipur, India | Jul. 2009-Jun. 2010 | 3.23 | 5.63 | - | 1.75 | 5.18 | 0.87 | 0.80 | 2.53 | Deshmukh et al. (2013) |
| Beijing, China | 2001-2003 | 2.69 | 21.10 | 24.80 | 1.60 | 11.90 | 1.74 | 2.04 | 9.05 | Wang et al. (2005) |
| Ishikawa, Japan | 2001-2003 | 3.10 | 11.50 | 17.10 | 0.60 | 8.70 | 1.60 | 0.20 | 1.60 | Sun et al. (2004) |
| Bogda Glacier, Tianshan Mts. | Jul. 2009-Aug. 2009 | 2.77 | 1.77 | - | 1.86 | 1.31 | 0.12 | 0.23 | 0.25 | Zhao et al. (2011) |
| Qilian Mountains | Jul. 2010-Jul. 2011 | 0.05 | 0.56 | 0.86 | 0.11 | 0.09 | 0.13 | 0.01 | 0.28 | Wang et al. (2013) |
The particles were grouped into two dominant types according to their morphology and EDX signal(Table 5). Figure 3 shows the typical individual particles loaded on the filters at different magnifications. The distinct characteristics and possible origins of each group are described in detail as follows.
| Cluster | Type | Cluster number | Counts (s) | Atomic (%) | Relative weight (%) | |||||
| Si | Mg | Al | Ca | Fe | K | |||||
| A | Si-rich | C1 | 11.10 | 64.54 | 55.85 | 8.73 | 5.16 | - | 30.26 | - |
| C2 | 34.65 | 41.68 | 34.62 | 1.71 | 12.27 | 15.80 | 13.74 | 21.87 | ||
| C4 | 21.94 | 60.84 | 53.04 | 2.50 | 5.33 | 7.01 | 10.63 | 21.49 | ||
| B | Fe-rich | C3 | 2.44 | 37.59 | 9.72 | 13.03 | 11.61 | 11.68 | 53.96 | - |
Mineral particles,comprising silicates(Na2SiO3,CaMg3Si4O12,K2Al2Si6O16,Al2(OH)4Si2O5),quartz(SiO2),feldspars(KAlSi3O8,NaAlSi3O8,CaAl2Si2O8),gypsum(CaSO4),calcite(CaCO3), and pyroxene(Ca,Mg,Fe,Al)2 (Si,Al)2O6,etc.,were the richest particles over this region. The sizes of the mineral particlesgenerally ranged from 0.6 to 14.1 μm. Most of these particles had irregularshapes(Figure 3),suggesting that they were from natural sources. Particles containingpredominantly silicon were classified as quartz(SiO2),with theirregular shapes shown in Figures 3a,b,d. As an important constituent of manyrock types and dust,quartz is almost ubiquitous on l and areas.
 |
| Figure 3 SEM images of typical aerosol particles. (a), (b), (d): Si-rich particles; (c): Fe-rich particles |
In our study,particles containing Si werethe major composition,with an average abundance of 38.3%. These particles canmainly be attributed to the surrounding dust sources or aeolian dispersion ofsoil particles,which originated from local deserts or through long-rangetransport from the west. This was similar to the results of aerosols collectedfrom the high Himalayas(Cong et al., 2010).
About 11.5% of the particles were identified with high amounts of Ca. These particlescould be classified into three types in theory:calcium sulfates characterized by high and approximately equal amounts of Ca and S, and calcium carbonates and calcium nitrates characterized by only relativelyhigh X-ray intensities of Ca. The primary natural source of calcium sulfate is gypsum,a typical mineral in the earth crust but generally much less abundant than CaCO3(Gao et al., 2007). Since the lighter elements such as C,N, and O are very difficultto quantify from EDS spectra,calcium nitrate and carbonate cannot bedistinguished in an automated analysis,which is why calcium sulfate is easily identified.
4.2.2Fe-rich particlesFe-richparticles are considered to be oxides(hematite,magnetite)or oxyhydroxides(goethite)(Cong et al., 2010). Fe-rich particles accounted for 27.2% ofthe findings in the Shiyi Glacier. Besides soil dispersion,Fe-rich particlescan also be produced by coal-fired boilers,metal industries, and power plants.Fe-rich particles emanated from a high-temperature furnace usually show aspherical shape. However,Fe particles in this study had irregular(non-spherical)morphology(Figure 3c), and were thus identified as being of natural origin.
There were also some very small spherical-shaped particles with smooth edges and surfaces,shown in Figures 3a,c; these were likely emitted by ahigh-temperature process. They may have originated from the steel industry orfrom coal combustion. These unrecognized particles could contain organicparticles with light elements(such as C,N, and O)or biological particles.
In summary,most of the large particles detected over the Shiyi Glacier wereprobably from natural mineral dust,while very small particles may have beenemitted by anthropogenic activities. This suggests that both natural processes and anthropogenic pollution were the aerosol sources over this glacierized siteduring the sampling period.
4.2.3 Particle shapes indicated by particle circularityWe used particle circularity as the shape parameter tocharacterize the degree of shape complexity of the particles. The circularitywas defined as:
| $C = {L^2}/\left({4\pi A} \right)$ | (3) |
where C iscircularity(non-dimensional),L is particle perimeter(μm), and A is the two-dimensional area of the particle in the SEMimage(μm2)(Gao et al., 2007).
A circle has a circularity of 1.0, and a square has acircularity of 1.27. As the shape gets more complex,the circularity valueincreases. The circularity of the Si-rich type of dust particles(Figures 3a,b,d)ranged from 2.9 to 4.4,with a mean value of 3.77,suggesting the non-sphericalnature of dust particles over the region.
4.3 Relationships with air mass transportThe Hybrid Single-Particle Lagrangian Integrated Trajectory(HYSPLIT)model of the NOAA Air Resources Laboratory has been widely used inprevious studies(e.g.,Ming et al., 2007; Cong et al., 2010). We used this model to simulate five-day backward air trajectories with adaily resolution to identify potential transport pathways and possible sourceregions of the aerosols at the Shiyi Glacier. Figure 4 presents the dailybackward trajectories terminated at the sampling site(38.21°N,99.88°E; 4,637m a.s.l.)during the sampling periods. Most of the air masses were transportedfrom the west,northwest, and south. Combined with the ion concentrationslisted in Table 2,air masses arriving at the sampling site could be classifiedinto three types:
 |
| Figure 4 Daily backward trajectories arriving at the samplingsite (38.21°N, 99.88°E; 4,637 m a.s.l.) |
1)Theair masses which arrived on August 3,15, and 19 originated from or weretransported through the arid regions of Kazakhstan,Kyrgyzstan,Uzbekistan, and the northern region of the Taklimakan Desert. They then passed through theurban area of Yumen City,Dunhuang City,Qinghai Lake, and Qilian County,which may have resulted in the input ofdesert dust and some anthropogenicpollution. These air masses caused the higher concentrations of cations. Also,the concentrations of SO42−,NO3−, and NH4+ were very high.
2)Theair masses which arrived on July 24 and July 31 represented the short-rangeaerosol transport of air masses originating from the western edge of the BadanJaran Desert. They passedthrough the north slope of theQilian Mountains and arrived at the glacier. The relatively lowerconcentrations of SO42−,NO2−,NO3−, and NH4+at the Shiyi Glacier may be attributed to these cleaner air masses.
3)The air masses which arrived on July 27 and July 29, and August 4 and 5 represented the short-range aerosol transport of air massesoriginating from the south,specifically the Sichuan Hengduan Mountains. They crossed over two otherprovinces(Gansu and Qinghai) and finally reached our sampling site.
Our backward air mass trajectory analysis suggested that inl and cities may have contributed some anthropogenic pollution to this glacier,while the arid and semi-arid regions of central Asia were the primary sources of the mineral particles.
5 ConclusionsIntensive aerosol sampling experiments were conducted from July 24 to August 19,2012,providing the first-ever information about the atmosphere over the ShiyiGlacier in the Qilian Mountains. Inorganic ion chemistry and individualparticle characteristics of the aerosols were analyzed through ion chromatography and SEM-EDX,respectively.
The results showed that SO42− and NH4+were the most abundant components of all the anions and cations,respectively.Of all the anions,sulfate was the dominant component,followed by nitrate.Ammonia had the highest concentration of the cations,while concentrations ofchloride and nitritewere much lower than the others.
The relationship between the eight inorganic ion species and their origins indicated that domestic house heating in winter,industrial coal burning, and burning of other fossil fuels were the potential pollution sources of SO42−in this region. The SO42− in our samples was controlledby both natural processes and anthropogenic sources.
The mass ratio of NO3−/SO42− in the aerosolsof the Shiyi Glacier was <1.0,suggesting that the stationary sourceemissions were more predominant,while the potential existence of Ca(NO3)2 suggested that human activity has already affected this region by the useof chemical fertilizers.
Based onmorphology,elemental compositions, and EDX signal,the particles were groupedinto two dominant types: Si-rich particles and Fe-rich particles. Most of thelarge detected particles over this region were probably from natural mineraldust,while very small particles may havebeen emitted by anthropogenic activities. This suggests that both natural processes and anthropogenic pollution were the aerosol sources over the Shiyi Glacierduring the sampling period.
Acknowledgments:This research was jointly supported by the NationalNatural Science Foundation of China(Nos. 41201065,41121001,41261017,41171057,41161012); Funds for Creative Research Groups of China(No. 41121001),the Foundation for Excellent Youth Scholars of CAREERI,CAS(No. 51Y251B51); the SKLCS Foundation(No. SKLCSZZ-2012-01-01); the NationalBasic Research Program of China(Nos. 2010CB951003,2010CB951404), and theKnowledge Innovation Project of the Chinese Academy of Sciences(No.KZCX2-EW-311). We would like to thank WenBin Wang,MingYing Xia,YuanYang She,XuLiang Li, and Shuang Jin for the sampling, and YuMan Zhu,QiuFang Bao, and YaPing Liu for the chemical analyses.
| Aizen VB, Aizen EM, Melack JM, et al., 2004. Association between atmospheric circulation patterns and firn-ice core records from the Inilchek glacierized area, Central Tien Shan, Asia. Journal of Geophysical Research, 109(D08304). DOI:10.1029/2003JD003894. |
| Aneja VP, Schlesinger WH, Erisman JW, 2009. Effects of agriculture upon the air quality and climate:research, policy, and regulations. Environmental Science & Technology, 43:4234-4240. |
| Arimoto R, Duce RA, Savoie DL, et al., 1996. Relationships among aerosol constituents from Asia and the North Pacific during Pem-West A. Journal of Geophysical Research, 101:2011-2023. |
| Baek BH, Aneja VP, 2005. Observation based analysis for the determination of equilibrium time constant between ammonia, acid gases, and fine particles. International Journal of Environment and Pollution, 23(3):239-247. |
| Bhaskar BV, Jeba Rajasekhar RV, Muthusubramanian P, et al., 2010. Ionic and heavy metal composition of respirable particulate in Madurai, India. Environmental Monitoring and Assessment, 164:323-336. |
| Buseck PR, Pósfai M, 1999. Airborne minerals and related aerosol particles:Effects on climate and the environment. Proceedings of the National Academy of Sciences, 96(7):3372-3379. |
| Cong ZY, Kang SC, Dong SP, et al., 2010. Elemental and individual particle analysis of atmospheric aerosols from high Himalayas. Environmental Monitoring and Assessment, 160:323-335. |
| Deshmukh DK, Deb MK, Suzuki Y, et al., 2013. Water-soluble ionic composition of PM2.5-10 and PM2.5 aerosols in the lower troposphere. Air Quality Atmosphere and Health, 6:95-110. |
| Duan FK, Liu XD, He KB, et al., 2003. Atmospheric aerosol concentration level and chemical characteristics of water-soluble species in wintertime in Beijing, China. Journal of Environmental Monitoring, 5:569-573. |
| Fang G, Chang C, Wu Y, et al., 2002. Ambient suspended particulate matters and related chemical species study in central Taiwan, Taichung during 1998-2001. Atmospheric Environment, 36:1921-1928. |
| Gao Y, Anderson J, Hua X, 2007. Dust characteristics over the North Pacific observed through shipboard measurements during the ACE-Asia experiment. Atmospheric Environment, 41:7907-7922. |
| Griffin DW, 2007. Atmospheric movement of microorganisms in clouds of desert dust and implications for human health.Microbiology Reviews, 20(3):459-477. DOI:10.1128/CMR.00039-06Clin. |
| Hu M, He L, Zhang Y, et al., 2002. Seasonal variation of ionic species in fine particles at Qingdao, China. Atmospheric Environment, 36:5853-5859. |
| Ianniello A, Spataro F, Esposito G, et al., 2011. Chemical characteristics of inorganic ammonium salts in PM2.5 in the atmosphere of Beijing(China). Atmospheric Chemistry and Physics, 11:10803-10822. |
| Khoder MI, Hassan SK, 2008. Weekday/weekend differences in ambient aerosol level and chemical characteristics of water-soluble components in the city centre. Atmospheric Environment, 42:7483-7493. |
| Kreutz KJ, Aizen VB, Cecil LD, et al., 2001. Oxygen isotopic and soluble ionic composition of a shallow firn core, Inilchek glacier, central Tien Shan. Journal of Glaciology, 47(159):548-554. |
| Liu BYH, Pui DYH, Rubow KL, 1984. Characteristics of air sampling filter media. Aerosols in the mining and industrial work environments. In:Marple VA, Liu BYH(eds.). Instrumentation, Vol. 3. Newton, MA:Butterworth-Heinemann, pp. 989-1038. |
| Mamane Y, Gottlieb J, 1992. Nitrate formation on sea-salt and mineral particles-a single particle approach. Atmospheric Environment, 26:1763-1769. DOI:10.1126/science.261.5118.195. |
| Mayewski PA, Meeker LD, Whitlow S, et al., 1993. The atmosphere during the Younger Dryas. Science, 261:192-197. |
| Ming J, Zhang D, Kang S, et al., 2007. Aerosol and fresh snow chemistry in the East Rongbuk Glacier on the northern slope of Mt. Qomolangma(Everest). Journal of Geophysical Research, 112(D15):D15307. DOI:10.1029/2007JD008618. |
| Okada K, Kai KJ, 2004. Atmospheric mineral particles collected at Qira in the Taklamakan Desert, China. Atmospheric Environment, 38:6927-6935. |
| Olivier S, Schwikowski M, Brütsch S, et al., 2003. Glaciochemical investigation of an ice core from Belukha glacier, Siberian Altai. Geophysical Research Letters, 30(19):2019. DOI:10.1029/2003GL018290. |
| Paoletti L, De Berardis B, Diociaiuti M, 2002. Physico-chemical characterisation of the inhalable particulate matter(PM10) in an urban area:An analysis of the seasonal trend. Science of the Total Environment, 292(3):265-275. |
| Querol X, Alastuey A, Puicercus JA, et al., 1998. Seasonal evolution of suspended particles around a large coal-fired power station:chemical characterization. Atmospheric Environment, 32:719-731. |
| Raizenne M, Neas LM, Damokosh AL, et al., 1996. The effects of acid aerosols on North American children:pulmonary function.Environment Health Perspectives, 104:506-514. |
| Ramanathan V, Ramana MV, Roberts G, et al., 2007. Warming trends in Asia amplified by brown cloud solar absorption. Nature, 448:575-578. DOI:10.1038/nature06019. |
| Reid EA, Reid JS, Meier MM, et al., 2003. Characterization of African dust transport to Puerto Rica by individual particle and size segregated bulk analysis. Journal of Geophysical Research, 108(D19):8591. DOI:10.1029/2002JD002935. |
| Schwartz SE, Andreae MO, 1996. Uncertainty in climate change caused by aerosols. Science, 272(5265):1121-1122. DOI:10.1126/science.272.5265.1121. |
| Srivastava A, Jain V, Srivastava A, 2009. SEM-EDX analysis of various sizes aerosols in Delhi India. Environmental Monitoring and Assessment, 150:405-416. |
| Sun J, Qin D, Mayewski PA, et al., 1998. Soluble species in aerosol and snow and their relationship at Glacier 1, Tien Shan, China.Journal of Geophysical Research, 103(D21):28021-28028. |
| Sun Y, Zhuang G, Wang Y, et al., 2004. The air-born particulate pollution in Beijing-concentration, composition, distribution and sources. Atmospheric Environment, 38:5991-6004. |
| Verma SK, Deb MK, Suzuki Y, et al., 2010. Ion chemistry and source identification of coarse and fine aerosols in an urban area of eastern central India. Atmospheric Environment, 95:65-76. |
| Wake CP, Mayewski PA, et al., 1990. A review of Central Asian glaciochemical data. Annals of Glaciology, 14:301-306. |
| Wang Y, Zhuang G, Tang A, et al., 2005. The ion chemistry and the source of PM2.5 aerosol in Beijing. Atmospheric Environment, 39(21):3771-3784. |
| Wang Y, Zhuang G, Zhang X, et al., 2006. The ion chemistry, seasonal cycle, and sources of PM2.5 and TSP aerosol in Shanghai. Atmospheric Environment, 40:2935-2952. |
| Wang ZB, Xu JZ, Yu GM, et al., 2013. The characteristics of soluble ions in PM2.5 aerosol over the Qilian Shan Station of glaciology and ecologic environment. Journal of Glaciology and Geocryology, 35(2):336-344. |
| Williams MW, Tonnessen KA, Melack JM, et al., 1992. Sources and spatial variation of the chemical composition of snow in Tien Shan, China. Annals of Glaciology, 16:25-37. |
| Wolff EW, 1996. The record of aerosol deposited species in ice core, and problem of interpretation. In:Wolff EW, Bales R(eds.). Chemical Exchange between the Atmosphere and Polar Snow. New York:Springer, pp. 1-17. |
| Wu D, Tie X, Deng X, 2006. Chemical characterizations of soluble aerosols in southern China. Chemosphere, 64:749-757. |
| Xiao H, Liu C, 2004. Chemical characteristics of water soluble components in TSP over Guiyang, SW China, 2003. Atmospheric Environment, 38:6297-6306. |
| Yao X, Chan CK, Fang M, et al., 2002. The water-soluble ionic composition of PM2.5 in Shanghai and Beijing, China. Atmospheric Environment, 36:4223-4234. |
| Zhang K, Li Z, Wang F, et al., 2008. Soluble mineral dusts in aerosol and surface snow on the Glacier No. 1 at the headwaters of Ürümqi River, east Tianshan Mountains:Characteristics and their interrelation-taking calcium and magnesium as examples.Journal of Glaciology and Geocryology, 31(1):113-118. |
| Zhang XY, Edwards R, 2011. Anthropogenic sulfate and nitrate signals in snow from Glacier of Mt. Bogda, Eastern Tianshan.Journal of Earth Science, 22(4):490-502. |
| Zhang XY, Li ZQ, Wang FT, et al., 2012. Chemistry and environmental significance of snow on Glacier No. 72, Mt. Tumur, Tianshan Mountains, Central Asia. Scientia Geographica Scinica, 32(5):636-641. |
| Zhao SH, Li ZQ, Zhou P, 2011. Ion chemistry and individual particle analysis of atmospheric aerosols over Mt. Bogda of eastern Tianshan Mountains, Central Asia. Environmental Monitoring and Assessment, 180:409-426. |
| Zhao ZP, Li ZQ, 2004. Determination of soluble ions in atmospheric aerosol by ion chromatography. Modern Scientific Instrument, 5:46-49. |