Article Information
- GuangSheng Liu, GenXu Wang. 2016.
- Influence of short-term experimental warming on heat-water processes of the active layer in a swamp meadow ecosystem of the Qinghai-Tibet Plateau
- Sciences in Cold and Arid Regions, 8(2): 125-134
- http://dx.doi.org/10.3724/SP.J.1226.2016.00125
Article History
- Received: July 27, 2015
- Accepted: November 19, 2015
2. Key Laboratory of Mountain Surface Processes and Ecological Regulation, Institute of Mountain Hazards and Environment, Chinese Academy of Sciences, Chengdu, Sichuan 610041, China
1 Introduction
IPCC(2013)projected that mean global temperature would increase 1.8-4.0 ℃ for the 21st century. The rate of temperature increase in high latitude and altitude regions would be even larger(Thomas et al., 2004). The Qinghai-Tibet Plateau(QTP)houses the greatest portion of high altitude permafrost in the world(Zhou et al., 2000) and is extremely sensitive to global warming. The mean annual temperature increased at approximately 0.21 ℃/decade over the past 50 years at QTP(Liu and Chen, 2000),which exceeds the Northern Hemisphere and the same latitudinal zone during the same period(IPCC,2013).
Climate warming significantly influences permafrost,active layer conditions and seasonal frozen soils and ,as a result,alpine swamp meadow ecosystem stability(Osterkamp and Lachenbruch, 1990; Jorgenson et al., 2001; Nelson et al., 2003; Walker et al., 2003). The influence of a changing climate on permafrost,active layer thermal regime, and vegetation,may activate,through complex mechanisms,both negative and positive feedbacks related to global warming(Walker et al., 2003; Chapin et al., 2005). The QTP's ecosystem has experienced a loss of vegetation,glacial ablation,permafrost degradation and the disappearance of wetl and s and lakes during the last 30 years in response to a warmer climate(Wang et al., 2007).
Soil heat-water processes reflect the spatiotemporal distribution of soil temperature(heat) and moisture(dry vs. wet),thereby constituting an extremely important component in the energy and water cycles of the permafrost soil-atmosphere system(Li et al., 2002; Hu et al., 2009). These cycles affect the soil water and heat transfer processes and water hosting condition, and would also be key to alpine ecosystem stability and could have an important feedback effect on global climate(Woo and Winter, 1993; Carey and Woo, 1999; Zhang et al., 2003). Transfer in energy and water balance,accompanied with the response of alpine frost ecosystems to global climate change,would be likely reflected by changes in water content and the associated heat of frozen soil. Meanwhile,some monitoring of the soil heat-water processes have been performed in the QTP(Zhao et al., 2000; Wu et al., 2003; Wang et al., 2007)in recent years, and the studies illustrate the response of freezing-thawing processes to a cold region ecological environment. Wang et al.(2007)showed that moisture in the active layer in a permafrost region had an important influence on water cycling and the growth of meadow vegetation. Investigations in sub-arctic Canada and Alaska showed that climate changes led to an increase in topsoil water content in the permafrost regions(Jorgenson et al., 2001; Turetsky et al., 2002).
Therefore,underst and ing the laws governing variations in soil moisture and associated temperature of the alpine swamp meadow ecosystem is important in underst and ing regional variations in water and heat cycling arising from global changes. For this reason,an open top chamber(OTC)was adopted to simulate global warming. The influence of short-term experimental warming on heat-water processes of the active layer in an alpine swamp meadow ecosystem of the Qinghai-Tibet Plateau was analyzed through data sets under different manipulations over a complete year. The purpose of this study is to analyze the response of the hydrologic and thermal regime to plot-scale experimental warming at a typical alpine swamp meadow ecosystem underlain by permafrost in QTP.
2 Materials and methodology 2.1 Study areaThe Fenghuoshan permafrost region on the Qinghai-Tibet Plateau(34°40'N-34°48'N,92°50'E- 93°03'E),located in the upper watershed of the Zuomo Xikong River,a tributary of the Yangtze River,was chosen as the system of study. The region covers a total area of 127.63 km2 at elevations ranging from 4,680 to 5,360 m,belonging to an arid climate area and without glacial or multiyear snow-pack. The climate is cold and dry. The mean annual(1973-2005)air temperature,extreme maximum air temperature,extreme minimum air temperature are −5.2,23.2 and −37.7 ℃ ,respectively. The mean annual precipitation is 290.9 mm,80% of which falls during the growing season(from May to September). The mean annual evaporation is 1,316.9 mm. The mean annual ground temperature is −1.5℃ to −4.0 ℃(Wang et al.,2008),the permafrost thickness ranges from 50 m to 120 m and the active layer thickness is in the range of 0.8 m to 2.5 m. Additionally,these areas belong to an alpine meadow system which are dominated by plant species such as Kobresia tibetica Maximowicz,Stipa aliena Keng and Festuca spp.. The main soil type is alpine meadow soil(Table 1), and the parent material is mostly quaternary sediment,which includes the weathering material of metamorphic rock and intermediate intrusive rock(Wang et al.,2008).
| Soil profile(cm) | Bulk density(g/cm3) | Granularity(%) | Organic matter(%) | Available nitrogen(g/kg) | |
| >0.05 mm | <0.002 mm | ||||
| 0-10 | 0.83(±0.11) | 47.77 | 11.55 | 8.75(±2.20) | 112.0(±7.6) |
| 10-20 | 0.94(±0.21) | 50.94 | 11.58 | 4.32(±1.30) | 97.0(±4.4) |
| 20-30 | 1.19(±0.12) | 47.96 | 12.94 | 2.46(±2.10) | 23.0(±5.3) |
The OTC is an experimental warming structure first used by the International Tundra Experiment(ITEX)to study the influence of global warming on high altitude and latitude region ecosystems(Hollister and Webber, 2000).
The experimental plots have almost identical vegetation coverage(90%),vegetation type and terrain. Vegetation and soil conditions were classified prior to the onset of the manipulation(Table 1). The results show similar characteristics between all plots where,no significant correlation(p>0.4)was found between the three plots for any physical and chemical characteristics. The vegetation conditions of three plots were all under non-degraded status, and were similar to each other.
Two OTCs were made of 8 mm thick PMMA fiber material,with a top and basal area of 1.5m×1.5m and a height of 1.7 m. The base was embedded in the soil at a depth of 0.3 m. In order to gain a higher rate of temperature increase,one of the OTCs(OTC-1)included a partial closed top manipulation,through a 0.6 m diameter hole on the top. This type of OTC was used in the study of Havstrom et al.(1993)in subarctic(Abisko) and high-arctic sites(Svalbard). Additionally,the other OTC(OTC-2)represents a traditional open top chamber that has a complete open top manipulation. The control plot,kept the original state with no change. The experiment aimed to include two levels warming,with a mean annual air temperature of 3-6 ℃(OTC-1) and 1-3 ℃(OTC-2)warmer than the control.
2.2.2 Layout of the observational experimentEach manipulation housed a pair of 1.2 m deep soil water and temperature observation wells,five soil moisture and temperature sensors were located at depths of 0.05,0.20,0.40,0.65, and 1.20 m,respectively. Soil moisture was determined by frequency domain reflectometry(FDR),using a calibrated soil moisture sensor equipped with a Theta-probe(Hollend Eijkelammp Co. Giesbeek). Soil moisture was derived from changes in the soil's dielectric constant that was converted to a millivolt signal with an accuracy of ±2%. It should be noted that the soil volume moisture measured by FDR is the unfrozen soil moisture. Soil temperature was monitored using a thermal resistance sensor sensitive to temperature changes in the range of −40 ℃ to 50 ℃,with an overall system precision of ±0.02 ℃.
The thermal hygrometer was placed at 80-cm height above the alpine swamp meadow to measure atmospheric temperature and humidity. All of the probes were connected to a Campbell CR1000 data logger,developed by Campbell Scientific Ltd.. The frequency of data sample was 30 min, and the data set was collected over a one-year period from November 1,2007 to December 31,2008.
The aboveground biomass under different manipulations was sampled during the growing season by clipping the vegetation to ground level in 0.1m×0.1m subplots. Samples were dried for 72 hours at 55 ℃ and then weighed.
2.2.3 Data analysisThe mean unfrozen moisture storage was calculated by:
$${\theta _m} = \Sigma {\theta _i} \cdot T{h_i}$$ where,θi and Thiare the soil moisture content and the represent thickness of soil at depths of 0.05,0.20,0.40,0.65, and 1.20 m,respectively. For example,the represent thickness at 0.05 m depth is 0.1 m(0-0.1 m).In order to describe the thermal regime under different manipulations,some parameters were computed(Guglielmin et al., 2008):
1)The number of isothermal days,during which all the hourly measuring temperature ranges only between ±0.5 ℃,indicating that the energy in the soil is consumed to change the water phase both during the freezing and thawing process,when latent heat exchange produces the "zero curtain".
2)The number of frozen days,during which all the hourly measuring temperatures are negative and at least one is colder than −0.5 ℃,indicating that the soil profile is frozen.
3)The number of thawed days,during which all the hourly measuring temperatures are positive and at least one is warmer than −0.5 ℃,indicating that the soil profile is in a liquid state.
4)The number of freeze-thaw days,during which there are both negative and positive temperatures and at least one value is greater than ±0.5 ℃,indicating that freeze-thaw cycles occur.
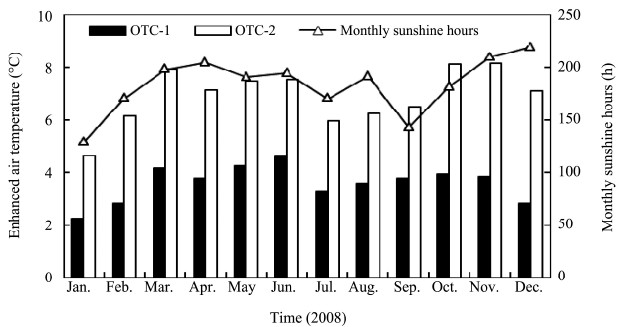
3 Results 3.1 Experimental warming effects of OTCsMean annual air temperatures(2008)under OTC-1 and OTC-2 manipulations were 6.7 ℃ and 3.5 ℃ higher than the control,respectively(Figure 1). This almost overlaps with the 1.8-4.0℃ increasing temperature range predicted by IPCC(2013)using Global/General circulation model. Air temperatures observed inside the OTCs have typically been 0.5-3.0 ℃ warmer than outside(Marion et al.,1997),which is similar with OTCs.
|
| Figure 1 Relationship between increasing monthlyair temperature and sunshine hours under different manipulations |
At the same time,the maximum monthly air temperature of OTC-1 and OTC-2 were 9.2 ℃ and 4.3 ℃ warmer than the control,respectively. However,the minimum monthly air temperature of OTC-1 and OTC-2 were just 4.7 and 1.7 ℃ warmer than the control,respectively(Figure 1). These results are different from other results in that the increasing rate of summer is larger than that of winter(Marion et al.,1997). These results are mainly due to variation in sunshine hours,which is unique to the climate of QTP and differs from other regions previously studied(Figure 1).
There was significant difference(p <0.001)in the above ground biomass between OTCs and the control(Table 2). The aboveground biomass of OTC-1 and OTC-2 were 1.57 and 2.11 times of the control,respectively,in the plant-growing period. OTCs improve the microclimate environment of the alpine swamp meadow ecosystem and fulfill the energy need of the vegetation,in favor of growth and development of the vegetation,thus causing an increase in aboveground biomass. Moreover,protection from wind may play a more important role than temperature in providing a favorable environment for plant growth within OTCs(Marion et al.,1997). This is consistent with results from previous studies(Li et al., 2004)which showed that the biomass increases in short-term experimental warming. Besides,lower biomass of OTC-1 than OTC-2 is due to drought treatment to OTC-1 and extreme experimental warming.
| Manipulations | Nov. 7 | May 8 | Jun. 8 | Jul. 8 | Aug. 8 | Sep. 8 |
| Control | 378.74 | 369.95 | 543.95 | 684.33 | 748.89 | 693.41 |
| OTC-2 | 952.33 | 1,030.26 | 1,120.06 | 1,324.07 | 1,468.89 | 1,335.35 |
| OTC-1 | 697.74 | 719.42 | 857.28 | 1,060.20 | 1,166.23 | 860.21 |
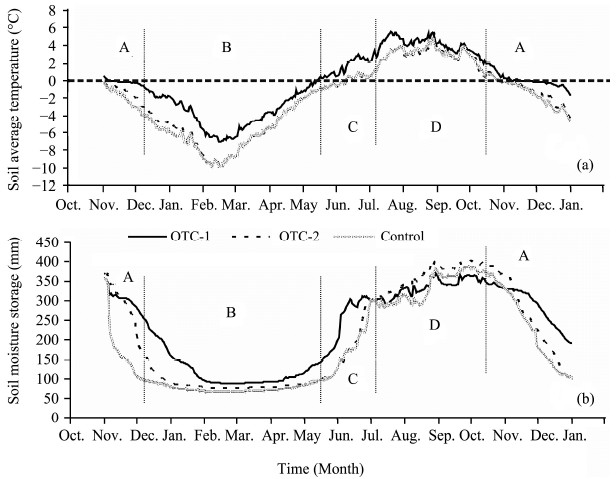
As presented in Figure 2,the coupled changes between soil moisture and temperature occurring over the year in the active layer can be divided into four periods based on freeze-thaw states of the permafrost soil(Osterkamp and Romanovsky, 1997; Wang et al., 2007; Hu et al., 2009):
|
| Figure 2 Mean soil temperature (a) and total unfrozen moisture storage (b) of the active layers (0-1.20 m) under OTC-1, OTC-2 and the control manipulations |
1)The freezing process period(A)-- from mid-October to early December,when the active layer is in the process of freezing,which shows a decrease of the total unfrozen moisture storage from 350-370 mm to 70-90 mm;
2)The entirely frozen period(B)-- from mid-December to mid-May,when the active layer is in a fully frozen state and the total unfrozen moisture storage remains at a constant level in 70-90 mm;
3)The thawing process period(C)-- from mid-May to early July,when the active layer is in the process of thawing, and the total unfrozen moisture storage increases from 70-90 mm to the vertex value;
4)The fully thawed period(D)-- from early July to mid-October,when the entire soil layer(0-1.2 m)is in a thawed state, and the total unfrozen moisture storage fluctuates from 300 mm to 400 mm.
Mean annual ground temperatures(2008)of OTC-1,OTC-2 and the control were −0.05,−1.64 and −1.71℃,respectively(Figure 2a). Mean annual soil temperatures(2008)of OTC-1 were 3.49,2.30,1.46,1.34 and 0.45 ℃ warmer than the control for the 0.05,0.20,0.40,0.65 and 1.20 m soil depths,respectively. However,the differences between OTC-2 and the control were −0.07,0.24,0.22,0.20 and 0.41 ℃ ,respectively,which were inconsistent with OTC-1. Clearly,there was a significant difference between the mean ground temperatures of OTC-1 and the control manipulation; however,there is little difference between OTC-2 and the control manipulations.
There were some differences between the total unfrozen moisture storage(0-1.20 m)under the OTC-1,OTC-2 and the control manipulations(Figure 2b). The mean annual unfrozen moisture storage(2008)of OTC-1,OTC-2 and the control were 230.7,212.2, and 195.4 mm,respectively. These are mainly due to much longer duration of fully thawed period in OTCs and the observed soil moisture was unfrozen water,which lead to relatively high value of unfrozen moisture storage in OTCs.
3.3 Thermal regime 3.3.1 Soil thermal conditionResults show significant differences in the number of isothermal days,frozen days,thawed days and freeze-thaw days at different depths under different manipulations(Table 3).
| Depth (m) | Isothermal days | Frozen days | Thawed days | Freeze-thaw days | |||||||||||
| OTC-1 | OTC-2 | Control | OTC-1 | OTC-2 | Control | OTC-1 | OTC-2 | Control | OTC-1 | OTC-2 | Control | ||||
| 0.05 | 11 | 16 | 12 | 107 | 189 | 188 | 167 | 147 | 141 | 81 | 14 | 25 | |||
| 0.20 | 44 | 52 | 25 | 148 | 177 | 192 | 172 | 137 | 134 | 2 | 0 | 15 | |||
| 0.40 | 73 | 72 | 72 | 149 | 174 | 197 | 143 | 110 | 96 | 1 | 0 | 1 | |||
| 0.65 | 86 | 70 | 61 | 158 | 213 | 220 | 121 | 81 | 85 | 1 | 2 | 0 | |||
| 1.20 | 138 | 72 | 109 | 177 | 208 | 210 | 51 | 85 | 47 | 0 | 1 | 0 | |||
In the ground surface(0.05 cm),the isothermal days mainly appeared in May and October in OTC-2 and the control,however,appeared only in November in OTC-1,showing that "zero curtain" only appeared in the freezing process in OTC-1. It was due to greater air temperature fluctuation in OTC-1,which led to severe freeze-thaw cycle on the ground surface. At a soil depth of 0.2 m,the isothermal days of OTC-1 mainly appeared in November,but they have appeared in May,October and November in OTC-2 and the control. The isothermal days of OTCs were more than the control,due to comparably higher water conditions and vegetation conditions in OTCs(Table 2).
With an increase of soil depths,frozen days of all manipulations generally increased,whereas thawed days show a converse,decreasing trend. The frozen days of OTC-1 was significantly less than the control,whereas OTC-2 is only slightly less than the control. This indicated that frozen days decrease with temperature increase. In contrast,the thawed days of OTC-1 was significantly more than the control,whereas OTC-2 was only slightly more than the control,indicating that thawed days increase with increasing air temperature. Moreover,the freeze-thaw days near the surface appeared more frequently in OTC-1 than in OTC-2 and the control. The freeze-thaw days appeared only in April and May in OTC-2 and the control,but also appeared in November in OTC-1 due to greater air temperature fluctuation(Guglielmin et al.,2008).
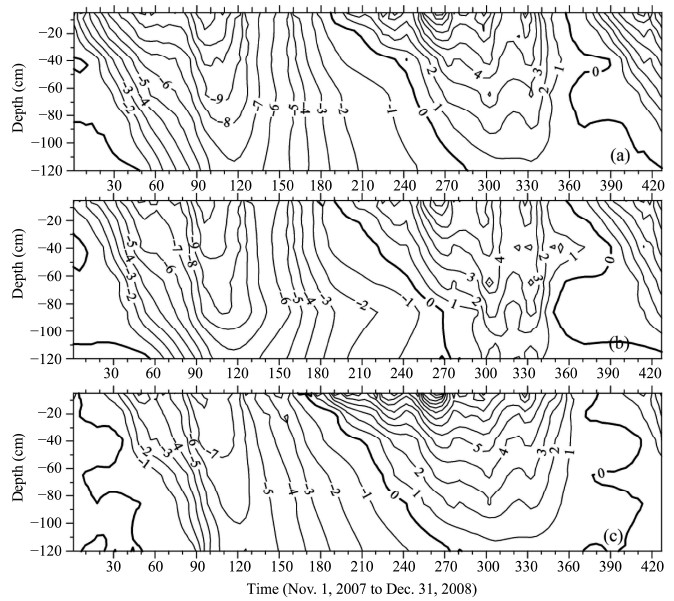
3.3.2 Soil temperature variation processThe contour chart clearly shows the duration of freeze-thawing,frozen depth,the extension within a certain period and freezing-thawing front movement(Figure 3). With the periodic cycle of solar radiation in one year,soil heat-water processes achieve their own related cycles.
|
| Figure 3 Thermal regime under the control (a), OTC-2 (b) and OTC-1 (c) manipulations |
As presented in Figure 3,in the freezing process period(A),the dates of active layers beginning to freeze at different depths of OTCs were earlier than the control,but all coincide in late October and early November. The period when the freezing front moved from the surface to 0.55 m depth in OTC-1,OTC-2 and the control were 20,25-30 and 30 days,respectively, and the duration of the whole soil profile becoming entirely frozen are 40,67 and 70 days,respectively. This indicates that the durations of freezing process shorten and the freezing front moving rate increased with temperature increase.
In the entirely frozen period(B),days it took for the temperature to decrease from −2 ℃ to −6 ℃ in the shallow layer(0.05 m)in OTC-1,OTC-2 and the control were 43,25 and 20 days,respectively,indicating that rate of temperature change in OTCs were lower than the control. In contrast,days it took for the temperature to decrease from −1 ℃ to −5 ℃ in the deeper layer(1.2 m)in OTC-1,OTC-2 and the control were 36,29 and 18 days,respectively,indicating that rate of temperature change in OTCs were higher than the control. Meanwhile,the areas encompassed by the 0 ℃ isothermal were OTC-1 < OTC-2 < Control,indicating that entirely frozen durations decreased with temperature increase.
In the thawing process period(C),the dates of soil layers(0-1.2 m)beginning to thaw at different depths under different manipulations were disperse,ranged from May to August, and were delayed with the increase of soil depth. With the temperature increase,the beginning of thawing days moved ahead,but the differences in duration of thawing process were minor.
In the fully thawed period(D),contrary to the entirely frozen period,rate of temperature change in OTCs were higher than the control in shallow layers and trended lower in deeper layers. Meanwhile,the areas encompassed by the 0 ℃ isotherm of OTC-1 were larger than those of OTC-2 and the control,indicating that duration of fully thawed period extended with temperature increase.
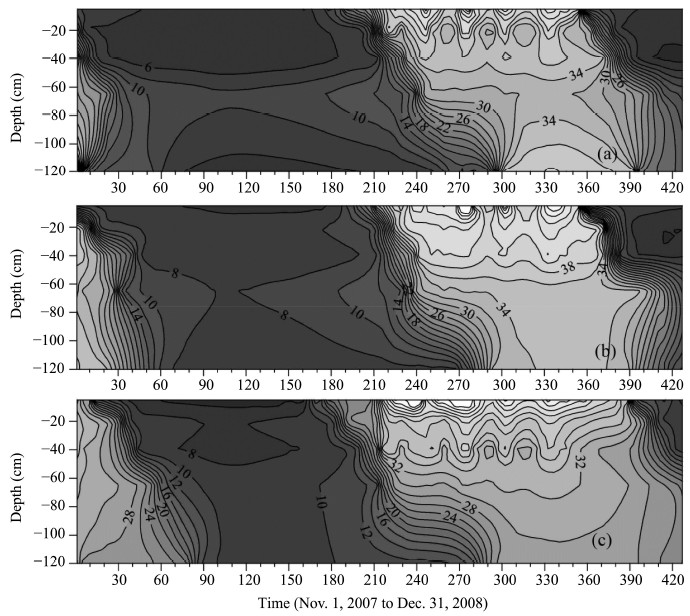
3.4 Moisture distributionAs presented in Figure 4,in the fully thawed period(D),there were significant differences between moisture distribution in the active layers of OTC-1,OTC-2 and the control. In OTC-1 and OTC-2,soil moisture decreased with the depth increase,varying from 46% and 43% on the ground surface to 28% and 33% at 1.2 m soil depth,respectively. The decreasing rate of OTC-1 was larger than that OTC-2. However,the soil moisture distribution characteristic of the control was similar to the alpine meadow ecosystems study result(Wang et al., 2008; Hu et al., 2009),which showed a dry layer at 0.65 m depth and two higher moisture aquifers at the ground surface and 1.1 m depth. The existence of a middle dry layer is because the upper layer is markedly influenced by precipitation,which provides a water source for the upper soil; the lower layer is mainly influenced by a watertight layer near the bottom of an active layer where water migrates downwards with thawing soil and concentrates relatively. Hence,the middle layer is a dry belt where summer precipitation cannot infiltrate(Zhao et al., 2000).
|
| Figure 4 Soil moisture regime under the control (a), OTC-2 (b) and OTC-1 (c) manipulations |
In the freezing process period(A) and the thawing process period(C),relative to soil moisture distribution in the period(D),the change rate of soil moisture in OTCs decreased with soil depth increase. Furthermore,soil moisture showed fluctuating change in the shallow layer due to the impact of air temperature and precipitation.
In the entirely frozen period(B),the unfrozen soil moisture under different manipulations was all about 10%. The unfrozen soil moisture in OTC-1 increased with soil depth increase,ranging from 5% to 11%.
4 DiscussionThere is a growing body of research in water and heat cycles in permafrost regions. Some monitoring of the soil heat-water processes have been performed in the QTP in recent years(Zhao et al., 2000; Wu et al., 2002; Wang et al., 2008). These studies illustrate soil water circulation in the active layer increased as vegetation cover decreased. Besides,significant response of the alpine frost ecosystems upon the QTP to global climate change would have an important feedback effect on global climate(Zhang et al., 2003). Therefore,further observations and studies are required to quantify the heat-water transfer processes in typical alpine swamp meadow ecosystems and its feedback that occur between climate change and changes to vegetation.
4.1 Effect of short-term experimental warming on soil temperatureThere was a significant difference between mean ground temperatures of OTC-1 and the control manipulation; however,there is little difference between OTC-2 and the control manipulations. The depressed soil temperature in OTC was also found in the Salix site at Alex and ra Fjord(Marion et al.,1997). First,it was because OTC-2 has no inclined sides,which dissipates heat through the top by free convection aided by the forced convective flow of the wind. Moreover,they were likely due to vegetation and ground shading, and relative higher moisture in OTC-2 and these may simply reflect the complex physics of energy balance within chambers. Finally,the vegetation condition of OTC-2 was better than the control(Table 2). As reported by Wang et al.(2008) and Hu et al.(2009),vegetation has a warming effect on the freezing process and entirely frozen period; and has a cooling effect on the thawing process and fully thawed period,which led to higher soil temperature in cold season and lower soil temperature in warm season in OTC-2.
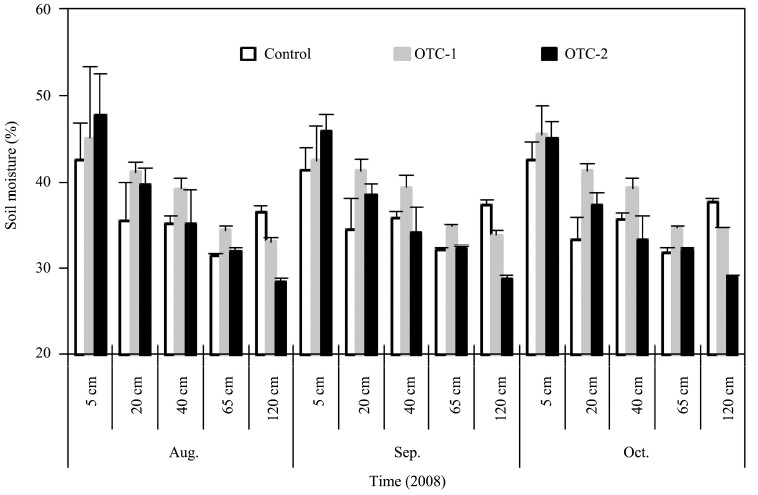
4.2 Effect of short-term experimental warming on soil moistureAs presented in Figure 5,on the ground surface(5 cm),soil moisture was shown as OTC-1 > OTC-2 > control in the fully thawed period. In addition,at 0.20-0.65 m depth,soil moisture was shown as OTC-2 > OTC-1 > control. Experimental warming led to an increase in topsoil water content. Model projections suggest evapotranspiration may increase due to climate warming,resulting in reduce near-surface soil moisture and greater aridity in water-limited systems around the world(Komescu et al.,1998; IPCC,2013). This is contrary to the results of this study.
|
| Figure 5 Active layer soil moisture regime in the fully thawed period under different warming manipulations in 2008 |
Studies on hydrological processes in the Mackenzie Global Energy and Water Cycle Experiment(Rouse,2000) and a North American discontinuous permafrost region wetl and(Carey and Woo, 1999; Oechel et al., 2000)show that in discontinuous permafrost regions,climate change has led to an increase in topsoil moisture content of the permafrost region(Jorgenson et al., 2001; Turetsky et al., 2002). However,studies in other regions(Sweden)have reported reduced topsoil moisture content and even drought(Christensen et al., 2004). Zavaleta et al.(2003)found that interactions between warming and the dominant biota in a grassl and ecosystem produced the reverse effect. Simulated warming increased spring ground surface moisture by 5%-10% under both ambient and elevated CO2. Bremer et al.(1996)reported that surface soil moisture was consistently higher than other treatments under elevated CO2 chambers,which is similar to OTCs,tends to be lowest early in the season and then became higher than that of outside. These trends are consistent with our research results,due to evapotranspiration difference.
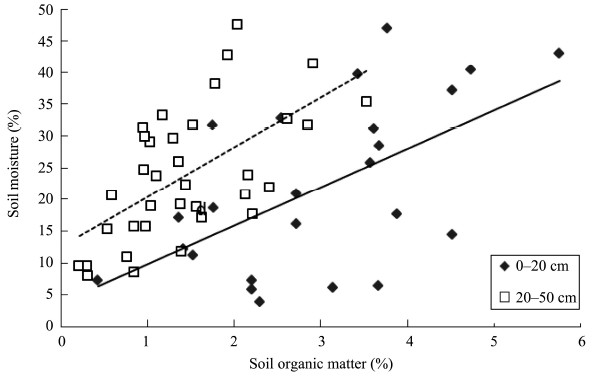
Moreover,experimental warming led to an increase in above ground biomass(Table 2). This means better vegetation conditions,thicker root horizons and more soil organic matter content in OTCs. As presented in Figure 6,the soil moisture in the ground surface increase with the soil organic matter content increase. Due to poorly drained swamp meadow ecosystem with higher organic matter content and thicker root horizons,higher water binding capacity occurs in OTCs. Therefore,experimental warming led to an increase in topsoil water content due to poorly drained swamp meadow ecosystem with higher organic matter content and thicker root horizons.
|
| Figure 6 The relationships between soil organic matter content and soil moisture on the ground surface |
At a depth of 1.20 m,the soil moisture appeared to be the control > OTC-2 > OTC-1. Experiments of Fukuda et al.(1980)indicated that the amount of migrated moisture in the freezing front has a close relationship with the freezing rate of soils. The duration of freezing process and the frozen period became shorter with a temperature increase(Figure 3,Table 3),so less water migrates to the deeper soil layer,which led to higher moisture in the control.
These results show that the soil moisture distribution in the profile changes significantly with increasing air temperature. Short-term experimental warming led to an increase in topsoil water content and a deep layer moisture loss,although the unfrozen soil moisture storage increased.
5 ConclusionsThis study describes the soil thermal regime and moisture distribution in an alpine swamp meadow ecosystem due to short-term experimental warming. Air temperatures(2008)of OTC-1 and OTC-2 were 6.70 and 3.48 ℃ warmer than the control,respectively. Rising temperature promotes plant growth and development,thus making a significantly higher aboveground biomass in OTCs.
The dates marking the beginning of active layer freezing were postponed and the dates marking the beginning of thawing occurred earlier,shortening the durations of entirely frozen period and frozen days; the fully thawed period extended and the thawed days increased.
OTCs soil moisture decreased with the soil depth decrease; however,there was an obviously middle dry aquifer of the control,which is familiar in QTP. Moreover,experimental warming lead to an increase in topsoil water content due to poorly drained swamp meadow ecosystem with higher organic matter content and thicker root horizons. The results of this study will have some contributions to alpine cold ecosystem water-heat process and water cycle under climate change.
Acknowledgments: This study was funded by The Natural Science foundation of China(No. 40925002) and The Natural Science foundation of Fujian Province(No. 2015J05114). The authors thank the anonymous reviewers for their fruitful comments, and help in improving the presentation of this research.| Bremer DJ, Ham JM, Owensby CE, 1996. Effect of elevated atmospheric carbon dioxide and open-top chambers on transpiration in tallgrass prairie. Journal of Environmental Quality, 25:691-701. DOI:10.2134/jeq1996.00472425002500040008x. |
| Carey SK, Woo MK, 1999. Hydrology of two slopes in subarctic Yukon, Canada. Hydrological Processes, 13:2549-2562. DOI:10.1002/(SICI)1099-1085. |
| Chapin Ⅲ FS, Sturm M, Serreze MC, et al., 2005. Role of land-surface changes in Arctic summer warming. Science, 310:657-660. DOI:10.1029/2003GL018680. |
| Christensen TR, Johansson T, Kerman HJ, et al., 2004. Thawing subarctic permafrost:effects on vegetation and methane emissions.Geophysical Research Letters, 31:L04501.DOI:10.1029/2003GL018680. |
| Fukuda M, Orhun A, Luthin JN, 1980. Experimental studies of coupled heat and moisture transfer in soils during freezing.Cold Region Science and Technology, 9(3):223-232. DOI:10.1016/0165-30232X(80)90028-2. |
| Guglielmin M, Evans CE, Cannone N, 2008. Active layer thermal regime under different vegetation conditions in permafrost areas.A case study at Signy Island(Maritime Antarctica). Geoderma, 144:74-85. DOI:10.1016/j.geoderma.2007.10.010. |
| Havstrom M, Callaghan TV, Jonasson S, 1993. Differential growth responses of Cassiope tetragona, an arctic dwarf-shrub, to environmental perturbations among three contrasting high and subarctic sites. Oikos, 66:389-402. DOI:10.2307/3544933. |
| Hollister RD, Webber PJ, 2000. Biotic validation of small open-top chambers in a tundra ecosystem. Global Change Biology, 6:835-842. DOI:10.1046/j.1365-2486.2000.00363.x. |
| Hu HC, Wang GX, Liu GS, 2009. Influences of alpine ecosystem degradation on soil temperature in the freezing-thawing process on Qinghai-Tibet Plateau. Environmental Geology, 57(6):1391-1397. DOI:10.1007/s00254-008-1417-7. |
| IPCC, 2013. Climate Change 2013:The Physical Science Basis.Cambridge, United Kingdom and New York:Cambridge University Press. |
| Jorgenson MT, Racine CH, Walters JC, 2001. Permafrost degradation and ecological changes associated with a warming in central Alaska. Climatic Change, 48:551-579. DOI:10.1023/A:1005667424292. |
| Komescu AU, Eikan A, Oz S, 1998. Possible impact of climate change on soil moisture availability in the southwest Anatolia development project region(GAP):An analysis from an agricultural drought perspective. Climatic Change, 40:519-545.DOI:10.1023/A:1005349408201. |
| Li SX, Nan ZT, Zhao L, 2002. Impact of soil freezing and thawing process on thermal exchange between atmosphere and ground surface. Journal of Glaciology and Geocryology, 24(5):506-511. |
| Li YN, Zhao L, Zhao XQ, et al., 2004. Effects of a 5-year mimic temperature increase to the structure and productivity of Kobresia humilis meadow. Acta Agrestia Sinica, 12:236-239. |
| Liu XD, Chen BD, 2000. Climatic warming in the Tibetan Plateau during recent decades. International Journal of Climatology, 20:1729-1742. DOI:10.1002/1097-0088(20001130)20:14<1729:AID-JOC556>3.0.CO;2-Y. |
| Marion GM, Henry GHR, Freckman DW, 1997. Open-top designs for manipulating field temperatures in high-latitude ecosystems.Global Change Biology, 3(Supplement 1):20-32.DOI:10.1111/j.1365-2486.1997.gcb136.x. |
| Nelson FE, Lachenbruch AH, Woo MK, et al., 2003. Permafrost and changing climate. In:Proceedings of the Sixth International Conference on Permafrost, Beijing, China, pp.987-1005. |
| Oechel WC, Vourlitis GL, Hastings SJ, et al., 2000. Acclimation of ecosystem CO2 exchange in the Alaskan Arctic in response to decadal climate warming. Nature, 406:978-980. DOI:10.1038/35023137. |
| Osterkamp TE, Lachenbruch AH, 1990. Thermal regime of permafrost in Alaska and predicted global warming. Journal of Cold Regions Engineering, 4(1):38-42. DOI:10.1061/(ASCE)0887-381X(1990)4:1(38). |
| Osterkamp TE, Romanovsky VE, 1997. Freezing of active layer on the coastal plain of the Alaskan Arctic. Permafrost and Periglacial Processes, 8:23-44. DOI:10.1002/(SICI)1099-1530. |
| Rouse WR, 2000. Progress in hydrological research in the Mackenzie GEWEX study. Hydrological Processes, 14:1667-1685.DOI:10.1002/1099-1085. |
| Thomas D, Cameron A, Green GE, et al., 2004. Extinction risk from climate change. Nature, 427:145-148. DOI:10.1038/nature02121. |
| Turetsky MR, Kelman-Wieder R, Vitt DH, 2002. Boreal peatland C fluxes under varying permafrost regimes. Soil Biology and Biochemistry, 34:907-912. DOI:10.1016/S0038-0717(02) 00022-6. |
| Walker DA, Jia GJ, Epstein HE, et al., 2003. Vegetation-soil-thaw-depth relationships along a low arctic bioclimate gradient, Alaska:synthesis of information from the ATLAS studies. Permafrost and Periglacial Processes, 14:103-123. DOI:10.1002/ppp.452. |
| Wang GX, Li YS, Hu HC, et al., 2008. Synergistic effect of vegetation and air temperature changes on soil water content in alpine frost meadow soil in the permafrost region of Qinghai-Tibet. Hydrological Processes, 22:3310-3320. DOI:10.1002/hyp. |
| Wang GX, Li YS, Wang YB, et al., 2007. Typical alpine wetland system changes on the Qinghai-Tibet Plateau in recent 40 years.Acta Geographica Sinica, 62(5):481-491. |
| Woo MK, Winter TC, 1993. The role of permafrost and seasonal frost in the hydrology of northern wetlands in North America.Journal of Hydrology, 141:5-31. DOI:10.1016/0022-1694(93)90043-9. |
| Wu QB, Shen YP, Shi B, 2003. Relationship between frozen soil together with its water heat process and ecological environment in the Tibetan Plateau. Journal of Glaciology and Geocryology, 25(3):250-255. |
| Zavaleta ES, Thomas BD, Chiariello NR, et al., 2003. Plants reverse warming effect on ecosystem water balance. PNAS, 100:9892-9893. DOI:10.1073/pnas.1732012100. |
| Zhang YS, Ohata T, Kadota T, 2003. Land surface hydrological processes in the permafrost region of the eastern Tibetan Plateau.Journal of Hydrology, 283:41-56. DOI:10.1016/S0022-1694(03)00240-3. |
| Zhao L, Cheng GD, Li SX, et al., 2000. Thawing and freezing processes of active layer in Wudaoliang Region of Tibetan Plateau. Chinese Science Bulletin, 45(23):2181-2186. DOI:10.1007/BF02886326. |
| Zhou YW, Guo DX, Qiu GQ, et al., 2000. Geocryology in China.Beijing:Science Press, pp. 65-80. |
 2016, 8


