Article Information
- Jie Xue, JiaQiang Lei, DongWei Gui, JianPing Zhao, DongLei Mao, Jie Zhou. 2016.
- Synchronism of runoff response to climate change in Kaidu River Basin in Xinjiang, Northwest China
- Sciences in Cold and Arid Regions, 8(1): 82-94
- http://dx.doi.org/10.3724/SP.J.1226.2016.00082
Article History
- Received: June 9, 2015
- Accepted: September 14, 2015
2. Cele National Station of Observation and Research for Desert-Grassland Ecosystems, Cele, Xinjiang 848300, China;
3. Key Laboratory of Biogeography and Bioresource in Arid Zone, Chinese Academy of Sciences, Urumqi, Xinjiang 830011, China;
4. University of Chinese Academy of Sciences, Beijing 100049, China;
5. College of Mathematics and System Sciences, Xinjiang University, Urumqi, Xinjiang 830046, China
1 Introduction
Global warming has been observed at scales ranging from regional to global levels(IPCC,2014). Such change has largely influenced runoff generation and water cycle characteristics worldwide(e.g.,Li LH et al., 2010). More remarkable impacts on runoff may be discerned in arid and semi-arid regions where the runoff is formed in and descends from mountainous areas. The Tianshan Mountains consist of a large system of mountain ranges situated in Central Asia,where one of the primary arid zones in the world is located. The Tianshan Mountains divide the Xinjiang region of Northwest China into Southern and Northern parts, and the inl and rivers originating from the mountains provide essential water resources for maintaining the functions of local eco-environmental systems and human well-being. Under global climate change,the main hydro-meteorological factors including temperature,precipitation and runoff in inl and river watershed have experienced an increasing trend(Lan et al., 2007; Lan et al., 2011; Wang et al., 2011).
The Kaidu River,originating from the central section of the Tianshan Mountains,is a typical inl and river. The surface runoff of the river mainly forms in the Tianshan mountainous area with the mixing water sources from glacier meltwater,snowmelt, and rainfall(Li QH et al., 2011). In such an alpine region,glacier- and snowmelt water is controlled by temperature,which is a main contributor to the streamflows in spring,while glacial meltwater and rainfall in warm seasons are controllers of streamflows. The formation of runoff as the most important part of water resources is a quite complicated climatic-hydrological process, and its response to climate change is quite sensitive in the Kaidu Basin(Li QH et al., 2011; Chen,2014). Meanwhile,the shift from a warm and dry climate to a warm and humid climate in Xinjiang shows that climate factors(e.g.,temperature and precipitation)have had a significant impact on the change of runoff for the Kaidu River(Chen et al., 2006; Shi et al., 2007). Therefore,the study of runoff response to long-term climate change is likely to have essential implications for the further development of the region and its ability to adapt to the changing climate.
Since the upstream catchment of the Kaidu River Basin above the gauging station is not inhabited,the original natural environment for shaping the runoff generating process is still intact,providing an ideal location for investigating the impacts of climate change on the runoff. It is hypothesized that the runoff observed in the basin is basically the natural amount of runoff controlled by climatic factors rather than by human disturbance. Hence,an underst and ing of the qualitative and quantitative response patterns of runoff to the variations of climatic factors within a watershed is necessary.
Considerable research has focused on climate change and its potential effects on water resources systems in the Kaidu River Basin. Previous studies have also sought to explain the variations of the climatic factors and their impacts on runoff, and focused on analyzing the time-series patterns of the climatic factors and runoff as well as their statistical relationships(e.g.,Li QH et al., 2011; Zhang et al., 2014). However,an inside view on the synchronism of runoff change and climate changes has not yet identified change trends,abrupt change points, and periodicities among runoff,temperature, and precipitation. Therefore,this paper employs st and ardization curves,Kendall's W test,the sequential version of the Mann-Kendall test,wavelet power spectrum analysis, and R/S methods to comprehensively investigate the dynamic characteristics of both long-term historical records of climatic and hydrological data for the available time-series, and analyze the synchronism between runoff and climate change. It is hoped that this work will provide not only a better underst and ing of the relationship between climate change and runoff,but also have great theoretical and practical significance for the rational utilization of water resources and eco-environmental protection in the downstream areas of the Kaidu River.
2 Materials and methods 2.1 Study areaThe Kaidu River Basin is located in the central Tianshan Mountains in Xinjiang,at 42°14'N-43°21'N,82°58'E-86°05'E(Figure 1),covering a l and area of 18,827 km2 above the Dashankou hydrological station at an average elevation of 3,100 m a.s.l.(Zhang et al., 2014). The Kaidu River is one of the main inl and rivers lying on the south slope of the Tianshan Mountains. The river originates from the Hargat valley and the Jacsta valley on Sarming Mountain. The main stream flows through the Small-Urdus Basin and Bayanbulake grassl and , and finally discharges into Lake Bosten. Surface runoff is mainly generated by snow- and glacier-melt in the high elevations of the mountains, and by snowmelt as well as rainfall in the middle and lower parts of the mountains above Dashankou. There are only two gauge stations installed within the basin with long-term and accurate observation data; one is the meteorological station at Bayanbuluke at an elevation of 2,450 m a.s.l.,providing climatic data, and the other is the hydrological station at Dashankou at an elevation of 1,340 m a.s.l.,serving as the basin control station for measuring runoff data. Based on the available instrumental data,the average annual temperature and the extreme minimum temperature are −4.26 ℃ and −48.1 ℃,respectively. There are an average of 139.3 snow-cover days every year and the greatest average annual snow depth is 12 cm(Xu et al., 2010). The mean annual,summer, and autumn temperatures,as well as winter precipitation,significantly increased during the period of 1958-2007,with respective rates of +0.26 ℃/decade,+0.28 ℃/decade,+0.35 ℃/decade, and +1.34 mm/decade(Li QH et al., 2011).
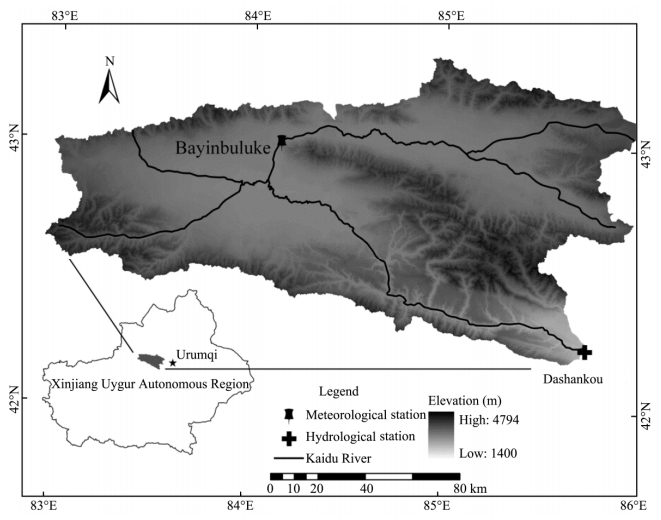 |
| Figure 1 Sketch map of the Kaidu River Basin |
Given the lack of gauge stations within the basin,only the meteorological station at Bayinbuluke and the hydrological station at Dashankou provide long-term meteorological parameters and runoff data. The records of meteorological parameters and runoff started in the late 1950s in the basin. In order to analyze the tendencies of climate change and runoff and the synchronism of their changes,the annual runoff data at the Dashankou hydrologic station, and annual mean air temperature and the annual precipitation data at the Bayinbuluke meteorological station from 1958 to 2012 were used in this study.
2.3 MethodsTo explore the synchronism of the runoff response to climate factors(temperature and precipitation),this study applied: a)data st and ardization and Kendall's W test to analyze the nonlinear change tendencies between temperature,precipitation, and runoff; b)the sequential version of the Mann-Kendall test to reveal any abrupt changes in these climatic-hydrological parameters; c)wavelet power spectrum analysis to explore the periodicities of the parameters; and d)R/S analysis to reveal the long-term memory characteristics among the parameters in the Kaidu River Basin.
2.3.1 Data st and ardizationMeasures for different variables with different scales and entities bring difficulties for comparative analysis. Therefore,it is necessary to convert the target variable values by means of a common dimensionless quantity. Statistically,If X1,X2,⋯,Xn are the samples of the r and om X, and its average $\bar X =(\Sigma _{i = 1}^n{X_i})/n$ and variance${S^2} = \Sigma _{i = 1}^n{({X_i} - \bar X)^2}/(n - 1)$are the unbiased estimations of the population distribution,the sample st and ardized equation is defined as:
| $z = \frac{{{X_i} - \bar X}}{S}$ | (1) |
where i=1,2,⋯,n. In a similar way,if a r and om Y is the lognormal distribution, and ln(Y)is the normal distribution,the st and ardized equation of the sample Y1,Y2,⋯,Yn is shown as:
| $z' = \frac{{\ln({Y_i})- \overline {\ln(Y)} }}{L}$ | (2) |
where i=1,2,⋯,n,$\overline {{\rm{ln}}\left(Y \right)} = [\Sigma _{i = 1}^n\ln({Y_i})]/n,$${L^2} = [\Sigma _{i = 1}^n{({\rm{ln}}({Y_i})- \overline {\ln \left(Y \right)})^2}]/\left({n - 1} \right)$.
The resulting data set,which has a mean value of 0,a st and ard deviation of 1, and values ranging between −1 and 1 by st and ardization,keeps the shape properties of the original data set(Ma,2000). Therefore,we may put data on the same scale and compare two or more data sets with different units. The temperature,precipitation, and runoff data used in this study were st and ardized before their multivariate analyses. Those data,which were either the normal distribution or the lognormal explored by histogram and normal distribution fitting,were st and ardized as per the above formulae and graphed for each combination,respectively. Whether each combination had the necessary consistency was visually apparent in both st and ardized curves.
2.3.2 Kendall's W testKendall's W test(i.e.,Kendall's coefficient of concordance,W),a non-parametric statistical test proposed by Kendall in 1955(Kendall,1955),was used to solve the testing for agreement among m sets of rankings of k objects(Schucany and Frawley, 1973). The coefficient of concordance W has been widely applied in medicine,sociology,natural science, and other fields(Legendre,2005; Xu et al., 2007; Li JS and Li JH,2008). This statistical test is used to measure the degree of agreement for consistency among variables, and the W value range should be [0,1]. The closer the W value is to 1,the higher the consistency. The formula is:
| $W = \frac{{\sum\limits_{j = 1}^k {R_j^2} -(\sum\limits_{j = 1}^k {R_j^2})/N}}{{{\raise0.5ex\hbox{$\scriptstyle 1$}\kern-0.1em/\kern-0.15em\lower0.25ex\hbox{$\scriptstyle {12}$}}{K^2}({N^3} - N)}}$ | (3) |
where N is the number of ranks of objects and K is the sets of rankings; and Rj st and s for the ranks assigned to the jth object(more information can be obtained in Kendall(1955)). The null hypothesis would be lack of consistency among the target variables(i.e.,in this paper,annual mean air temperature,total precipitation, and runoff). The test statistic ${\varphi ^2}$is a chi-square distribution with N-1degrees of freedom and is given as:
| ${\varphi ^2} = K(N - 1)W$ | (1) |
The null hypothesis is rejected at the 95% confidence level if ${\varphi ^2} > \varphi _{(0.05,N - 1)}^2,$ and vice versa.
2.3.3 The sequential version of the Mann-Kendall testThe sequential version of the Mann-Kendall test,proposed by Sneyers(1975),is a non-parametric test that falls under the class of rank tests and is very useful in analysis of,for example,abrupt climate changes(Li et al., 2007). The magnitudes of the sample xi(i=1,2,⋯,n)are compared by xj(j=1,2,⋯,i). The number of cases xi ≥ xj is counted and denoted by ri. The test statistic is shown as:
| ${t_i} = \sum\limits_1^i {{r_i}} \;\;(i = 2,3,\cdot \cdot \cdot,n)$ | (5) |
| ${r_i} = \left\{ \begin{array}{l}1,\;\;{x_i} \ge {x_j}\\0,\;\;{x_i} < {x_j}\end{array} \right.$ | (6) |
where ti is the normal distribution with the mean expressed as:
| $E(t)= \frac{{n(n - 1)}}{4}$ | (7) |
and variance as: $Var(ti)= \frac{{[i(i - 1)(2i + 5)]}}{{72}}$
The sequential values of the statistic UF(t)are given as:
| $UF(t)= \frac{{{t_i} - E(t)}}{{\sqrt {Var({t_i})} }}$ | (8) |
where UF(t)is the forward trend. In a similar way,the reverse data series of the sample xi and i=1,2,⋯,n is calculated as the same equation above,the so-called the backward trend UB(t).
A positive UF(t)indicates an upward trend,while a negative UF(t)denotes a downward trend. Meanwhile,UB(t)is similar to UF(t). If $\left| {UF\left(t \right)} \right| > {u_{1 - \alpha /2}}$ and ${u_{1 - \alpha /2}}$is the critical value of the st and ard normal distribution at the α significance level with a probability exceeding α/2,the null hypothesis is rejected,i.e.,the upward or downward trend is significant at the α level. When the forward and backward curves of the test statistics have an intersection point and the null hypothesis is accepted at the 0.05 significance level(in this paper,α is defined as 0.05),the critical point of change is at that period(Gerstengarbe and Werner, 1999; Yang and Tian, 2009).
2.3.4 Wavelet power spectrum analysisWavelet power spectrum analysis,by decomposing a time series into time-frequency space,can determine the primary modes of variability in time(Li QH et al., 2011), and is widely used to analyze localized variations of power in hydro-meteorological time series(Torrence and Compo, 1998). Because the continuous wavelet transform(CWT)can be well localized in time-frequency space,here the CWT is applied to analyze the periodicities of annual mean temperature,total precipitation, and runoff time series. The morlet wavelet was used herein as it maintains a good balance between time and frequency(Li XM et al., 2010; Zhang et al., 2012). The morlet wavelet is shown as:
| ${\psi _0}(\eta)= {{\rm{\pi }}^{ - 1/4}}{e^{i{w_0}\eta }}{e^{ - {\eta ^2}/2}}$ | (9) |
where ѱ0(η)is a wavelet function depending on the dimensionless 'time' η with zero mean and being localized in both frequency and time(Farge,1992; Li XM et al., 2011a), and w0 is the non-dimensional frequency. The continuous wavelet transform is given as:
| ${W_n}(s)= \sum\limits_{n'}^{N - 1} {{{x'}_n}\psi * \left[ {\frac{{(n' - n){\rm{\delta }}t}}{s}} \right]} $ | (10) |
where xn is a time series with equal time spacing δt and n=0,⋯,55 in this paper; s st and s for the magnitude of scale, and the(*)denotes the complex conjugate. In the context of morlet wavelets,the wavelet scale is always equal to the Fourier cycle(Zhan et al., 2006).
2.3.5 R/S analytic methodRescaled range(R/S)analysis is used to analyze the future change trends of selected variables by means of the Hurst exponent. The method was initially proposed by Hurst(1951)to analyze the hydrological data of the Nile River. Currently,this method is widely applied in meteorology,hydrology, and other fields(Feng et al., 2008). Assuming that X1,X2,⋯,Xn is a time series of a variable,such as annual mean air temperature,total precipitation,or runoff,for a period of time N,it will be characterized by a mean($\bar X$),a st and ard deviation(S) and a range(R),which can be calculated by the following equations:
| $\bar X = \sum\limits_{i = 1}^n {({X_i})/N} $ | (11) |
| $S = {\left[ {\frac{1}{N}(\sum\limits_{i = 1}^N {{{({X_i} - \bar X)}^2}} } \right]^{1/2}}$ | (12) |
| $X(N)= \sum\limits_{i = 1}^N {({X_i} - \bar X)} $ | (13) |
| $R(N)= \begin{array}{*{20}{c}}{\max }\\{1 \le i \le n}\end{array}(X(i))- \begin{array}{*{20}{c}}{\min }\\{1 \le i \le n}\end{array}(X(i))$ | (14) |
The R/S is represented by an empirical law(Hurst,1951):
| $R/S = {(\alpha N)^H}$ | (15) |
where H is the so-called the Hurst exponent, and α is a scale factor. According to(ln(N),ln(R/S)),H is the slope coefficient,which can be obtained by the least-squares method in a log-log grid.
In the R/S method the Hurst exponent(H),whose values range between 0 and 1,reflects a long-term correlation of a time series. If H = 0.5,the time series is completely independent and the change is ordinary Brownian motion(Armengol et al., 1991); when 0.5 < H < 1,the time series has a long-term persistence and continues previous change trends into the future. The closer the H value is to 1,the stronger is the continuity; conversely,0 < H < 0.5 means that the time series retains a long-term anti-persistence and its future tendency will be the opposite change. The closer the H value is to 0,the stronger is the anti-persistence(Li QH et al., 2011).
3 Results 3.1 Change tendencies of climate factors and runoffIn order to investigate the annual distribution characteristics of temperature,precipitation, and runoff,we explored the probability density functions of annual mean temperature,annual precipitation, and runoff by histograms,normal curve fitting, and QQ plots. Figure 2 shows the histograms,normal curve fitting, and QQ plots of annual mean temperature,annual precipitation, and runoff during 1958-2012 in the Kaidu River Basin. The annual mean temperature well follows a normal distribution(Figures 2a,b),while the annual precipitation and runoff are subject to a logarithmic normal distribution(Figures 2c,d,e,f). The results indicate that temperatures observed in the basin had a different probability distribution than the precipitation and runoff,while the distribution of precipitation was consistent with that of runoff.
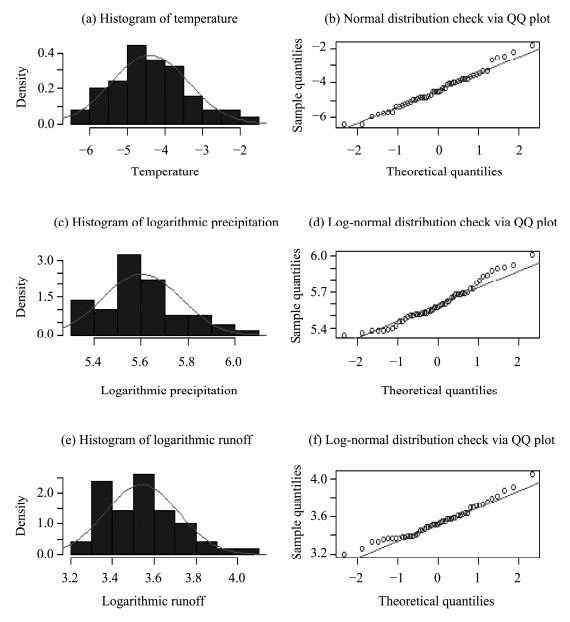 |
| Figure 2 Histogram and normal curve fitting, QQ plot of annual mean temperature (a), (b), annual precipitation (c), (d) and annual runoff (e), (f) during 1958–2012 in the Kaidu River Basin |
To compare the change characteristics of runoff response to temperature and precipitation,the annual mean temperature time series were st and ardized by Equation (1),while Equation (2) was used for the annual precipitation and runoff time series based on the distribution characteristics in the above analysis. The st and ardized time series of the variables are plotted on the same axis to show their dimensionless characteristics and the corresponding characteristics of runoff with temperature and precipitation,respectively(Figure 3). The annual mean temperature and annual runoff do not show a synchronous "pace"(Figure 3a),but the trends of the annual precipitation and runoff perform are extraordinarily synchronous(Figure 3b). This may be somewhat affected by interference from the st and ardization of time series due to differences in distribution functions,but the synchronism of the annual precipitation and runoff time series implies that the runoff hydrograph tracks well with the precipitation time series in the Kaidu River Basin,while the temperature that drives glacier- and snow-melt processes does not play as important a role as precipitation in influencing the runoff hydrograph.
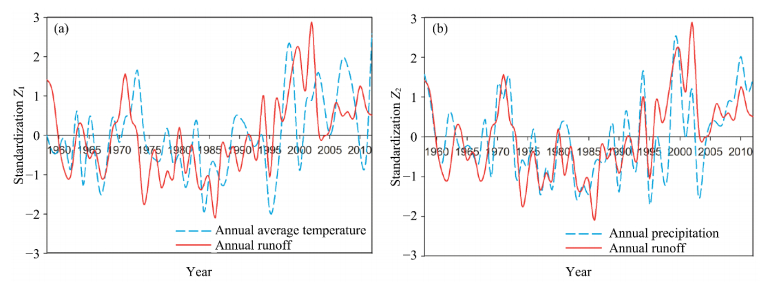 |
| Figure 3 Standardization curves of runoff and temperature (a), runoff and precipitation (b) during 1958–2012 in the Kaidu River Basin |
Using Kendall's W test,we investigated and analyzed the concordance of change trends of the temperature,precipitation, and runoff. Table 1 shows the interpretation of Kendall's W by classifying the degree of agreement and confidence in ranks from W values. The larger the W value,the higher is the concordance. Based on the temperature,precipitation, and runoff data from the Kaidu River Basin,a W value of 0.61 rejects the null hypothesis at the 0.05 significance level. The results indicate that the change tendencies of the temperature,precipitation, and runoff time series over the last five decades were in moderate to strong agreement within fair and high ranks in terms of confidence,which also proves that the runoff is affected by both the temperature and precipitation.
| W | Interpretation | Confidence in ranks |
| 0.1 | Very weak agreement | None |
| 0.3 | Weak agreement | Low |
| 0.5 | Moderate agreement | Fair |
| 0.7 | Strong agreement | High |
| 0.9 | Unusually strong agreement | Very high |
Meteorological and hydrological time series are generally characterized by fluctuating and nonlinear changes, and abrupt changes in these variables have become one of the most remarkable aspects of regional climate change. Figure 4 shows abrupt changes of annual mean temperature,annual precipitation, and runoff time series determined by using the sequential version of the Mann-Kendall test. The intersection points of the forward-trend UF(t) and backward-trend UB(t)curves indicate the abrupt-change points of annual mean temperature,annual precipitation, and runoff time series at the 0.05 significance level,respectively. The results demonstrate that abrupt changes in annual mean temperature(Figure 4a),annual precipitation(Figure 4b), and annual runoff(Figure 4c)occurred in 1997,2008, and 1997,respectively. The division of the UF(t) and UB(t)curves at an abrupt-change point indicates the beginning of an increasing or decreasing trend(Rodrigo et al., 2000). Thus,an increasing trend started in 1997 for the annual mean temperature and annual runoff, and in 2008 for the annual precipitation. Over the long term,the three parameters did not exhibit significant abrupt changes,because the curves do not go outside the dotted lines(p <0.05).
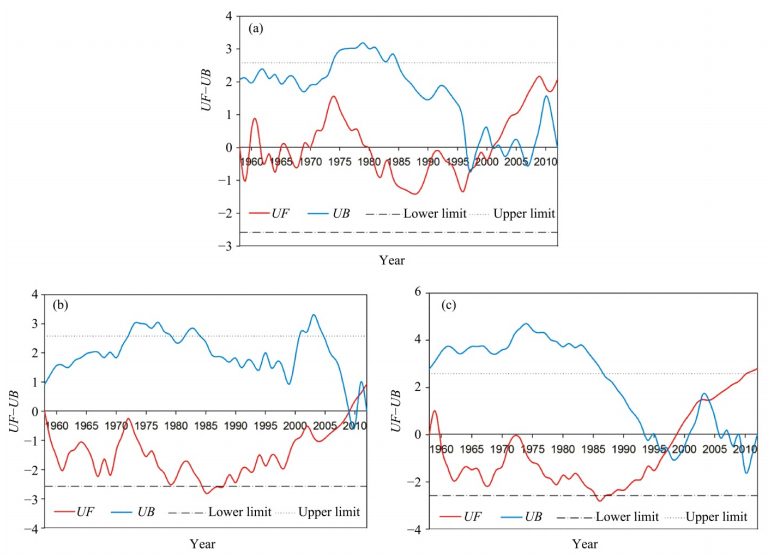 |
| Figure 4 Sequential version of Mann-Kendall test for (a) annual mean temperature, (b) annual precipitation and (c) annual runoff with forward-trend UF(t) (red line), and backward-trend UB(t) (light blue line). Dotted horizontal lines represent lower limit and upper limit of critical values corresponding to the 95% confidence interval, respectively |
Therefore,annual mean temperature and annual runoff had a synchronous change point in 1997,while the change point of annual precipitation occurred in 2008. Moreover,both the annual mean temperature and annual runoff began an increasing trend in 1997. This implies that abrupt changes of the runoff were synchronous with that of the temperature,which indirectly drives glacier- and snow-melt processes.
The abrupt changes of temperature,precipitation, and runoff at the seasonal level were also detected by the sequential version of the Mann-Kendall test(Table 2). A common abrupt change point occurred in 1997 for the average temperature and winter average temperature(WI-AT),which continued to show an increasing trend afterwards. This implies that the abrupt change of the annual average temperature remained consistent with that of WI-AT during all four seasons. The abrupt changes in the other three seasons,spring average temperature(SP-AT),summer average temperature(SU-AT), and autumn average temperature(AU-AT),occurred before abrupt changes in the annual average temperature. From abrupt changes of the annual precipitation and runoff in the four seasons,summer-accumulated precipitation(SU-AP) and winter-accumulated runoff(WI-AR)were synchronous with annual accumulated precipitation and accumulated runoff,respectively. They respectively incurred abrupt changes 2008 and 1997, and maintained increasing trends afterwards. Similarly,abrupt changes in spring-accumulated precipitation(SP-AP),autumn-accumulated precipitation(AU-AP) and winter-accumulated precipitation(WI-AP)also occurred before abrupt changes in annual accumulated precipitation. In addition,abrupt changes in spring-accumulated runoff(SP-AR) and summer-accumulated runoff(SU-AR)occurred before abrupt changes in annual accumulated runoff,while abrupt changes in the autumn-accumulated runoff(AU-AR)occurred afterwards.
| Index | AT | AP | AR | |||||||||||
| SP | SU | AU | WI | SP | SU | AU | WI | SP | SU | AU | WI | |||
| AC* | 1972 | 1983 | 1993 | 1997 | 1987 | 2008 | 1998 | 1993 | 1992 | 1991 | 1999 | 1997 | ||
| Note: AC* stands for abrupt change point. | ||||||||||||||
The effects of climatic factors in multiple time scales on the runoff are important indicators of runoff response to climatic factors under climate change. Periodic variations determined by the wavelet power spectrum for annual mean temperature,annual precipitation, and annual runoff are shown in Figures 5,6,7. Annual mean temperature had 3-year significant cycles,characterized by alternately strong-weak activity for the entire period from 1958 to 2012(Figure 6), and 5-year significant cycles which had strong activity from the 1990s up to now,at the 0.05 significance level(Figure 5). Ten-year,15-year, and 30-year quasi-periodicities with weak activity for annual mean temperature also can be identified in the study period. Moreover,annual precipitation had 6-year,10-year, and 38-year quasi-periodicities which were characterized by weak activity during the study period. The annual runoff results in Figure 7 show 3-year significant cycles characterized by strong activity from 1990 to 2005 at the 0.05 significance level, and 6-year,10-year,15-year, and 38-year quasi-periodicities characterized by weak activity during 1958-2012.
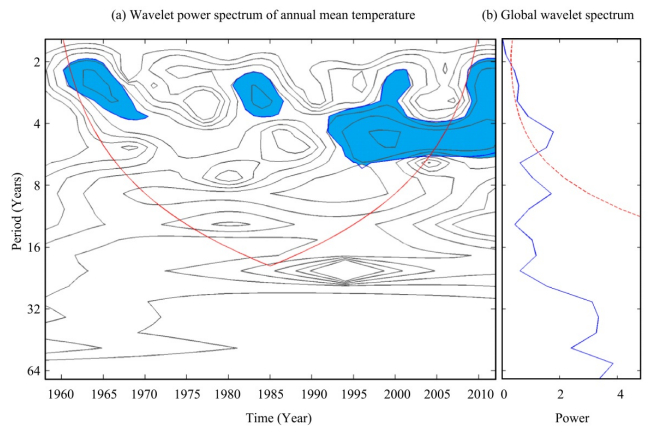 |
| Figure 5 Wavelet power spectrum analysis of annual mean temperature time series during 1958–2012. (a) The wavelet power spectrum of annual mean temperature. Cross-hatched red line is e-folding edge effects, the region below that zero padding has reduced the variance. Blue areas denote the 5% significance level. (b) The global wavelet power spectrum (blue line). The red dashed line is the significance for the global wavelet spectrum, assuming 0.05 significance level and background spectrum as in (a) |
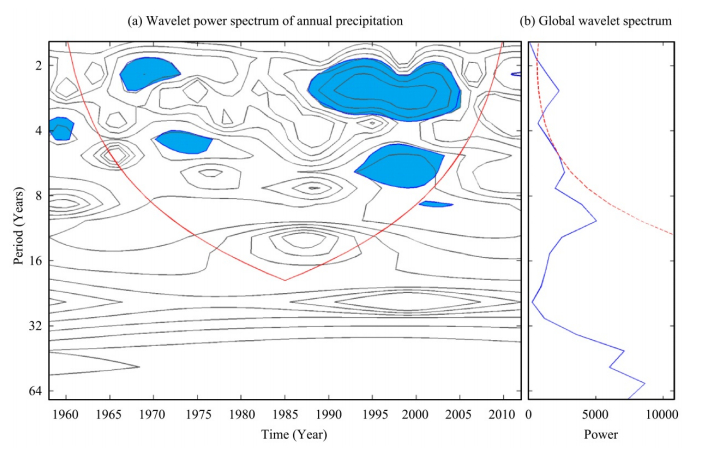 |
| Figure 6 Wavelet power spectrum analysis of annual precipitation during 1958–2012. (a) The wavelet power spectrum of annual precipitation. Cross-hatched red line is e-folding edge effects, the region below that zero padding has reduced the variance. Blue areas denote the 5% significance level. (b) The global wavelet power spectrum (blue line). The red dashed line is the significance for the global wavelet spectrum, assuming 0.05 significance level and background spectrum as in (a) |
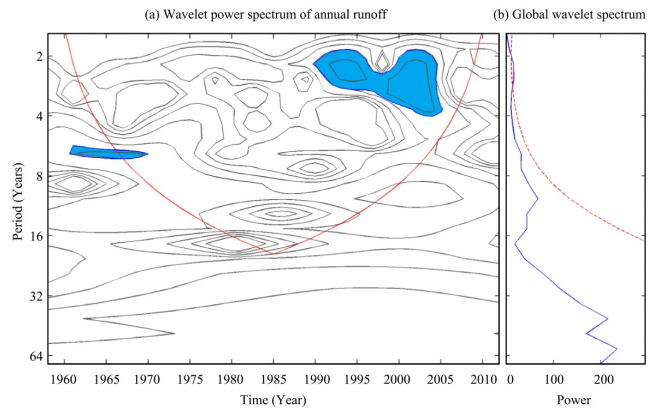 |
| Figure 7 Wavelet power spectrum analysis of annual runoff for 1958–2012. (a) The wavelet power spectrum of annual runoff. Cross-hatched red line is e-folding edge effects, the region below that zero padding has reduced the variance. Blue areas denote the 5% significance level. (b) The global wavelet power spectrum (blue line). The red dashed line is the significance for the global wavelet spectrum, assuming 0.05 significance level and background spectrum as in (a) |
From the above analysis,annual mean temperature,annual precipitation, and runoff had synchronous 3-year significant cycles,characterized by strong activity from 1990 to 2005 at the 0.05 significance level. Periodic characteristics of the precipitation were mainly synchronous with the runoff due to the same 6-year,10-year, and 38-year quasi-periodicities. The results showed that the periodic characteristics of the runoff remained consistent with that of the precipitation during the study period(1958-2012).
The periodicities and intensities of average temperature,accumulated precipitation, and runoff at the seasonal level in the Kaidu River Basin are given in Table 3. The significant cycles of average temperature,accumulated precipitation, and runoff at the seasonal level occurred at 3-5 years,3-7 years, and 3-7 years,respectively. The significant cycles and intensity of winter average temperature(WI-AT)was approximately consistent with that of annual average temperature,while the significant cycles and intensity of summer-accumulated precipitation(SU-AP) and summer-accumulated runoff were basically synchronous with annual accumulated precipitation and annual accumulated runoff over the last 50 years,respectively. This implies that the multiple time-scale characteristics of annual precipitation and runoff in the Kaidu River Basin are represented by the precipitation and runoff in summer,respectively,while those of annual average temperature are described by the average temperature in winter.
| Index | SP-AT | SU-AT | AU-AT | WI-AT |
| P | 3*; 15; 32 | 4*; 30 | 3*; 5; 7; 30 | 3*; 5*; 9; 15 |
| SPF* | 1974-1990 | 1972-1980 | 1971-1982 1989-2002 | 1972-1987 1995-2012 |
| Index | SP-AP | SU-AP | AU-AP | WI-AP |
| P | 3*; 4*; 9; 15 | 3*; 7*; 10; 34 | 5*; 7; 15; 30 | 4*; 9; 18 |
| SPF* | 1982-1996 2002-2012 | 1988-2002 | 1978-1990 2000-2012 | 1977-1988 1992-2002 |
| Index | SP-AR | SU-AR | AU-AR | WI-AR |
| P | 3*; 5*; 9; 18 | 3*; 7*; 10; 15 | 3*; 7; 30 | 18 |
| SPF* | 1972-1989 | 1990-2012 | 1968-1972 1988-1992 | — |
| Note: P stands for period, SPF* denotes significant periodic fluctuation, and * means that period is significant at the 0.05 level. | ||||
The long-term memory characteristics of average temperature,accumulated precipitation, and runoff can determine the continuity of the change tendency of runoff response to climatic factors in the future. According to classifications of H values in Table 4,annual mean temperature will persist in an extremely strong trend in the future due to its high H value of 0.83,while the annual precipitation and runoff will very strongly persist owing to their relatively high H values of 0.73 and 0.80,respectively. The H value of annual runoff is between those of annual mean temperature and annual precipitation,implying that the runoff will be persistently affected by both the temperature and precipitation in the future.
| Ranks | H value | Persistency | Ranks | H value | Anti-persistency |
| 1 | 0.50<H≤0.55 | Very weak | −1 | 0.45<H≤0.50 | Very weak |
| 2 | 0.55<H≤0.65 | Weak | −2 | 0.35<H≤0.45 | Weak |
| 3 | 0.65<H≤0.75 | Strong | −3 | 0.25<H≤0.35 | Strong |
| 4 | 0.75<H≤0.80 | Very strong | −4 | 0.20<H≤0.25 | Very strong |
| 5 | 0.80<H≤1.00 | Extreme strong | −5 | 0.00<H≤0.20 | Extreme strong |
The annual mean temperature is shown to increase at a rate of 0.26 ℃/decade,annual precipitation at 3.52 mm/decade, and annual runoff at 0.14×10⁸ m3/decade, and they will all continue to increase in the future(Table 5). In other words,because all of the H values are greater than 0.5,climate factors(temperature and precipitation) and runoff will synchronously and persistently increase in the future.
| Index | AT | AP | AR | |||||||||||
| SP | SU | AU | WI | SP | SU | AU | WI | SP | SU | AU | WI | |||
| H | 0.65 | 0.90 | 0.66 | 0.74 | 0.63 | 0.81 | 0.57 | 0.71 | 0.58 | 0.75 | 0.84 | 0.86 | ||
| R2 | 0.95 | 0.96 | 0.91 | 0.94 | 0.94 | 0.94 | 0.93 | 0.95 | 0.91 | 0.94 | 0.94 | 0.88 | ||
Temperature and precipitation are the two main climatic factors that influence the runoff in alpine river basins in arid zones,where the runoff is generated in nearby mountainous areas(Chen et al., 2006; Li XM et al., 2011b). Global climate change has led to local hydro-meteorological changes in the Tianshan Mountains in Northwest China,including increasing trends in temperature,precipitation, and runoff in the associated river basins(Gao and Yan, 2011; Wang et al., 2011). The Kaidu River Basin,as an alpine watershed within the Tianshan Mountains,has not been immune to climate change over the last few decades(Li XM et al., 2011b; Zhang et al., 2014).
Runoff formation is a complex meteorological-hydrological process influenced by many factors,especially temperature and precipitation. In the Kaidu River Basin the surface runoff of the river is mainly supplied by alpine glacier meltwater,snowmelt, and rainfall. Snowmelt water is controlled by temperature,which is a main contributor to the runoff in cold seasons,while glacial meltwater and rainfall are controllers for runoff in warm seasons. Therefore,Kendall's W test analysis indicated that the change trends in temperature,precipitation, and runoff are in concordance. This demonstrates that the runoff is affected by both the temperature and precipitation.
Meteorological and hydrological time series are generally characterized by fluctuating and nonlinear changes, and abrupt changes in these variables have become one of the most remarkable aspects of regional climate change. Abrupt changes in the temperature and precipitation within the Kaidu River Basin are the regional reflection of global climatic warming(Ling et al., 2013). Based on our research results,abrupt changes of annual average temperatures have historically been synchronous with that of winter average temperatures, and abrupt changes in annual runoff have been consistent with that of winter-accumulated runoff,which also shows synchronicity with annual average temperature. Perhaps that is somewhat coincidental,but the remarkable increase of air temperature in the Kaidu River Basin under global climate warming has produced abundant glacial and snow meltwater,contributing to increases in the runoff. There is little doubt that winter temperatures have shown the most significant increase in Northeast China over recent years(Liu et al., 2003; Jiang et al., 2004; Qian and Lin, 2004; Zhao et al., 2013), and this contributes to winter runoff being a considerable proportion of the annual runoff volume(Li XM et al., 2011b). Moreover,we calculated the proportion of winter runoff as part of annual runoff in the Kaidu River Basin, and found that the winter proportion significantly increased during the period 1958-2012 when the temperature increased at a rate of 0.42 ℃/decade. Therefore,abrupt changes and significant increases in the winter temperature have led to increases in winter runoff,thus also contributing to abrupt changes and significant increases of the annual temperature and total runoff.
According to multiple time-scale analyses,periodicities and intensities of the annual precipitation and the precipitation in summer are consistent in different time scales. They have remained synchronous with the main periodicities and intensities of the annual runoff and runoff in summer,respectively. Since the precipitation and runoff in summer accounts for 69% and 44% of the annual total precipitation and runoff,respectively(Xue et al., 2014),the multiple time-scales for the precipitation and runoff in summer can reflect those for the precipitation and runoff at the annual scale. The periodicities and intensities of the precipitation in summer ultimately contribute to those of the annual runoff through transitivity. On the basis of the Hurst exponents in R/S analysis,the temperature,precipitation, and runoff have long-term memories characteristics at the annual and seasonal scales; due to each of them having H values greater than 0.5,they can all be expected to continue their synchronous increasing patterns for a period of time in the Kaidu River Basin.
5 ConclusionsRunoff formation is influenced by many climate factors, and its change is synchronous with some of these climatic variables. Based on 55-year observed daily mean temperature and precipitation data within the Kaidu River Basin in Northwest China,this paper applied quantitative methods to reveal synchronism between climate factors and runoff. The results show that:
1)Kendall's W test revealed that the nonlinear trend changes of the annual mean temperature,annual precipitation, and runoff time series were in concordance at the 0.05 significance level. The trends of the annual precipitation and runoff proved extraordinarily synchronous through st and ardization curves,but less concordance was shown between the annual mean temperature and annual runoff.
2)The annual mean temperature and annual runoff had synchronous change points occur in 1997, and both of them have shown an obviously increasing trend since then. Moreover,abrupt changes in annual average temperature have been synchronous with that of average winter temperature. Therefore,it is concluded that abrupt changes in annual runoff,which are also consistent with those of accumulated runoff in winter,are associated with the temperature in winter which directly drives glacier- and snow-melt processes.
3)The annual mean temperature,annual precipitation, and runoff have shown synchronous 3-year significant cycles. Annual precipitation and runoff also exhibited 6-year,10-year, and 38-year quasi-periodicities during study period(1958-2012). The periodicity of annual runoff has been mainly synchronous with that of annual precipitation, and the significant periodicities and intensities of the annual precipitation were synchronous with the precipitation in summer. This indicates that the periodic characteristics of annual runoff are mainly explained by the precipitation in summer.
4)Based on rescaled range(R/S)analysis,the temperature,precipitation, and runoff have long-term memories characteristics at the annual and seasonal scales; due to each of them having H values greater than 0.5,they can all be expected to continue their synchronous increasing patterns for a period of time in the Kaidu River Basin.
This paper applied several classical methods to comprehensively analyze the synchronism of changes in temperature,precipitation and runoff trends in a mountainous arid-zone river basin. However,due to the lack of meteorological stations and the complexity of hydro-meteorological systems,coupled with the challenging geographical environment in the Kaidu River Basin,the physical mechanisms of runoff response to climate change in that area are suggested for further study.
Acknowledgments: The authors are grateful to the anonymous reviewers for their critical reviews and comments on drafts of this manuscript. This work was financially supported by the National Natural Science Foundation of China(No. 41471031).| Armengol J, Sabater S, Sabater F, et al., 1991. Using the rescaled range analysis for the study of hydrological records:the river TER as an example. Oecologia Aquatic, 10(10):21-34. |
| Chen YN, 2014. Water Resources Research in Northwest China. Berlin, Springer Verlag. pp. 3-20. |
| Chen YN, Takeuchi K, Xu CC, et al., 2006. Regional climate change and its effects on river runoff in the Tarim Basin, China. Hydrological Processes, 20:2207-2216. DOI:10.1002/hyp.6200. |
| Farge M, 1992. Wavelet transforms and their applications to tur-bulence. Annual Review of Fluid Mechanics, 24:395-475. DOI:10.1146/annurev.fl.24.010192.002143. |
| Feng XL, Luo LC, Qiu LL, et al., 2008. Fractal analysis of climate change and Hurst Index experiment in Tibetan Plateau in future. Arid Land Geography, 31(2):175-181. |
| Gao YJ, Yan JP, 2011. A comparison on characteristics of climate change in the north and south of Tianshan Mountain. Journal of Arid Land Resources and Environment, 25(12):92-96. |
| Gerstengarbe FW, Werner PC, 1999. Estimation of the beginning and end of recurrent events within a climate regime. Climate Research, 11:97-107. DOI:10.3354/cr011097. |
| Hurst HE, 1951. Long-term storage capacity of reservoirs. Trans-actions of the American Society of Engineers, 116:770-779. |
| IPCC (Intergovernmental Panel on Climate Change), 2014. The opening session of the thirty-eighth session of the IPCC. March 25, Yokohama, Japan. |
| Jiang DB, Wang HJ, Lang XM, 2004. Multimodel ensemble pre-diction for climate change trend of China under stress A2 sce-nario. Chinese Journal of Geophysics, 47(5):878-886. DOI:10.1002/cjg2.564. |
| Jung Y, Choi M, 2012. Survey-based approach for hydrological vulnerability indicators due to climate change:case study of small-scale rivers. Journal of the American Water Resources Association, 48(2):256-265. DOI:10.1111/j.1752-1688.2011.00608.x. |
| Kendall MG, 1955. Rank Correlation Methods. New York:Hafner Publishing Company. |
| Lan YC, Wu SF, Zhong YJ, et al., 2007. Characteristics and trends of changes on water cycle factors in the Tianshan mountainous area since 1960s. Journal of Mountain Science, 25(2):177-183. |
| Lan YC, Zhong YJ, Wu SF, et al., 2011. Response of mountain runoff to climate change in representative rivers originated from the Tianshan Mountain. Journal of Desert Research, 31(1):254-260. |
| Legendre P, 2005. Species associations:The Kendall coefficient of concordance revisited. Journal of Agricultural, Biological, and Environmental Statistics, 10(2):226-245. DOI:10.1198/108571105X46642. |
| Li JS, Li JH, 2008. The application of Kendall's W test method in medicine. Modern Preventive Medicine, 35(1):33-42. |
| Li LH, Xu HG, Chen X, et al., 2010. Streamflow forecast and reservoir operation performance assessment under climate change. Water Resources Management, 24:83-104. DOI:10.1007/s11269-009-9438-x. |
| Li LJ, Zhang L, Wang H, et al., 2007. Assessing the impact of climate variability and human activities on streamflow from the Wuding River basin in China. Hydrological Processes, 21:3485-3491. DOI:10.1002/hyp.6485. |
| Li QH, Chen YN, Shen YJ, et al., 2011. Spatial and temporal trends of climate change in Xinjiang, China. Journal of Geographical Sciences, 21(6):1007-1018. DOI:10.1007/s11442-011-0896-8. |
| Li XM, Jiang FQ, Li LH, et al., 2010. Changing tendency and multi-Scale features of precipitation in the north source area and mainstream area of the Tarim River. Journal of Glaciology and Geocrylolgy, 32(2):285-294. |
| Li XM, Jiang FQ, Li LH, et al., 2011a. Spatial and temporal varia-bility of precipitation concentration index, concentration degree and concentration period in Xinjiang, China. International Journal of Climatology, 31:1679-1693. DOI:10.1002/joc.2181. |
| Li XM, Li LH, Guo LP, et al., 2011b. Impact of climate factors on runoff in the kaidu river watershed:path analysis of 50-year data. Journal of Arid Land, 3(2):132-140. DOI:10.3724/SP.J.1227.2011.00132. |
| Ling HB, Xu HL, Fu JY, et al., 2013. Suitable oasis scale in a typical continental river basin in an arid region of China:A case study of the Manas River Basin. Quaternary International, 286:116-125. DOI:10.1016/j.quaint.2012.07.027. |
| Liu J, Hayakawa N, Lu M, et al., 2003. Hydrological and geo-cryological response of winter streamflow to climate warming in Northeast China. Cold Regions Science and Technology, 37:15-24. DOI:10.1016/S0165-232X(03)00012-0. |
| Ma LP, 2000. Statistical data standardization-the dimensionless method. Beijing Statistics, 121:34-35. |
| Qian WH, Lin X, 2004. Regional trends in recent temperature indices in China. Climate Research, 27:119-134. DOI:10.3354/cr027119. |
| Rodrigo FS, Esteban-parra MJ, Pozo-Vazquez D, et al., 2000. Rainfall variability in southern spain on decadal to centennial time scales. International Journal of Climatology, 20:721-732. DOI:10.1002/1097-0088(20000615)20:7<721:AID-JOC520> 3.0.CO;2-Q. |
| Schmidt RC, 1997. Managing delphi survey using nonparametric statistical techniques. Decision Sciences, 28(3):763-774. DOI:10.1111/j.1540-5915.1997.tb01330.x. |
| Schucany WR, Frawley WH, 1973. A rank test for two group concordance. Psychometrika, 38(2):249-258. DOI:10.1007/BF02291117. |
| Shi YF, Shen YP, Kang ES, et al., 2007. Recent and future climate change in Northwest China. Climatic Change, 80(3-4):379-393. DOI:10.1007/s10584-006-9121-7. |
| Sneyers R, 1975. Sur l'analyse statistique des séries d'observations. WMO Tech Note. |
| Torrence C, Compo GP, 1998. A practical guide to wavelet analysis. Bulletin of the American Meteorological Society, 79:61-78. |
| Wang SJ, Zhang MJ, Li ZQ, et al., 2011. Glacier area variation and climate change in the Chinese Tianshan Mountains since 1960. Journal of Geographical Sciences, 21(2):263-273. DOI:10.1007/s11442-011-0843-8. |
| Xu CC, Chen YN, Yang YH, et al., 2010. Hydrology and water resources variation and its responses to regional climate change in Xinjiang. Journal of Geographical Sciences, 64(14):1331-1341. DOI:10.1007/s11442-010-0599-6. |
| Xu HL, Ye M, Song YD, 2007. Relationship between climate changes and annual runoff of headstrearns of Tarim River. Chinese Geographical Science, 27(2):219-224. |
| Xue J, Li LH, Li XM, et al., 2014. Annual distributions of precipitation and runoff and the synchronicity of their variations in the Kaidu river basin. Journal of Arid Land Resources and Environment, 28(12):99-104. |
| Yang YH, Tian F, 2009. Abrupt change of runoff and its major driving factors in Haihe River catchment, China. Journal of Hydrology, 374:373-383. DOI:10.1016/j.jhydrol.2009.06.040. |
| Zhan LS, He JM, Ye YL, et al., 2006. Periodicity analysis of solar activity by wavelet analyzing method. Acta Astronomica Sinica, 47(2):166-174. |
| Zhang FY, Li LH, Ahmad S, et al., 2014. Using path analysis to identify the influence of climatic factors on spring peak flow dominated by snowmelt in an alpine watershed. Journal of Mountain Science, 11(4):990-1000. DOI:10.1007/s11629-013-2789-z. |
| Zhang YW, Wei WS, Jiang FQ, et al., 2012. Relationship between the North Atlantic Oscillation and climate change in Xinjiang in recent 50 Years. Plateau Meteorology, 31(4):974-982. |
| Zhao CY, Wang Y, Zhou XY, et al., 2013. Changes in climatic factors and extreme climate events in Northeast China during 1961-2010. Advances in Climate Change Research, 4(2):92-102. DOI:10.3724/SP.J.1248.2013.092. |
 2016, 8


