Article Information
- ShengJie Wang, WenYing He, HongBin Chen, JianChun Bian, ZhenHui Wang. 2016.
- Statistics of cloud heights over the Tibetan Plateau and its surrounding region derived from CloudSat data
- Sciences in Cold and Arid Regions, 8(1): 72-81
- http://dx.doi.org/10.3724/SP.J.1226.2016.00072
Article History
- Received: July 7, 2015
- Accepted: September 22, 2015
2. LAGEO, Institute of Atmospheric Physics, Chinese Academy of Sciences, Beijing 100029, China;
3. Nanjing University of Information Science & Technology, Nanjing, Jiangsu 210044, China
1 Introduction
The interaction between clouds and radiation has important implications on weather and climate change processes. This interaction largely determines the radiation balance of the earth-atmosphere system,while the distribution of radiation income and expenditure is the main driving force of the atmosphere and oceans(Qiu et al., 2003). The influence of radiative income and expenditure from cloud radiative characteristics and its height can lead to warming or cooling of the earth(Stephens and Webster, 1981; Stephens et al., 1990). Different clouds with different heights from the ground have different radiative forcing. Thus,low clouds usually causes a cooling effect while high clouds usually causes a greenhouse effect,the role of which closely depends on the clouds microphysical characteristics. Global Circulation Model(GCM)simulations also show that changes of cloud amount and vertical structure have an effect on atmospheric circulation. Thus,obtaining information on cloud height and its temporal-spatial change is very important to the study of global climate change(Frey et al., 1999).
The Tibetan Plateau,with its unique high-altitude,surface features and climate environment,has a significant impact on climate change over China,Asia and globally. Therefore,the plateau is regarded as an important area for climate anomalies(Ye and Gao, 1979; Tao et al., 1998). Due to geographic constraints,ground observation data is limited,but with relatively recent development of satellite remote sensing technology,research on clouds and climate change for the Tibetan Plateau has made great progress(Wei and Zhong, 1997; Feng et al., 2001; Wang et al., 2001; Feng et al., 2002; Liu et al., 2002; Qie and Ralf, 2003; Zhang et al., 2003; Cai et al., 2004; Zhang et al., 2005; Fu et al., 2007; Huang et al., 2007). In this paper,CloudSat data is analyzed over three regions,Tibetan Plateau,south slope of the plateau and South Asian Monsoon region,to study the temporal-spatial characteristics of cloud height of cloud top,cloud height of cloud base, and cloud thickness of different types of clouds.
2 Data and methodsData used in this paper is CloudSat St and ard Data Products Level 2B Cloud Geometrical Profile(2B GEOPROF) and Cloud Scenario Classification(2B CLDCLSS). CloudSat,launched on April 28,2006 in the United States,together with several other satellites in orbit constitute the same afternoon series(A-Train)satellite constellation to achieve quasi-synchronous(time difference among the satellite is less than 30 minutes)active and passive multi-b and observation of the earth. CloudSat detects the vertical structure of clouds by active detection with millimeter wave for the first time from space,which provides a vertical profile of clouds and related characteristics of cloud particles. The satellite's main payload is a 94 GHz(3 millimeter wavelength)cloud profiling radar(CPR),with cross-track resolution of 1.4 km,along-track resolution of 2.5 km, and vertical resolution of 500 m(Stephensa et al., 2002; Huang et al., 2003).
In this work,Radar_Reflectivity,cloud height and CPR cloud discrimination(Cloud_mask)data are used from CloudSat-2B GEOPROF data. Radar_Reflectiviey data provide CPR echo value, and the corresponding height data provide the height value of the radar echo in the vertical direction from mean sea level up to 30 km. CPR Cloud_mask data provide the value of validity corresponding to each echo,which is the reflection of echo reliability. The larger Cloud_mask is,the stronger the echo, and more reliable the signal is(Mace,2007; Mace et al., 2007; Kahn et al., 2008). First,we analyzed the radar reflectivity data of each cloud profile, and ensured that the radar echo value is within a reasonable range(approximately 40-50 dBz). We then obtain the height value of the corresponding radar echo by using cloud height data, and judge the validity of the echo according to the CPR Cloud_mask data. Cloud top and cloud base heights of the detected cloud body are derived from the height of the first valid echo and the final one in each cloud profile,with the two height values minus the altitude heights of echoes(Weisz et al., 2007; March and et al., 2008).
Detailed division of the areas(Figure 1)studied in this paper are: Tibetan Plateau(TP),at 25°N-40°N,70°E-105°E,altitude above 3,000 m; south slope of the plateau,at 25°N-35°N,70°E-105°E,altitude lower than 3,000 m; South Asian Monsoon region,at 10°N-25°N,70°E-105°E. These three regions have different climate characteristics. Their geographic areas are 2.78,1.64, and 6.15 million km2,respectively. Selected time series is from June 2006 to December 2007. The occurrence frequency of cloud base and cloud top over the three regions for each month are statistically analyzed within the height interval of each 1 km from 0 km(ground or sea level)to 20 km. The 21st height interval includes all clouds above 20 km.
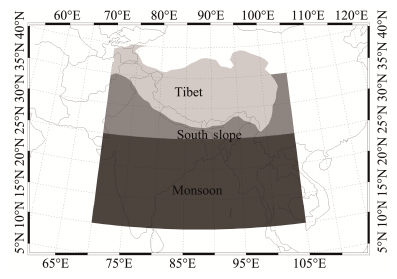 |
| Figure 1 Regions defined in this study |
Cloud top and cloud base heights defined in this paper are relative height values above the ground,which are determined by the radar echo height of cloud top and cloud base detracted by the local altitude height. In order to analyze representative characteristics,statistical results of January,April,July, and October of 2007 are analyzed. The four months represent to winter,spring,summer and autumn,separately.
3.1 Comparison of cloud top and base heights over the three regionsAlthough the South Asian Monsoon region is much larger than the plateau region,after statistical comparison it was found that total cloud occurrence frequency in winter and spring over the plateau is significantly higher than over the monsoon region,whatever the cloud top heights or cloud base heights(Figures 2 and 3). The unit area is defined as 102×104 square kilometers.
As presented in Figure 2,the majority of cloud base occurrence frequency in winter/spring is over the Tibetan Plateau region at 0-6 km/0-7 km(corresponding to low and middle clouds in this region),at 6-11 km/7-11 km for south slope of the plateau region, and at 11-15 km/11-17 km for the monsoon region(corresponding to convective clouds in this region). In summer,the frequency majority is over the Tibetan Plateau region at 0-9 km,significantly higher over the monsoon region at 9-16 km, and very low for both south slope of the plateau region and the monsoon region at 16-18 km. In autumn,frequency majority is over the Tibetan Plateau region at 0-6 km,steady frequencies at 2-10 km over south slope of the plateau region and the monsoon region,higher at 2-7 km over south slope of the plateau region than the monsoon region, and frequency majority at 11-17 km over the monsoon region.
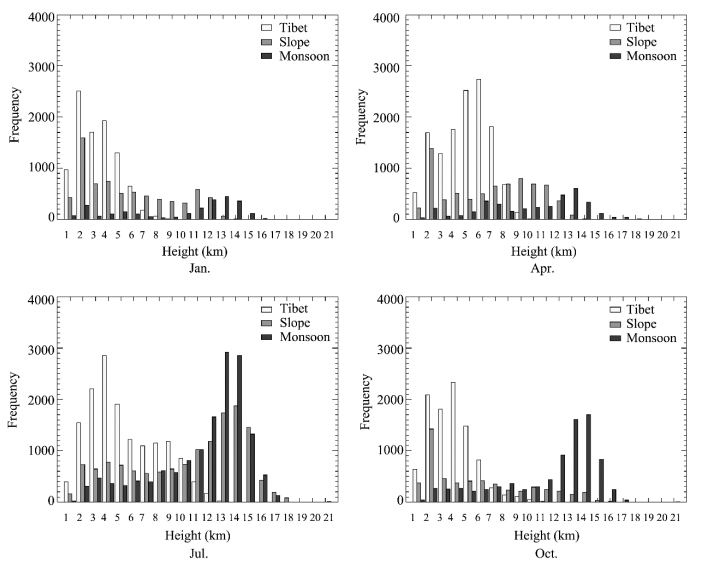 |
| Figure 2 Occurrence frequency of cloud top height over the three regions |
Figure 3 shows the occurrence frequency of cloud base height per unit area in the three regions. At the 0-4 or 0-5 km range,frequency majority is over the Tibetan Plateau region for the four seasons. In winter/spring,frequency majority is over the south slope of the plateau region at 4-10 km/5-9 km, and at 10-14 km/9-14 km for the monsoon region. In summer,frequency majority over the monsoon region is about 30% higher than the south slope of the plateau region at 4-12 km, and nearly the same at 12-15 km. In autumn,frequency majority is over the monsoon region at 4-14 km.
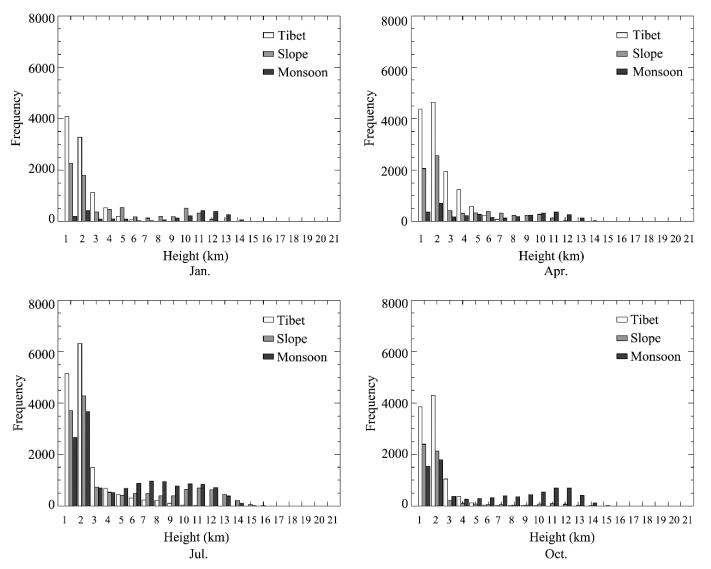 |
| Figure 3 Occurrence frequency of cloud base height over the three regions |
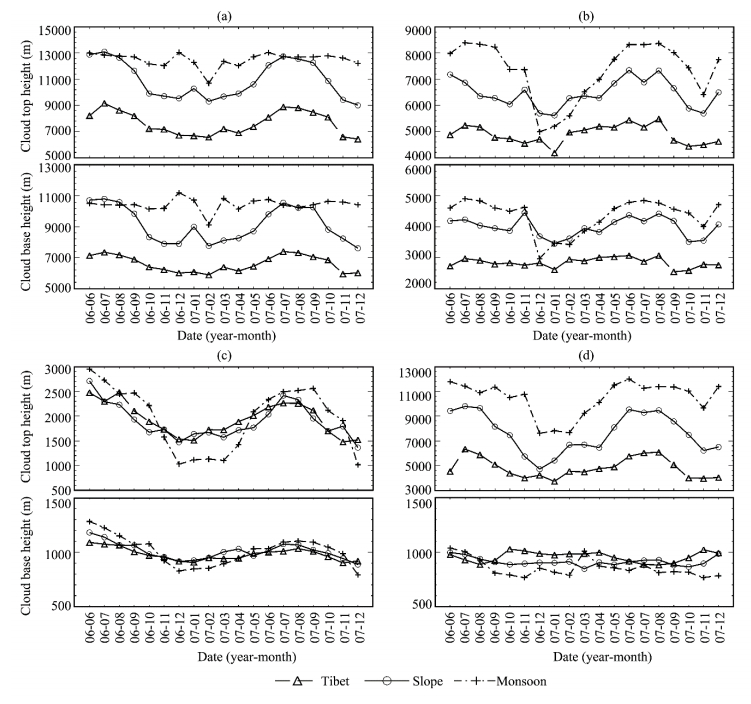
In order to study the cloud type and cloud conditions over the interested regions,we use the CloudSat 2B-CLDCLASS data to statistically analyze the characteristics of different cloud types. In this study,clouds are divided into four types,high cloud(cirrus),middle cloud(altrostratus,altocumulus),low cloud(stratus,stratocumulus,cumulus), and thick cloud(nimbostratus,deep convective cloud)according to the detected millimeter-wave echo radar and other relevant information(Wang and Sassen, 2001,2007). The monthly mean cloud top height and cloud base height of the four cloud types during the period from June 2006 to December 2007 over the three studied regions are presented in Figure 4.
 |
|
Figure 4 Statistics of monthly mean cloud top height and cloud base height over the studied regions during 2006/06–2007/12. (a) high cloud, (b) middle cloud, (c) low cloud, (d) thick cloud |
As presented in Figure 4,high cloud top height mainly ranges from 6.5-9.5 km in the Tibetan Plateau region,lowest in winter,highest in summer, and higher in autumn than in spring. The cloud base height mainly ranges from 6-7.5 km,lowest in winter, and highest in summer. High cloud top height mainly ranges from 9-13 km and cloud base height mainly ranges from 7.5-11 km in the south slope of the plateau region,with more obvious seasonal variation,lowest in winter and highest in summer. High cloud top height mainly ranges from 12-13 km and cloud base height mainly ranges from 10-11 km in South Asian Monsoon region,without clear seasonal variation. In summer,cloud top and cloud base heights are much closer between the regions over South Asian Monsoon and south slope of the plateau, and higher than the Tibetan Plateau region. In other seasons,the altitude of the high cloud is highest in South Asian Monsoon region, and lowest in the Tibetan Plateau region.
Comparison of middle clouds over the three regions shows that,middle cloud top height mainly ranges from 4.5-5.5 km and cloud base height mainly ranges from 2.5-3 km over the Tibetan Plateau region,without clearly seasonal variation, and highest in summer. Middle cloud top height mainly ranges from 5.5-7.5 km and cloud base height mainly ranges from 3.5-4.5 km over the south slope of the plateau region,lowest in winter, and highest in summer. Middle cloud top height mainly ranges from 5-8.5 km and cloud base height mainly ranges from 3-5 km over the South Asian Monsoon region,with clear seasonal variation,lowest in winter, and highest in summer. In winter,middle cloud top height and base height is higher over the south slope of the plateau region than over the South Asian Monsoon region. Also,in other seasons,middle cloud altitude is highest over the South Asian monsoon region, and lowest over the Tibetan Plateau region.
Low cloud top heights are closer over the Tibetan Plateau and the south slope of the plateau region,mainly ranges from 1.5-2.5 km. The heights increases gradually from winter to summer, and then gradually declines. Low cloud top height ranges from 1-3 km over the South Asian Monsoon region,which peaks in summer and bottoms out in winter. In winter,low cloud top height over the Tibetan Plateau is lower than the other two regions and higher than the other two regions in other seasons. The cloud base height of the thick cloud is closer over the three regions,varies around 1 km,higher in summer, and lower in winter.
Thick cloud top height over the Tibetan Plateau,the south slope of the plateau region and South Asian Monsoon region ranges from 4-6 km,4.5-10 km, and 7.5-12 km,respectively. They all reach the highest value in summer and lowest value in winter. The height is the highest over the South Asian Monsoon region and the lowest over the Tibetan Plateau. The cloud base height of thick clouds over the three regions is about the 900 m,without clear seasonal variation.
Statistical results of cloud top and cloud base heights of different cloud types based on a full year of data in 2007 over each region is presented in Table 1. The average cloud top and cloud base heights decrease in accordance with the order of high,middle,low, and thick cloud. For the same cloud type,cloud top and cloud base heights are the highest over the South Asian Monsoon region, and the lowest over the Tibetan Plateau. The cloud base height of low and thick clouds are relatively close over the three regions(950 m).
| Cloud type | Tibetan Plateau | South slope of the plateau (km) | South Asian Monsoon region (km) | |||||
| Top height (km) | Base height (km) | Top height (km) | Base height (km) | Top height (km) | Base height (km) | |||
| High cloud | 7.50 | 6.50 | 10.70 | 8.90 | 12.40 | 10.40 | ||
| Middle cloud | 4.90 | 2.80 | 6.50 | 3.90 | 7.20 | 4.30 | ||
| Low cloud | 1.90 | 0.96 | 1.80 | 0.99 | 1.80 | 0.98 | ||
| Thick cloud | 4.80 | 0.95 | 7.50 | 0.90 | 10.40 | 0.84 | ||
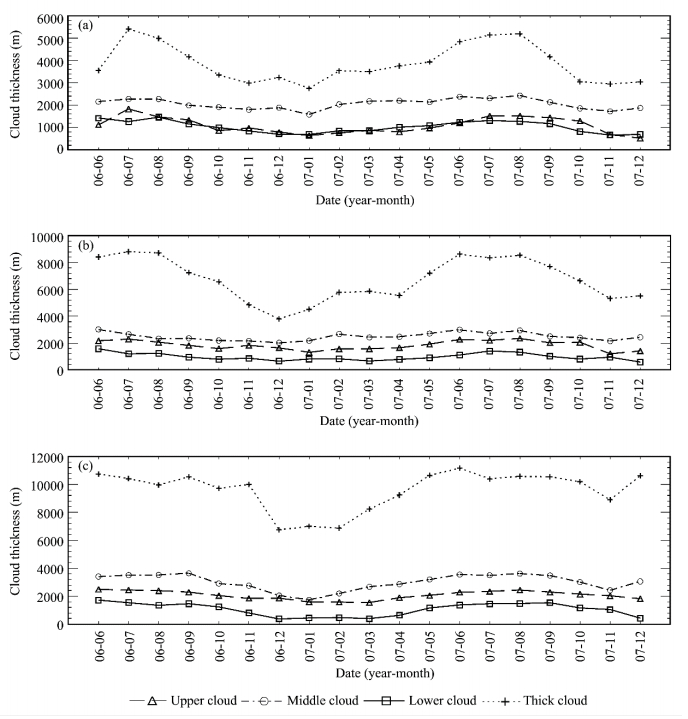
The thickness of different cloud types can be calculated with cloud top and base heights. For a multi-cloud type,it is necessary to determine cloud top and base heights according to cloud continuity in the same profile. The first and final effective heights of cloud continuity are taken as the cloud top and base heights separately. The monthly average cloud thickness of different cloud types over the three regions are presented in Figure 5.
 |
|
Figure 5 Monthly averaged thickness of different cloud types over the three regions. (a) Tibetan Plateau, (b) south slope of the plateau, (c) South Asian Monsoon region |
The average thickness of the thick cloud over the Tibetan Plateau region mainly ranges from 3-5.5 km,with clear seasonal variation; reaching the highest value in summer, and lowest in winter. The average thickness of the middle cloud over this region is mainly about 2 km. Thick cloud and high cloud thickness are close,both ranging from 800 m to 1.8 km.
The average thickness of thick clouds over the south slope of the plateau region mainly ranges from 4-9 km,with clearly seasonal variation,highest in summer, and lowest in winter. The average thickness decreased in accordance with the order of middle,high and low clouds,at 2-3 km,1-2.5 km, and 0.5-1.5 km,respectively. The average thickness reaches the highest in summer and the lowest value in winter.
The average thickness of thick clouds over the South Asian Monsoon region mainly ranges from 7-11 km,reaching the highest in summer, and lowest in winter. The average thickness decreased in accordance with the order of middle,high and low clouds,at 2-4 km,1.5-2.5 km, and 0.5-2 km,respectively. Thickness of all four types are higher in summer, and lower in winter.
From comparative results of thick cloud average thickness over the three regions,it is thickest over the South Asian Monsoon region,thinnest over the Tibetan Plateau region, and seasonal variations are consistent over the three regions. Middle cloud thickness is slightly larger over the south slope of the plateau region than over other regions in winter and higher over the South Asian Monsoon region than over other regions in other seasons. Middle cloud thickness is thinnest over the Tibetan Plateau region. The average thickness of high clouds over the South Asian Monsoon region and the south slope of the plateau region are close, and both are higher than over the Tibetan Plateau region. The average thicknesses of low clouds over the three regions are close, and the variations are similar. This thickness is thinner over the South Asian Monsoon region than the other two regions in winter.
3.4 Statistical analysis on the proportion of different cloud types over the three regionsAccording to 2B-CLDCLASS cloud classification product information,we analyzed the proportion of different cloud types over the three regions from June 2006 to December 2007. Table 2 presents the percentage of each cloud type from January to December of 2007 over the three regions, and the percentage in four seasons over the three regions based on seasonal average statistics.
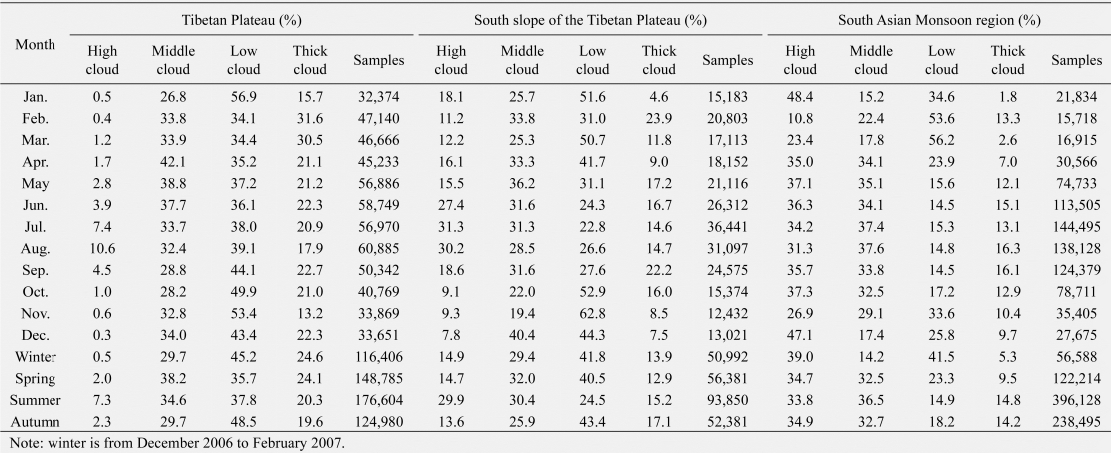 |
For the different cloud types,the proportion of high clouds is the lowest over the Tibetan Plateau region,reaching a peak of 10.6% in August. The proportion of middle clouds increases gradually from winter to spring,reaching a maximum in April,then declines gradually,with a variation of about 30%-40%. The proportion of low clouds is slightly lower than that of middle clouds only in spring and early summer,higher than other cloud types in other seasons. The portion of low clouds reaches a maximum in January at 56.9%. The portion of thick clouds increases significantly to 30.5%-31.6% in February and March, and varies about 20% in other months.
The proportion of high clouds reaches a maximum of 30.2%-31.3% in summer over the south slope of the plateau, and varies at 10%-20% in other seasons. The proportion of middle clouds ranges from 19.4%-36.2%. The proportion of low clouds decreases during the summer, and ranges from 30%-60% in other seasons, and is higher than the proportion of other cloud types. The proportion of thick cloud ranges from 4.6%-23.9%.
The proportion of high clouds reaches 47.1%-48.4% in December and January, and drops to 10.8% in February, and ranges from 30%-40% in other months over the South Asian Monsoon region. The proportion of middle cloud decreases to 15.2%-22.4% in winter, and 17.8%-37.6% in other seasons. The proportion of low cloud increases since summer, and reaches the maximum in late winter and early spring,ranging from 14.5%-56.2%. The proportion of thick cloud is lowest in winter,comparing with other cloud in the same region. It is only 5.3%,with the lowest value of 1.8% in January. It keeps relatively steady from May to November,10.4%-16.3%.
The seasonal average result is also presented in Table 2. The highest proportion is low clouds over the Tibetan Plateau region and south slope of the plateau region in winter,above 40%. High and low clouds have a larger proportion over the South Asian Monsoon region,about 40%. The proportion of high and low clouds are higher over the Tibetan Plateau in spring. The proportion of low clouds is the highest over the south slope of the plateau region. The proportions of high,middle and low clouds are close over the south slope of the plateau region in summer,about 30%. The main cloud types are middle and high clouds over the South Asian Monsoon region. The situation over the Tibetan Plateau region and south slope of the plateau region in autumn is consistent with those in winter,low clouds are more, and high and middle clouds are more over the South Asian Monsoon region.
4 ConclusionsThe height and thickness of different cloud types based on CloudSat data over the Tibetan Plateau,south slope of the plateau and South Asian Monsoon region are analyzed in this study. The main conclusions are as:
1)There are significant differences on frequency of cloud top height per unit area over the three regions in different seasons. The frequency of cloud top height with ranges of 0-6,6-11, and 11-15 km is respectively higher over the Tibetan Plateau region,the south slope of the plateau region than over South Asian Monsoon region. The situation in spring is similar with those in winter. The distribution of cloud top height is continuous within different ranges. The frequency of cloud top height increases significantly in summer. It is higher over the Tibetan Plateau region in 0-9 km than other regions, and higher over South Asian Monsoon region in 9-14 km. The cloud top height is higher over the Tibetan Plateau region in 0-6 km and South Asian Monsoon region in 7-17 km.
2)The frequency of cloud base height per unit area in the range of 0-2 km is highest over the Tibetan Plateau region among the three regions. It is higher over the south slope of the plateau region in the range of 4-9 km in winter and spring, and is higher over the South Asian Monsoon region in winter and spring in the range of 10-14 km. The frequency of cloud base height in the range of 4-12 km is higher over the South Asian Monsoon region in summer and autumn, and the frequency increases significantly in summer.
3)The range of cloud top and cloud base height of different cloud types are different over the regions,but the variation trend of cloud top and cloud base height of the same cloud type is similar. The average high cloud(6.5-9 km),middle cloud(4.5-5.5 km), and thick cloud(4-6 km)heights over the Tibetan Plateau region are lower than those over the other two regions. Seasonal variations are also different in different ranges over different regions. It reaches the lowest in winter,highest in summer. The cloud top and cloud base height over the south slope of the plateau region, and South Asian Monsoon region agree well in summer. The cloud top height of low clouds over the South Asian Monsoon region is lower than those over the other two regions in winter. The cloud base height of low and thick clouds are closer over the three regions,with no significantly seasonal variation.
4)The average thickness of high,middle,low and thick clouds are 1,2,0.97, and 3.8 km,respectively over the Tibetan Plateau region; 1.8,2.5,0.97, and 6.7 km,respectively over the south slope of the plateau region; and 2.1,3,1,9.6 km,respectively over the South Asian Monsoon region. The average thickness of thick cloud is significantly higher than other cloud types,highest over the South Asian Monsoon region(up to 9.6 km,corresponding with stronger convective activity over this region),lowest over the Tibetan Plateau region,lowest in winter and highest in summer. The thickness of high and low clouds is close over the Tibetan Plateau region, and both of them are lower than the thickness of middle cloud. The thickness decreases in accordance with the order of middle,high and low clouds over the south slope of the plateau region and the South Asian Monsoon region, and for seasonal variation,it decreases in winter and increases in summer.
5)Seasonal variations for the proportion of different cloud types are significant over different regions. The proportion of low clouds is higher over the Tibetan Plateau region in winter and autumn,the proportion of middle and low clouds are higher in spring and summer, and the proportion of high clouds remains low(it reaches the peak at about 10% in summer). The proportion of low clouds is the highest in winter,spring and autumn over the south slope of the plateau region,while in summer,high,middle and low cloud proportions are closer, and the proportion of thick cloud is always about 15%. High and low clouds increase in winter over the South Asian Monsoon region,while high and middle clouds increase in other seasons, and the proportion of thick clouds is lower.
Future research will include validations between CloudSat data and ISCCP(International Satellite Cloud Climate Project)cloud amount, and focus on physical and climate characteristics of clouds over the Tibetan Plateau and surrounding regions.
Acknowledgments: We'd like to thank the reviewers for their constructive comments and detailed suggestions on this paper, and thank Dr. Minyan Wang at National Meteorological Information Centre for her carefully revision. This research was funded by National Natural Science Foundation of China(40830102 and 41205016).| Cai Y, Qian ZA, Wu TW,etal., 2004. Distribution, changes of atmospheric precipitation water over Qinghai-Xizang Plateau and its surroundings and their changeable precipitation climate. Plateau Meteorology,23(1):1-10. DOI:10.3321/j.issn:1000-0534.2004.01.001. |
| Feng JM, Liu LP, Wang ZJ, etal., 2001. Comparison of cloud observed by ground based Doppler Radarwith TRMM PR in Qinghai-Xizang Plateau, China. Plateau Meteorology, 20(4):345-353. DOI:10.3321/j.issn:1000-0534.2001.04.001. |
| Feng JM, Liu LP, Wang ZJ, etal., 2002. The statistic characteristics of radar echo and precipitationand some thermodynamic va-riables in Qinghai-Xizang Plateau. Plateau Meteorology, 21(4):368-374. DOI:10.3321/j.issn:1000-0534.2002.04.005. |
| Frey RA, Baum BA, Menzel WP, et al.,1999. A comparison of cloud top heights computed from airborne lidar and MAS radiance data using CO2 slicing. Journal of Geophysical Research, 104:24547-24555. |
| Fu YF, Li HT, Zi Y,2007. Case study of precipitation cloud structure viewed by TRMM Satellite in a valley of the Tibetan Plateau. Plateau Meteorology,26(1):98-106. DOI:10.3321/j.issn:1000-0534.2007.01.012. |
| Huang F, Chen HB, Wang ZH,2003. Analysis of the atmospheric attenuation at 37 GHz and 94 GHz. Remote Sensing Technology and Application, 18(5):269-275. DOI:10.3969/j.issn.1004-0323.2003.05.001. |
| Huang J,Minnis P,Yi Y,et al.,2007. Summer dust aerosols detected from CALIPSO over the Tibetan Plateau.Geophysical Research Letters,34:L18805.DOI:10.1029/2007GL029938. |
| Kahn BH,Chahine MT,Stephens GL,et al., 2008. Cloud type comparisons of AIRS, CloudSat, and CALIPSO cloud height and amount.Atmospheric Chemistry and Physics,8:1231-1248. DOI:10.5194/acp-8-1231-2008. |
| Liu RX, Liu YJ, Du BY, 2002. Cloud climatic characteristics of the Tibetan Plateau from ISCCP data. Journal of Nanjing Institute of Meteorology,25(2):226-232. DOI:10.3969/j.issn.1674-7097.2002.02.013. |
| Mace G, 2007. Level 2 geoprof product process description and interface control document,Version 5.3,44.http://www.cloudsat.cira.colostate.edu/dataICDlist.php?go=list&path=/2B-GEOPROF. |
| Mace GG, Marchand R, Zhang Q,et al.,2007. Global hydrometeor occurrence as observed by CloudSat:Initial observations from Summer 2006.Geophysical Research Letters,34(10):L09808.DOI:10.1029/2006GL029017. |
| Marchand R, Mace GG, Ackerman T, et al.,2008. Hydrometeor detection using CloudSat-An Earth observing 94GHz cloud radar.Journal of Atmospheric and Oceanic Technology,25(4):519-533. |
| QieXS, Ralf T,2003. Lightning activities on Qinghai-Xizang Plateau as observed by satellite-based lightning imaging sen sor.Plateau Meteorology, 22(3):289-295. DOI:10.3321/j.issn:1000-0534.2003.03.013. |
| QiuJH, LvDR, Chen HB, etal.,2003. Modern research progresses in atmospheric physics. Atmospheric Sciences,27:628-652.DOI:10.3878/j.issn.1006-9895.2003.04.14. |
| Stephens GL,TsaySC, Stackhouse JPW, et al., 1990.The relevance of the microphysical and radiative properties of cirrus clouds to climate and climatic feedback. Journal of the Atmospheric Sciences,47:1742-1753. DOI:http://dx.doi.org/10.1175/1520-0469(1990)047%3C1742:TROTMA%3E2.0.CO;2. |
| Stephens GL, Webster PJ, 1981. Clouds and climate:Sensitivity of simple systems.Journal of the Atmospheric Sciences, 38:235-247. DOI:http://dx.doi.org/10.1175/1520-0469(1981)038<0235:CACSOS>2.0.CO;2. |
| Stephensa GL, Vane DG,Boain RJ,et al.,2002. The CloudSat mis-sion and the A-train.Bulletin of the American Meteorological Society, 83:1771-1790. DOI:http://dx.doi.org/10.1175/BAMS-83-12-1771. |
| Tao SY, Chen LS, Xu XD, et al., 1998.Progress in Research on the Theory of Qinghai-Xizang Plateau Meteorology Research (the 2nd edition). Beijing:Meteorological Press. |
| Wang KL, Jiang H, Chen SQ,2001. Cloud cover over Qinghai-Xizang Plateau:comparison among meteorological station observations, ISCCP-C2, and NCEP Reanalysis Data. Plateau Meteorolo-gy,20(3):252-257.DOI:10.3321/j.issn:1000-0534.2001.03.005. |
| Wang Z,Sassen K, 2001. Cloud type and macrophysical property retrieval using multiple remote sensors. Journal of Appllied-Mereology,40:1665-1682. DOI:http://dx.doi.org/10.1175/1520-0450(2001)040<1665:CTAMPR>2.0.CO;2. |
| Wang Z,Sassen K, 2007. Level 2 cloud scenario classification product process description and interface control document, Version 5.0. pp. 50.http://www.cloudsat.cira.colostate.edu/dataICDlist.php?go=list&path=/2B-CLDCLASS. |
| Wei L, Zhong Q,1997. Characteristics of cloud climatology over Qinghai-Xizang Plateau. Plateau Meteorology,16(1):10-15. DOI:10.3321/j.issn:1000-0534.1997.01.002. |
| Weisz E, Li J, Menzel WP, et al., 2007. Comparison of AIRS, MODIS, CloudSat and CALIPSO cloud top height retriev-als.Geophysical Research Letters, 34:L17811.DOI:10.1029/2007GL030676. |
| Ye DZ, GaoYX, 1979.Qinghai-Xizang Plateau Meteorology Re-search. Beijing:Science Press. |
| Zhang CH, Yan MH, Dong WS, et al.,2005.Analyses on atmos-pheric stratification characteristics of thunderstorms over Qinghai-Xizang Plateau. Plateau Meteorology,24(5):741-747. DOI:10.3321/j.issn:1000-0534.2005.05.013. |
| Zhang HF, Guo SG, Zhang YJ, et al., 2003. Distribution characte-ristic of severe convective thunderstorm cloud over Qing-hai-Xizang Plateau. Plateau Meteorology, 22(6):558-564. DOI:10.3321/j.issn:1000-0534.2003.06.005. |
 2016, 8


