 2015, 7
Article Information
- XueXiang Chang, Bing Liu, Hu Liu, ShouBo Li. 2015.
- Water accounting for conjunctive groundwater and surface water irrigation sources: A case study in the middle Heihe River Basin of arid northwestern China
- Sciences in Cold and Arid Regions, 7(6): 687-701
- http://dx.doi.org/10.3724/SP.J.1226.2015.00687
Article History
- Received: February 9, 2015
- Received: February 9, 2015


2. School of Remote Sensing, Nanjing University of Information Science and Technology, Nanjing, Jiangsu 210044, China
1 Introduction
Severe water shortages have been increasing in recent decades, from the dem and s of a rapidly growing human population. These shortages have actually become bottlenecks for economic development in many parts of the world. A systematic approach is needed to underst and how water is being used and how water resource developments will affect present use patterns. One useful approach is the water-accounting procedure introduced by Molden(1997) and subsequently refined by Molden and Sakthivadivel(1999). The Molden-Sakthivadivel procedure analyzes the uses, depletion, and productivity of water in a particular basin, and provides terminology and parameters for describing the uses and productivity of water resources, based on a water-balance approach. This procedure can be applied at all scales of interest, from individual fields to entire regions. It has proved useful for identifying ways of improving water management and productivity while maintaining environmental integrity, and is now being applied in the Philippines, Nepal, Pakistan, India, Sri Lanka, Indonesia, and China(IWMI, 1999; Molden et al.,2001; Renault et al.,2001; Peranginangina et al.,2004).
Oases in arid northwestern China, which in 2001 covered an area of 8.64×10⁴ km2(Shen et al.,2002), play a significant role in the region's economic stability and development. Although oases comprise only 4% to 5% of the region's total area, more than 90% of the population and 95% of the social wealth are concentrated within these areas(Han, 2001). In this region, annual rainfall averages less than 200 mm(excluding areas in the mountains) and less than 50 mm in some places, such as the Ejina Oasis in the Inner Mongolia Autonomous Region, and the Hetian and Tulufan oases in the Xinjiang Uygur Autonomous Region. In addition, pan evaporation, as measured by a 20-cm pan, is often more than 2, 000 mm per year(Cheng et al.,1999); hence, agriculture in these oases depends completely on irrigation. Not less than 70%, and up to more than 86%, of total water use is for irrigation, and these irrigated l and s account for more than 75% of China's grain production(Jia, 2000; Cheng et al.,2004; Chang et al.,2006; Xiong et al.,2010; Zhao et al.,2010). Irrigated agriculture is the primary consumer of water in this region.
In this region, overexploitation of surface water resources has led to serious ecosystem deterioration(Xia et al.,2007; Li et al.,2013). Many inl and river courses(the Heihe, the Shiyang, and the Tarim)have shortened, and terminal lakes have contracted or dried up(Wang and Cheng, 2000; Feng and Cheng, 2001; Zhu et al.,2003). In an attempt to prevent further environmental deterioration, a quantitative rationing of surface water resources was imposed in the middle and lower reaches of the Inl and River Basin. Nevertheless, water resource dem and s continue to increase because of local economic development and sustained growth, especially where groundwater plays a significant role in the overall water balance in central and northern China, just as in northwestern and southern India, parts of Pakistan, much of North Africa, the Middle East, and even the glacial aquifers in the plains region of the United States(Postel, 1999).
Recent reductions in surface water allocations to irrigators have increased the need to improve the management of agricultural water resources. Effective strategies must be formulated to increase agricultural productivity using the same amount of water, or to produce the same yield with less water, while reducing irrigation's environmental impacts(Zwart and Bastiaanssen, 2004). Therefore, losses and non-productive uses of water must be carefully scrutinized to identify potential savings(Peranginangina et al.,2004). In these cases, appropriate hydrogeologic data are unavailable for water-accounting analysis, and must first be synthesized from other hydrologic data before water-accounting techniques can be applied. Consequently, a simple method to estimate such hydrogeologic data with minimal hydrologic inputs, such as the soil water balance model(Allen, 1998), is pivotal in the overall water accounting procedure.
The Pingchuan irrigation district, which lies in the middle of the Heihe River Basin(Figure 1)in arid northwestern China, is a case in point. The Heihe River Basin lies in the middle of the Hexi Corridor. In the basin there are three oases: Zhangye, Jiuquan, and Ejina. The Heihe River is the principal water source for driving economic development and maintaining the environmental balance in these oases. The Heihe River is one of the largest inl and rivers in this region, but overexploitation of its water resources has led to serious environmental consequences, such as environmental degradation, secondary salinization, and desertification(Wang and Cheng, 2000; Feng and Cheng, 2001; Pan and Chao, 2003; Su et al.,2007). In particular, water deficits are becoming a serious problem for local residents who depend on the river for their water. As a result, the extraction of groundwater has increased greatly in recent decades.
 |
| Figure 1 Map of the Pingchuan irrigation district and its location in northwestern China |
The objectives of this study were:(1)to set up an accounting procedure to measure the irrigation water use separately at the field and irrigation-district levels; and (2)to apply the modified water-accounting procedure to evaluate water use in 2007 and 2008, with the goal of seeking opportunities to improve future water management of oases in arid northwestern China, emphasizing the potential role of groundwater in augmenting current water supplies in this region.
2 Materials and methods 2.1 Study areaThe Pingchuan irrigation district(39°18′18.4″N to 39°23′28.0″N, 99°55′42.3″E to 100°11′45.6″E), located in the middle reaches of Heihe River Basin, at Pingchuan town in Linze County, Gansu Province in northwestern China, has a total area of 835 km2, and is one of 36 irrigation districts in the middle of the Heihe River Basin. The l and is largely sandy, being in the Gobi Desert, with agricultural l and accounting for only about 60 km2 of the area. Its altitude ranges from 1, 380 to 1, 400 m a.s.l.. The district's population totals about 20, 000 people. The soil of the arable l and in the district is a greyish-brown desert soil, typically with a sandy loam or sandy texture. The soils vary between 150 cm to 300 cm depth, and are porous and highly permeable(Table 1).
| Soil depth | Soil bulk density | Field capacity | Saturated water capacity |
| (cm) | (g/cm3) | (%, V/V) | (%, V/V) |
| 0-20 | 1.68±0.17 | 13.59±3.09 | 25.42±4.81 |
| 20-40 | 1.74±0.15 | 13.62±2.65 | 24.49±4.81 |
| 40-60 | 1.78±0.13 | 14.51±3.94 | 26.06±4.11 |
| 60-80 | 1.79±0.11 | 12.86±1.30 | 23.34±2.27 |
| 80-100 | 1.83±0.12 | 13.21±2.06 | 23.31±3.75 |
| 100-120 | 1.84±0.12 | 13.38±1.97 | 23.55±3.66 |
| 120-140 | 1.83±0.11 | 13.12±2.04 | 23.53±3.48 |
| 140-160 | 1.84±0.15 | 12.84±2.62 | 23.22±3.71 |
| 160-180 | 1.80±0.19 | 12.76±3.54 | 24.16±3.58 |
| Data were measured in May, 2007. | |||
The study area has an arid, temperate-zone desert climate, dry and windy during the spring and experiencing high temperatures in the summer. According to the 1965-2000 records of the Linze Meteorological Bureau, the mean annual air temperature is 7.6 °C, with the maximum and minimum temperatures of 39.1 °C and −27.0 °C, respectively. The mean annual accumulated number of degree-days above 10.0 °C is 3, 088 °C, and the frost-free period is about 165 days. The mean annual precipitation is 116.8 mm, with rainfall occurring mainly in June, July, and August(80.6% of the annual total). The mean annual pan evaporation measured by a 20-cm pan is 2, 390 mm. During the 2007 and 2008 growing seasons(from March to October), the mean monthly temperatures were 18.1 °C and 19.0 °C, respectively, with corresponding total precipitations of 112.0 and 63.0 mm, and pan evaporations of 1, 536.4 and 1, 762.2 mm(Figure 2).
 |
| Figure 2 Environmental conditions during the 2007 and 2008 growing seasons |
The primary water resources used for irrigation are surface water from the Heihe River and groundwater. There are three reservoirs and 343 pump wells, with water distributed through three canal systems to supply water for agriculture, forestry, and residents. These canals include the Erba, Sanba, and Siba canal systems.
In this irrigation district, the main crops are maize seed production, wheat, tomatoes, cotton, and soybeans. When maize is planted, the farmer usually divides the maize field into strips with 150-cm width, and then plants six rows of female parents and one row of male parents at every strip. The maize is sown in the early part of April every year and is harvested in late September. The amount of maize seeds sown is about 30 kg/ha and the plant density is about 120, 000 plants/ha. For maize fields, the first irrigation is in the early part of May.
Wheat and soybeans are usually planted the same fields in rows. When wheat and soybeans are planted, the farmer usually divides the wheat and soybeans field into alternating 80-cm- and 60-cm-wide strips. Then wheat is planted in 80-cm-wide strips and soybeans are sowed in 60-cm-wide strips. The wheat is sown in the middle of March every year and is harvested in the early part of July. The soybeans are sown in the early part of April every year and are harvested in the early part of September. The amounts of wheat and soybean seeds sown are usually about 300 kg/ha and 75 kg/ha, respectively. For wheat and soybean fields, the first irrigation is in the middle of April.
When tomatoes are planted, the farmer usually divides the tomato field into strips of 120-cm width, and then plants seven ridges of tomatoes 15 cm apart in every strip. The tomato seedlings are planted in late April and tomatoes are harvested in the middle of August. After the tomato seedlings are planted, the first irrigation is immediate.
When cotton is planted, the farmer usually divides the cotton field into strips with 140-cm width, and then plants five ridges of cotton 25 cm apart in every strip. The cotton seed is sowed in late April and cotton is harvested in the early part of October. For the cotton fields, the first irrigation is in the middle of May. After the first irrigation, all crops are irrigated at intervals of about 15 days. Flood irrigation is the only irrigation method.
2.2 Setting up the water-accounting procedureThe Molden-Sakthivadivel water-accounting procedure has proved useful for helping researchers underst and the tradeoffs needed to improve water-use effectiveness in basins where water is scarce(Molden, 1997; Molden and Sakthivadivel, 1999; Molden et al.,2001; Renault et al.,2001). The procedure applies a simple water-balance approach to a given domain over a given time period at different spatial levels(Molden and Sakthivadivel, 1999; Molden et al.,2001). In the original Molden-Sakthivadivel water-accounting examples, it was negligible that farmers relied on groundwater or surface water irrigation(Molden, 1997; Molden et al.,2001). But in arid northwestern China, it was the importance of groundwater that cannot be identified. For the Pingchuan irrigation district, the groundwater and surface water irrigation sources were separated in the water-accounting procedure in order to obtain a more realistic estimate of water availability, and therefore our main emphasis was on the field and district(irrigation service area)levels. At these levels, the water-accounting procedure combines precipitation, soil water, and irrigation water, which extends from the canopy surface to the bottom of the aquifer. At field levels, the water-balance model developed by Allen et al.(1998)was used:
| P + I = ET + Dd + DS + R+ V | (1) |
where
| I = Ws + Wg | (2) |
and P is the precipitation, I is the irrigation, ET is the evapotranspiration from crops, Dd is losses from irrigation via deep drainage, ΔS is the change in soil water storage(for a given simulation period), R is the surface runoff, V is the evaporation from free water surfaces and open l and , and Ws and Wg represent the surface and sub-surface(groundwater)flow into the basin, respectively. All parameters are expressed as mm of water-layer. In this study, surface runoff was omitted because there is usually no runoff in the study area. Because all water that flowed into a field typically infiltrated the soil in less than half an hour, V was also considered to be negligible.
At irrigation-district levels, the water-accounting procedure was built based on field levels, but heterogeneity of soil physical characteristics was not taken into account. All the parameters in the water-balance model were obtained by taking the product of each l and -use type area and the parameters in the water-balance model for the field levels.
2.3 L and -use patterns \At the irrigation-district scale, the l and -use patterns were studied in 2007 and 2008. The base map used was taken from a 1:10, 000 topographic map of the Pingchuan irrigation district created in 2000 by the Gansu Provincial Bureau of Surveying and Mapping. A field survey was then conducted to determine the l and use in each part of 7, 743.9 ha of l and in the study area(part of the oasis), with all plots located by means of real-time differential GPS(eTrex Vista Cx; Garmin, Kansas City, Kansas, USA). The survey data and the base map were transferred into GIS software(ArcGIS Desktop 9.2; ESRI, Redl and s, California, USA). Based on China's l and -use classification system, the survey data were used to create a l and -use map of the Pingchuan irrigation district in the ArcGIS environment, with l and scape patches classified into five categories: farml and (including maize seed, wheat, tomato, watermelon, cotton, and alfalfa production, orchards, and a greenhouse under a plastic canopy), forest(including shelterbelts and belts of shrubs), water areas(including reservoirs and Heihe River corridors), built-up l and , and unused l and (including areas of bare l and and sandy desert). To analyze the use of irrigation water, we investigated both the irrigated farml and and orchards.
2.4 Experimental approach to quantify the water-balance components 2.4.1 Soil water contentTo investigate irrigation water use in the study area, a typical irrigated field for each l and -use and crop type was selected and the soil water content measured during the 2007 and 2008 growing seasons, throughout the soil profile, at intervals of 10 days. Soils were oven-dried at 105 °C to determine the weight of the water so that the water content could be calculated on a mass basis. In the cropl and , the soil was measured to a depth of 120 cm below the surface; in orchards, to a depth of 180 cm because of the deeper roots of the trees. In each plot, three soil sampling points were used. An Edelman soil auger with a 5-cm diameter was drilled vertically into the soil and collected the soil in 20-cm increments. The samples were stored in 5-cm-diameter aluminum boxes until they were oven-dried. The average of three replications for soil moisture content was used to represent the soil moisture content for each soil layer in all subsequent analyses. Soil water-storage(Ws, mm)was calculated as:
| $[\mathop W\nolimits_s = \sum\limits_{i = 1}^K {({S_i}{P_S}/{P_w})} \mathop H\nolimits_i $ | (3) |
where Si (g/g)is the soil moisture content in the i-th soil layer, k is the number of soil layers, ρs and ρw are the soil bulk density and water density(g/cm3), respectively, and Hi(mm)is the thickness of the i-th soil layer.
2.4.2 Precipitation, irrigation, and deep drainagePrecipitation data were obtained from the records of the Pingchuan Meteorological Station. These data were used to calculate rainfall volumes for the irrigation district sites.
In the Pingchuan irrigation district, farmers use conventional flat planting with flood irrigation, and the irrigation water comes both from the Heihe River(surface water) and from shallow groundwater. The irrigation quantity was determined using two methods. If the irrigation water came from surface water, the irrigation quantity was the quantity of water the farmer bought from the local water resource management office. If the irrigation water came from groundwater(pumped from a well), the quantity was calculated as follows:
| Wg = Q ×t | (4) |
where Wg(m3)is the irrigation water quantity, Q is the efficiency of the pump(7.5 kW, 50 m3/h), namely, water flow per unit time from the pump after the pump began running, and t is duration of the pumping of the groundwater.
Deep drainage was defined as the downward movement of soil water below the rooting depth of the plants. In theory, the maximum soil water-storage capacity of a given volume of soil equals its saturated water-storage capacity. Thus, deep drainage(Dd, mm)was estimated as follows:
| Dd =(I + P)- W | (5) |
| $\mathop W\nolimits_{sws} = \sum\limits_{i = 1}^k {\left( {{S_{Si}}{P_S}/{P_W}} \right)} \mathop {Hi}\nolimits_{} $ | (6) |
where Wsws(mm)is the saturated water storage, Ssi is the saturated water capacityof the i-th soil layer, and k is the number of soil layers.
If Dd >0, then Dd represents a downward movement of soil water after irrigation or rain.
2.5 Performance indicatorsWater-accounting performance indicators can be summarized in the form of the net depleted fraction(DFnet) and in terms of the productivity of water(Molden, 1997):
| $D{F_{net}} = \frac{{\sum\limits_{i = 1}^n {E{T_i}} }}{{\sum\limits_{i = 1}^n {{W_{NIi}}} }}$ | (7) |
wherei is i-th irrigated crop during the growing season, ETi is the crop evapotranspiration calculated in the time interval between an irrigation and the next irrigation; WNIi is the net inflow(i.e., the gross inflow less the change in storage over the time period of interest)within the domain during the i-th irrigated crop.
The productivity of water(PW, CNY/m3)can be related to the economic value of the production of crops or other goods(PC, CNY)per unit volume of water, as follows:
| PW = PC /(ET+ Dd) | (8) |
The crop yields were measured when each crop was harvested. To measure these yields, five sample plots were used as replications for each typical crop. To calibrate this yield, actual yield data were obtained from 40 local farmers at the same time as our sampling. The water productivity was then calculated according to local market prices. To avoid the effect of fluctuating economic value numbers, the economic values were calculated based on the commodity prices in 2007.
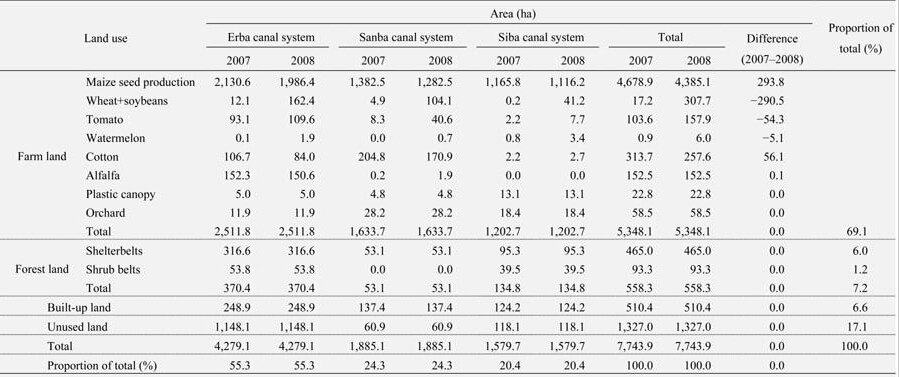
3 Results 3.1 L and use at the irrigation-district scaleIn the Pingchuan irrigation district during the study period, 7, 743.9 ha of the l and were suitable for agriculture, shelterbelts to protect crops, or environmental improvement(e.g., reforestation), as shown in Table 2 and Figure 3. These data include 4, 279.1 ha in the Erba canal system, 1, 885.1 ha in the Sanba canal system, and 1, 579.7 ha in the Siba canal system, accounting for 55.3%, 24.3%, and 20.4%, respectively, of the total irrigated l and in the district. In this district, farml and accounted for 69.1% of the total, mainly for maize seed production. Other l and uses accounted for smaller proportions of the total area. Because of the influence of both markets and management costs, the areas planted for maize seed production and cotton production declined in 2008, to 293.9 ha and 56.1 ha less, respectively, than in 2007. However, the areas planted with wheat, tomatoes together with soybeans, and watermelon increased in 2008 by 290.6, 54.3, and 5.1 ha, respectively, compared with the 2007 values(Table 2).
 |
| Figure 3 Field-level water-accounting results for the Pingchuan irrigation district in 2007 and 2008 |
At the field level, the Allen model was used to account for water use, with a monthly time step from April to October in 2007 and 2008. Table 3 shows the model output.
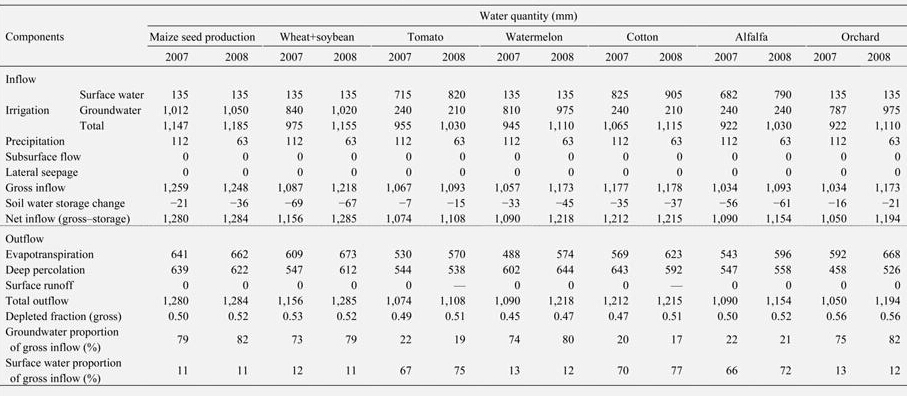 |
In the Pingchuan irrigation district, farmers grow mainly maize, wheat and soybeans, watermelon, tomatoes, cotton, and alfalfa, but some farml and includes orchards. Table 3 shows that for maize seed production, wheat plus soybeans, watermelon, and orchards, the irrigation water came mainly from groundwater, and that groundwater accounted for between 73% and 82% of gross inflow for these crops. The irrigation water for the tomatoes, cotton, and alfalfa came mainly from surface water, which accounted for between 66% and 77% of the gross inflow. Due to the low amount of precipitation in 2008(63 mm, slightly more than half the precipitation in 2007), irrigation of some crops was greater than in 2007. For all crops, nearly half of the irrigation and rainwater was depleted, leading to depleted fractions ranging from 0.45 to 0.56 due to the relatively high amounts of deep percolation.
3.3 Water accounting at the irrigation-district levelIn the Pingchuan irrigation district, water inflows totaled 6.73×10⁷ and 6.99×10⁷ m3 in 2007 and 2008, respectively(Table 4). The inflows consisted of irrigation, precipitation, and soil water, which accounted for 89.3%, 8.9%, and 1.8% of the total, respectively, in 2007, versus 89.3%, 4.8%, and 5.9% in 2008. The irrigation was based mainly on groundwater, which accounted for 82.1% and 83.6% of the total irrigation water in 2007 and 2008, respectively. Most of the groundwater irrigation flowed to the canal systems. In 2007 and 2008, the Erba canal system obtained 80.4% and 83.7% of its total irrigation water from groundwater, versus 80.1% in both years for the Sanba canal system and 88.0% for the Siba canal system. The irrigation requirement was 2.30×10⁶ m3 greater in 2008 than in 2007. Due to the relatively high amounts of deep percolation, the depleted fractions were 0.51 in 2007 and 0.55 in 2008.
 |
Water outflows consisted chiefly of evapotranspiration from the crops and soil, and deep percolation. In 2007 and 2008, evapotranspiration totaled 3.36×10⁷ m3 and 3.64×10⁷ m3, respectively, with corresponding deep percolation values of 3.37×10⁷ m3 and 3.35×10⁷ m3. Deep percolation therefore accounted for 50.1% and 47.9% of the water outflows, respectively.
3.4 Water productivityIn the Pingchuan irrigation district, the production of crop species varied widely during the study period.To compare the water productivity of the different crops, the economic value of the production was therefore taken into account. Table 5 summarizes the investments and income for each crop. The investment was highest for watermelon and lowest for alfalfa.
| L and use | Investment(CNY/ha) | Production value(CNY/ha) | Net income(CNY/ha) | Return on investment(%) | |||||
| Water | Fertilizer | Plastic film | Seed | Pesticides | Total | ||||
| Maize seed production | 1, 200 | 4, 335 | 735 | 690 | 375 | 7, 335 | 17, 385 | 10, 035 | 136.8 |
| Wheat+soybean | 975 | 2, 970 | 0 | 936 | 0 | 4, 890 | 16, 380 | 11, 490 | 235.0 |
| Cotton | 975 | 3, 480 | 825 | 555 | 0 | 5, 835 | 15, 090 | 9, 255 | 158.6 |
| Tomato | 975 | 2, 910 | 918 | 570 | 0 | 5, 370 | 30, 720 | 25, 350 | 472.1 |
| Alfalfa | 975 | 750 | 0 | 0 | 0 | 1, 725 | 6, 750 | 5, 025 | 291.3 |
| Watermelon | 975 | 4, 500 | 675 | 1, 800 | 0 | 7, 950 | 27, 000 | 19, 050 | 239.6 |
| Orchard | 975 | 5, 250 | 450 | 525 | 375 | 7, 575 | 30, 000 | 22, 425 | 296.0 |
| * Water investment includes both surface water purchased and groundwater pumped. The surface water price is 0.2 CNY per m3. The groundwater itself is free, but the costs of electricity and labor for pumping and well maintenance and operation, come to about 4.5 CNY per hour. | |||||||||
The water productivity differed greatly among the crops but did not change greatly between the study years(Figure 4), although it decreased slightly in 2008 for some crops, primarily because of increased irrigation water costs in that drier year. The water productivity was highest for tomatoes, at 2.86 and 2.77 CNY/m3 in 2007 and 2008, respectively. The water productivity was lowest for cotton, at only 0.62 and 0.58 CNY/m3 in 2007 and 2008, respectively. The area planted for maize seed production accounted for more than 80% of the total agricultural l and , but its water productivity values were only 1.36 and 1.35 CNY/m3 in 2007 and 2008, respectively. For the irrigation district as a whole, the water productivity averaged only 1.37 CNY/m3 in both years.
 |
| Figure 4 Water productivity of crops in 2007 and 2008. A: Maize seed production; B: Wheat+soybeans; C: Tomatoes; D: Watermelon; E: Cotton; F: Alfalfa; G: Orchards; H: Irrigation district total |
The reliability of water availability estimates depends on the accuracy of individual water-balance components. In the original Molden-Sakthivadivel water-accounting examples, it was negligible that farmers relied on groundwater or surface water irrigation(Molden, 1997; Molden et al.,2001). And it was the importance of groundwater that cannot be identified, and this can only be ignored if groundwater exploitation is negligible. In our study, however, groundwater use was a major factor; it can only be ignored if groundwater exploitation is negligible. In our case, the groundwater and surface water irrigation sources were separated in the water-accounting procedure in order to obtain a more realistic estimate of water availability. Groundwater irrigation reached 82.1% and 83.6% of total irrigation in 2007 and 2008, respectively, showing that groundwater components played an important role in the overall water balance, and that in this basin explicit analysis of groundwater is critical. However, water should not be extracted beyond the limit set by the available water, to avoid depletion of this resource. According to the stated justification for the official limit provided by the local water resource management office, the available water in the Pingchuan irrigation district totals 7.66×10⁷ m3, comprising 5.76×10⁷ m3 of surface water and 1.90×10⁷ m3 of groundwater. Of this total, only 6.43×10⁷ m3 is available for agriculture, so that a stable level of local groundwater can be maintained and the local ecosystem can be protected.
Individual farmers, however, consider only the economic angle, and the actual agricultural water use was 6.73×10⁷ m3 in 2007 and 6.99×10⁷ m3 in 2008 based on the Molden-Sakthivadivel water-accounting method. The quantity of groundwater extracted was 4.93×10⁷ m3 in 2007 and 5.22×10⁷ m3 in 2008, more than twice the limit defined by the available groundwater formulae. This excessive extraction caused the depth of the groundwater to increase alarmingly. In Linze County(the irrigation district for this region), the groundwater pumping area where the groundwater depth was between 0 m and 4 m decreased from 511.59 km2 in 1986 to 174.58 km2 in 2010 —a drop of 65.88%; the area where the groundwater depth was 6.0 m or more increased 118.01% —from 758.49 km2 in 1986 to 1, 653.78 km2 in 2010(Wang and Chang, 2013).
These changes are likely to have an adverse effect on the growth and development of the vegetation that shelters the farml and against damage from s and storms and dry winds. According to surveys from the Zhangye Forestry Bureau of Gansu Province, China, the area of ecological forest death has reached more than 6, 000 ha in the middle of the Heihe River Basin, where an ecological forest was built up in the mid-1980s. By the end of 2008, desertified l and had extended to 7.82×10⁵ ha, up from 7.21×10⁵ ha in 2000, adding 0.61×10⁵ ha. Clearly, the stability of the oasis is compromised when excessive pumping causes the groundwater level to fall. The situation is even more serious now, when groundwater storage is needed to supplement the surface water supply. Groundwater depletion in the middle of the Heihe River Basin could threaten both the environment and the economy.
Clearly, a more realistic approach is needed, either to increase agricultural productivity using the same amount of water, or to produce the same yields with less water. In other words, it is necessary to conserve water resources and /or improve water use efficiency while reducing the environmental impacts of these human activities(Zwart and Bastiaanssen, 2004). Such an approach is the best way to provide enduring, sustainable development of local economies and improve individual farmers' economic security. During the time span of this study, crop water productivity was lower than normal, averaging only 1.37 CNY/m3 in both years. Nevertheless, Zwart and Bastiaanssen(2004)reported that globally measured average crop water productivities were 2.30, 1.84 and 3.42 CNY/m3(1.09, 0.23, and 1.80 kg/m3)for wheat, cotton, and maize, respectively. Singh et al.(2006)used the SWAP model to produce a water productivity analysis of the 4, 270-km2 Sirsa district in India, indicating an average water productivity of 2.18 CNY/m3(1.04 kg/m3)for wheat and 1.68 CNY/m3(0.21 kg/m3)for cotton. Huang and Li(2010)found the average crop water productivities were 2.14, 2.05, and 3.30 CNY/m3 for wheat, maize, and soybeans, respectively, in the breadbasket basins of China. In the Yellow River Basin in China, the mean water productivities for irrigated maize, wheat, and soybeans were 1.94, 2.78, and 1.56 CNY/m3, respectively(Cai et al.,2011).
If crop water productivity is to be enhanced, there are two methods, as mentioned above, that could raise agricultural yields and reduce agricultural water consumption. However, crop yield is affected by many factors besides soil moisture, including the type of seeds, soil fertility, tillage systems, and weather(Rieger et al.,2008). In this region, agriculture is completely dependent on irrigation and chemical fertilizer use is widespread, exacerbating the problem of groundwater contamination by NO3−−N(Yang and Liu, 2010). Furthermore, agricultural production has a long history in the area and farmers here farm intensively, disregarding limiting factors like soil moisture, soil fertility, and tillage systems. Hence, the agricultural yields are already at their maxima and cannot be further increased.
Therefore, the only way to improve the situation here is to reduce agricultural water consumption without causing water stress for the crops, thereby significantly increasing crop water productivity. The Molden-Sakthivadivel water-accounting method— combining groundwater and surface water into a single domain— can provide a good estimate of the uses, depletion, and productivity of water in a water basin context(Molden and Sakthivadivel, 1999; Molden et al.,2001; Renault et al.,2001; Peranginangina et al.,2004). In arid northwestern China, because the farmers use flood irrigation and the soil is a highly permeable sandy loam, the annual agriculture water use is larger than in other areas(Liu et al.,2002; Utset et al.,2004; Hu et al.,2007). In this dry region, the amount of irrigation must increase to support optimal crop growth and production, but this approach inevitably decreases crop water productivity(Kang et al.,2009). In the Pingchuan irrigation district, for example, irrigation use has increased in order to offset the low precipitation; the total irrigation amount was more than 900 mm(Table 3)during the study years. For cotton, irrigation levels for the field-level water accounting were 1, 212 mm and 1, 215 mm during the 2007 and 2008 growing seasons, respectively, compared to 577 mm for the Bhakra system in India(Molden, 1997).
Extremely deep percolation is another major factor in low water productivity in this region, accounting for 50.1% and 47.9% of the water outflows in 2007 and 2008, respectively. There is clearly a need for a method that will significantly reduce the irrigation water levels, which will in turn lead to a less amount of deep percolation.
Another factor is the size of the irrigation unit. According to a study by Su et al.(2002)in the Zhangye oasis, irrigation volume was 1, 200-1, 275 m3/ha per time by flood irrigation when the irrigation unit was 1 ha farml and , whereas it was 900-975 m3/ha per time when the irrigation unit was 0.5 ha of farml and . Hence, it is clear that irrigation can be reduced on a small irrigation unit. Those researchers advised using a 0.03-ha area for each irrigation plot and irrigating only during the key crop growth development periods. For example, wheat could be irrigated in the trefoilstage, the tilling and elongating stage, the booting stage, and the filling stage; maize could be irrigated in the early jointing stage, the heading stage, and the filling stage(Su et al.,2002).
Still another factor is the actual irrigation method. Kang et al.(2000)studied alternate furrow irrigation, in which each of two neighboring furrows was alternately irrigated during consecutive watering; this method generated a high grain yield with up to 50% reduction in irrigation amounts.
These are two examples of how to save agricultural water in arid areas. Implementation of such methods can increase the likelihood that irrigation time and irrigation quotas can be decreased. According to the irrigation scheduling provided by Su et al.(2002) and the irrigating pattern provided by Kang et al.(2000), the water productivity could be increased by 90% and 87% for maize, and by 74% and 87% for cotton in this region, respectively. To improve water saving and conservation in irrigated agriculture, Horst et al.(2007)found that the best irrigation cotton water productivity(0.61 kg/m3)was achieved with surge-flow on alternate furrows, which reduced irrigation water use by 44%(390 mm) and led to near 85% application efficiency in the Central Fergana Valley of Uzbekistan. Ahmadi et al.(2010)measured yield and water productivity of potatoes grown in coarse s and , loamy s and , and sandy loam with full, deficit, and partial root-zone drying irrigation strategies imposed; the deficit and partial root-zone drying irrigation strategies received 65% of the full irrigation strategies. They found that the deficit and partial root-zone drying irrigation treatments increased water productivity 11% and 5% in coarse s and and 28% and 36% in sandy loam compared to full irrigation, respectively. Also, by increased surface runoff and reduced infiltration at Melkawoba in the Central Rift Valley of Ethiopia, the rainfed maize water productivity reached between 0.60 kg/m3 and 0.48 kg/m3 using a different plowing pattern(Temesgen et al.,2012).
Water depletion is another key concept in water accounting, because productivity is measured by the derived benefits per unit of water depleted(Molden, 1997). In that study, water depletion consisted chiefly of evapotranspiration from the crops and soil, and deep percolation. Crop evapotranspiration is an important component of ecosystem water balance and is strongly related to gross ecosystem production in terrestrial vegetation(Law et al.,2002). Depletion can actually be beneficial if it produces a good or fulfills a need. Deep percolation, however — as opposed to evapotranspiration from crops — is not beneficial within a basin. Therefore, if crop water productivity is to be improved, deep percolation must be reduced. In our study, evapotranspiration rates varied between 488 mm and 668 mm, depending on the crop, during the growing seasons of 2007 and 2008. Those evapotranspiration rates appeared to be close to the range found for maize by Zhao et al.(2010), and were lower than the reference crop evapotranspiration results by radiation calibration of the FAO56 Penman-Monteith model in the same area, where the reference crop evapotranspiration rates were from 700 to 900 mm per year during 1971-2000(Yin et al.,2008). In our study area evapotranspiration totaled 3.36×10⁷ m3 and 3.64×10⁷ m3 at the irrigation-district level in 2007 and 2008, with corresponding deep percolation values of 3.37×10⁷ m3 and 3.35×10⁷ m3, respectively. Deep percolation therefore accounted for 50.1% and 47.9% of the water outflows, respectively(Table 4). This is also a major reason for the low water produc tivity values we obtained(Figure 4).
5 ConclusionsWe used the Molden-Sakthivadivel water-accounting procedure to analyze the water-use patterns and identify opportunities for improving water management within the Pingchuan irrigation district of the Heihe River Basin. In the study area, the inflow water resources consisted of irrigation, precipitation, and soil water, which accounted for 89.3%, 8.9%, and 1.8%, respectively, of the total inflows in 2007, versus 89.3%, 4.8%, and 5.9% in 2008. Irrigation was based mainly on groundwater, amounting to 82.1% and 83.6% of the total irrigation water in 2007 and 2008, respectively. Water outflows were the sum of evapotranspiration from crops and soil, and deep percolation. In 2007 and 2008, deep percolation accounted for 50.1% and 47.9% of the water outflows, respectively, resulting in corresponding depleted fractions of 0.51 and 0.55. For the irrigation district as a whole, water productivity averaged only 1.37 CNY/m3.
To significantly increase crop water productivity and prevent depletion of the region's aquifer, it will be necessary to reduce the amount of water used for irrigation. This will require the region's farmers to change their agricultural practices and reduce the amount of irrigation. For example, farmers could adopt a ridge-planting and furrow-irrigation system combined with the use of plastic row covers, and could use 0.03-ha irrigation plots. In addition, using different mulches and limiting irrigation can control the soil water deficit at certain stages of crop growth, which would also reduce evaporation from the soil.
The government should continue to increase its infrastructure support for agriculture by building collective pressurized water distribution networks and a solid-set sprinkler irrigation system in this area. These improvements would provide farmers with greater flexibility, allowing them to adjust water application to crop water requirements, resulting in economic, environmental, and social benefits. Only in this way will groundwater levels remain stable, sustaining both agriculture and the shelterbelt vegetation, and protecting the economic and environmental stability of the oases.
Acknowledgments:This study was funded by the National Natural Science Foundation of China(Project 40771079 and 41471024). We thank the journal's anonymous reviewers for their critical reviews and comments on this manuscript.
| Ahmadi SH, Andersen MN, Plauborg F, et al., 2010. Effects of irrigation strategies and soils on field grown potatoes: Yield and water productivity. Agricultural Water Management, 97: 1923–1930. |
| Allen RG, Pereira LA, Raes D, et al., 1998. Crop evapotranspiration: Guidelines for computing crop water requirements. FAO Irrigation and Drainage Paper 56, Food and Agriculture Organization of the United Nations, Rome, pp. 293. |
| Cai X, Yang YE, Ringler C, et al., 2011. Agricultural water prod-uctivity assessment for the Yellow River Basin. Agricultural Water Management, 98: 1297–1306. |
| Chang X, Zhao W, Zhang Z, et al., 2006. Sap flow of the Gansu poplar shelterbelt in arid region of northwest China. Agricul-tural and Forest Meteorology, 138: 132–141. |
| Cheng G, Xiao D, Wang G, 1999. On the characteristics and building of landscape ecology in arid area. Advances in Earth Sciences, 14(1): 11–15. |
| Cheng R, Kang E, Zhao W, et al., 2004. Estimation of tree trans-piration and response of tree conductance to meteorological variables in desert-oasis system of northwest China. Science in China (Ser. D: Earth Sciences), 47(Supp. 1): 9–20. |
| Feng Q, Cheng G, Endo KN, 2001. Towards sustainable develop-ment of the environmentally degraded River Heihe basin, China. Hydrological Sciences Journal, 46(5): 647–658. DOI: 10.1080/0262666010949. |
| Han DL, 2001. Type, area and distribution of oasis. In: Artificial Oases of Xinjiang. Beijing: Chinese Environmental Sciences Press, pp. 21–32. |
| Horst MG, Shamutalov SS, Goncalves JM, et al., 2007. Assessing impacts of surge-flow irrigation on water saving and produc-tivity of cotton. Agricultural Water Management, 87: 115–127. |
| Hu SJ, Song YD, Tian CY, et al., 2007. Suitable scale of Weigan River plain oasis. Science in China (Ser. D: Earth Sciences), 50: 56–64. |
| Huang F, Li B, 2010. Assessing grain crop water productivity of China using a hydro-model-coupled-statistics approach, Part I: Method development and validation. Agricultural Water Man-agement, 97: 1077–1092. |
| International Water Management Institute (IWMI), 1999. Development of effective water management institutions. Inception Report and Work Plan. International Water Management Institute, Colombo, Sri Lanka, pp. 73. |
| Jia B, 2000. Review and problems of oasis research. Advance in Earth Sciences, 15(4): 381–388. |
| Kang S, Liang Z, Pan Y, et al., 2000. Alternate furrow irrigation for maize production in an arid area. Agricultural Water Manage-ment, 45: 267–274. |
| Kang Y, Khan S, Ma X, 2009. Climate change impacts on crop yield, crop water productivity and food security: A review. Progress in Natural Science, 19: 1665–1674. |
| Li X, Wang Y, Liu L, et al., 2013. Effect of land use history and pattern on soil carbon storage in arid region of central Asia. PLoS ONE, 8(7): e68372. DOI: 10.1371/journal.pone.0068372. |
| Liu CM, Zhang XY, Zhang YQ, 2002. Determination of daily evaporation and evapotranspiration of winter wheat and maize by large-scale weighing lysimeter and micro-lysimeter. Agri-cultural and Forest Meteorology, 111: 109–120. |
| Molden D, 1997. Accounting for Water Use and Productivity. SWIM Paper 1, International Water Management Institute, Colombo, Sri Lanka, pp. 1–25. |
| Molden D, Sakthivadivel R, 1999. Water accounting to assess use and productivity of water. Water Resources Development, 15: 55–71. |
| Molden D, Sakthivadivel R, Habib Z, 2001. Basin-level use and productivity of water: Examples from South Asia. Research Report 49, International Water Management Institute, Colombo, Sri Lanka. |
| Pan X, Chao J, 2003. Theory of stability, and regulation and con-trol of ecological system in oasis. Global Planet Change, 37: 287–295. |
| Peranginangina N, Sakthivadivel R, Scott NR, et al., 2004. Water accounting for conjunctive groundwater/surface water management: Case of the Singkarak-Ombilin River basin, Indonesia. Journal of Hydrology, 292: 1–22. |
| Postel S, 1999. Pillar of Sand: Can an Irrigation Miracle Last? London: W.W. Norton, pp. 1–30. |
| Renault D, Hemakumara M, Molden D, 2001. Importance of water consumption by perennial vegetation in irrigated areas of the humid tropics: Evidence from Sri Lanka. Agricultural Water Management, 46: 215–230. |
| Rieger S, Richner W, Streit B, et al., 2008. Growth, yield, and yield components of winter wheat and the effects of tillage intensity, preceding crops, and N fertilization. European Journal of Agronomy, 28: 405–411. |
| Shen Y, Wang J, Wu G, 2002. Oases as well as their sustainable development and constructions in China. Journal of Arid Land Resources and Environment, 16(1): 1–8. |
| Singh R, van Dam JC, Feddes RA, 2006. Water productivity analysis of irrigated crops in Sirsa district, India. Agricultural Water Management, 82: 253–278. |
| Su P, Du M, Zhao A, et al., 2002. Study on water requirement law of some crops and different planting mode in oasis. Agricultural Research in the Arid Areas, 20(2): 79–85. |
| Su Y, Zhao W, Su P, et al., 2007. Ecological effects of desertification control and desertified land reclamation in an oasis–desert ecotone in an arid region: A case study in Hexi Corridor, northwest China. Ecological Engineering, 29: 117–124. |
| Temesgen M, Savenije HHG, Rockstr?m J, et al., 2012. Assessment of strip tillage systems for maize production in semi-arid Ethiopia: Effects on grain yield, water balance and water productivity. Physics and Chemistry of the Earth, 47–48: 156–165. |
| Utseta A, Farréc I, Martí?nez-Coba A, et al., 2004. Comparing Penman-Monteith and Priestley-Taylor approaches as reference-evapotranspiration inputs for modeling maize water-use under Mediterranean conditions. Agricultural Water Management, 66: 205–219. |
| Wang G, Cheng G, 2000. The characteristic of water resources and the changes of the hydrological process and environment in the arid zone of northwest China. Environmental Geology, 37(7): 783–790. |
| Wang J, Chang X, 2013. Change trend of the groundwater depth in Linze County in the middle reaches of Heihe River Basin in recent 30 years. Arid Zone Research, 30(4): 594–602. |
| Xia J, Zhang L, Liu CM, et al., 2007. Towards better water security in North China. Agricultural Water Management, 21: 233–247. |
| Xiong W, Holman I, Lin E, et al., 2010. Climate change, water availability and future cereal production in China. Agriculture, Ecosystems and Environment, 135: 58–69. |
| Yang R, Liu W, 2010. Nitrate contamination of groundwater in an agroecosystem in Zhangye Oasis, northwest China. Environ-mental Earth Science, 61: 123–129. |
| Yin Y, Wu S, Zheng D, et al., 2008. Radiation calibration of FAO56 Penman-Monteith model to estimate reference crop evapo-transpiration in China. Agricultural Water Management, 95: 77–84. |
| Zhao W, Liu B, Zhang Z, 2010. Water requirements of maize in the middle Heihe River Basin, China. Agricultural Water Man-agement, 97: 215–223. |
| Zhu Q, Ren J, Wang J, et al., 2003. River diversions for ecological restoration in inland river of China. China Water Resources, B03: 49–51. |
| Zwart SJ, Bastiaanssen WGM, 2004. Review of measured crop water productivity values for irrigated wheat, rice, cotton and maize. Agricultural Water Management, 69: 115–133. |