Article Information
- XiuJuan Zhang, ShiYin Liu, Li Liu. 2015.
- Moraine-dammed glacial lake changes during the recent 40 years in the Poiqu River Basin, Himalayas
- Sciences in Cold and Arid Regions, 7(6): 654-665
- http://dx.doi.org/10.3724/SP.J.1226.2015.00654
Article History
- Received: July 26, 2015
- Accepted: September 25, 2015
2. University of Chinese Academy of Sciences, Beijing 100049, China
1 Introduction
The 5th Assessment Report by the Intergovernmental Panel of Climate Change(IPCC AR5)noted that global warming has been observed both on l and and ocean surface at a rate of 0.85 [0.65 to 1.06] °C/a, over the period of 1880-2012(IPCC, 2013). As an indicator of widespread warming, most glaciers around the world have retreated since the end of the Little Ice Age(Liu and Sharma, 1988). Although there is no explicit classification for the formation of glacier dammed lakes in a macro perspective, moraine-dammed glacial lakes are extended mainly by melting glaciers, seasonal ice, snow cover and precipitation(Huss et al.,2007; Wang, 2008). As glaciers gradually retreat, moraine-dammed glacial lakes increase in quantity and range, which has an effect on human life, property, politics, and economics in the local area. The potential outcome, which are known as Glacial Lake Outburst Floods(GLOFs)can occur from the Himalayas to the Andes in South America(Sakai et al.,2000). In July 11, 1981 the outburst flood of Lake Cirenmacuo in the Zhangzangbo tributary of Poiqu River, which occupies the valley section from Zhangzangbo tributary in China to the town of Sun Koshi in Nepal, damaged No. 707 Bridge at the mouth of Zhangzangbo tributary, the Friendship Bridge, the China-Nepal Highway and Sun Koshi Hydroelectric Station in Nepal. This outburst destroyed numerous buildings and farml and , causing nearly 200 deaths(Chen et al.,2013). In May 23 and June 29, 2002 two tremendous debris flows occurred in Chongduipu tributary, caused by Lake Jialongco moraine dam failure, which damaged the newhydropower station in Nyalam and National Highway No. 318(Chen et al.,2006).
Underst and ing the formation, changes, evaluation and predicting the potential hazards of glacial lakes are of practical significance for safety and development of local regions. Remote sensing techniques have proved to be quick and accurate, supplemented with traditional in-situ observations and monitoring of lake dynamics. For instance, Huggel et al.(2002)used a normalized difference water index(NDWI)based on Landsat TM and SPOT data with the assistance of Digital Elevation Model(DEM)for glacial lake change detection in the Swiss Alps in order to estimate potential flood distance based on empirical relations. Vilímek et al.(2005)described outburst floods of glacial lakes in the Cordillera Blanca Mountains, Peru, and evaluated the potential threat compared to the intensity of former recorded floods. They also analyzed time series of field mapping and satellite images of Landsat and SPOT to study glacial retreat surrounding Palcacocha Lake and geomorphological and hydrogeological conditions. Bolch et al.(2008)presented a comprehensive approach by coupling remote sensing, topographic and geomorphometric analyses aided by ASTER DTM for the identification of potentially dangerous glacial lakes in the Mt. Everest region from 1962 to 2003 with an innovative semi-automatic normalized difference water index(NDWI). Bajracharya and Mool(2009)identified potentially dangerous glacial lakes in the Mou nt Everest region, Nepal, based on topographic maps and Landsat MSS, TM, ETM+ and ALOS from 1960 to 2007, and according to analysis of glacier and glacial lake activity and field observations. Babu Govindha Raj(2010)applied Landsat MSS, TM, ETM+ and IRS P6 together with topographic map of 1:250, 000 scale and ASTER DEM to calculate the area and depth of a glacial lake in Reru Valley, Zanskar Himalaya. They then estimated peak discharge based on empirical formulae, which provides the remote sensing techniques to detect and monitor glacial lakes. Ashraf et al.(2012)summarized 35 destructive recorded floods and revealed the formation and changes of 2, 420 glacial lakes in the Hindukush-Karakoram-Himalaya(HKH)region of Pakistan by applying remote sensing technology including 11 Landsat ETM+ images for the period of 2000-2001 and digital topographic map published in 1996 together with DEM. They also identified potentially dangerous glacial lakes based on several factors, such as the distance to the glacier, the type of glacial lake and its dam, and the area.
Chinese scientists investigated glacial lake changes and potential outburst floods in areas such as the Himalaya mountainous region and the Tibetan Plateau, focusing on glacier retreat together with potential dangers of glacial lakes(Shen et al.,2004; Che et al.,2005). Che et al.(2004)inventoried glaciers and glacial lakes in the Pumqu River Basin and their trends based on 1980s topographic maps and 2000/2001 ASTER images with the assistance of CBERS images, establishing a criterion for identifying potentially dangerous glacial lakes among the existing 225 glacial lakes. Chen et al.(2007)selected 1985/1986 Landsat MSS and 2000/2001 Landsat TM as the base maps in the Poiqu River Basin, which were applied to interpretation of false color composites at certain b and widths for glaciers and glacial lakes, respectively, after image matching and geographic registration. They pointed out that decreasing areas of glaciers and increasing numbers and areas of glacial lakes would prompt the risk of debris flows or floods from collapse and overtopping of moraine dams(Chen et al.,2007). Ye et al.(2008)chose 1974 topographic maps, 1990 Landsat TM, 1999/2000 Landsat ETM and 2003 ASTER images for analyzing the trends of glaciers and glacial lakes changes in the Mapam Yumco Basin. Their results indicated that glacial area decreased to 100.39 km2 from 1974 to 2003, and glacial lake area also decreased over the past 30 years owing to a decrease in precipitation and an increase in evaporation(Ye et al.,2008). Wang et al.(2015)created a glacial lake inventory of 2010 in the Poiqu River Basin, which were classified as glacier-fed lakes and non-glacier-fed lakes and analyzed the relationship with climate regimes compared with other regions of the Hindukush-Himalayas.
Therefore, this paper aims to apply remote sensing and GIS technology for supplementary and updated analysis of moraine-dammed glacial lakes and corresponding glacier changes from 1974 to 2014. This is based on an automated mapping scheme of hierarchical image segmentation and terrain analysis in response to climate change with the assistance of meteorological analysis. Due to typical characteristics of lake-terminating glaciers, and importance of geopolitical and international trade center in South Asia, the Poiqu River Basin was chosen as the study area. As for the present study of glacial lakes, the focus is on the further analysis of typical or potentially dangerous glacial lakes using remote sensing technology and empirical relations among water depth, storage capacity and lake area of moraine-dammed glacial lakes in the Poiqu River Basin from 1974 to 2014. Furthermore, we seek to provide a basis for future study of glacial lakes' risk assessment and Glacial Lake Outburst Floods(GLOFs)prediction and protection.
2 Study areaPoiqu River, a tributary of Sun Kosi that flows into the Ganges River, has its source in Porong town, and extends 86.5 km with an average annual discharge of 31.7 m3/s and mean depth of 0.5 m(Chen et al.,2007). The Poiqu River Basin, shaped like a crescent, covers an area of 2, 018.4 km2 with National Highway No. 318 traversing the basin connecting Nepal with China. The watershed is composed of tributaries of Rujiapu, Tajilingpu, Koryagpu, Chongduipu, and Zhangzangbo from north to south(Figure 1)(Chen et al.,2007; Wang et al.,2015). Glacial l and forms in this basin are formed by modern glacial ice and snow, and ancient glaciers. The basin faces south and is favorable to moisture from the Indian monsoon(Xu, 1987). From 1974 to 2014 the drought index of Nyalam, calculated by the ratio of potential evaporation based on Hargreaves equation(Zhao et al.,2004) and precipitation, has a range from 1.69 to 4.16. However, the drought index trend was higher over the past 40 years. In particular, the mean drought index calculated from 1974 to 2014 was 2.912, while the average drought index from 1994 to 2014 was 3.111, and only 2.703 from 1974 to 1993, which implies that climate has become much dryer.
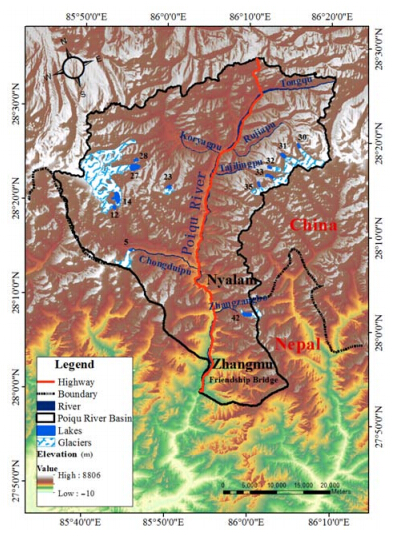 |
| Figure 1 Location of Poiqu River Basin and moraine-dammed glacial lakes and their associated glaciers |
A famous border trade town of Zhangmu, Nyalam County, located at the China-Nepal border is important due to increased economic development between the two countries(Xu, 1988). The index of l and evenness in Nyalam district, depicts the natural appropriation to dwelling and development and is calculated by altitude and area of the Poiqu River Basin, which is derived from DEM data in ArcGIS(Ren and Liu, 2013), is 9.35 more than that in the plain region. The demographic density in Nyalam from 1997 to 2008 exp and ed by over 30%, and arable l and per capita in this region fluctuates around 0.175 so that the steep and barren l and use condition is under pressure due to population expansion(Nyalam, 2009). Nevertheless, almost all residential locations in the Poiqu River Basin are surrounded by glaciers and glacial lakes, most of which are moraine-dammed, poising a serious threat to local residents and infrastructures. According to statistics of glacial lake outbursts in Xizang, moraine-dammed glacial lakes with an area of more than 0.2 km2 are more dangerous and disastrous(Shu et al., 2010). As a result, there are 12 selected moraine-dammed glacial lakes that satisfy these rules, which are Jialongco(No. 5), Taraco(No. 7), Galongco(No. 14), Xiahu(No. 23), Kangxico(No. 27), Yinreco(No. 28), Youmojanco(No. 30), Cawuqudenco(No. 31), Gangpuco(No. 32), Paquci(No. 33) and Cirenmaco(No. 42), and one unnamed glacial lake(No. 12), the codes of which refer to those in paper by Chen et al.(2007).
3 Data and methodsWe survey 12 moraine-dammed glacial lakes, the areas of which are more than 0.2 km2, and their source glaciers respectively in the Poiqu River Basin, in order to note change in area over the past 40 years. Based on low clouds and shadows for optical remote sensing, we employed topographical maps and aerial photographs, Landsat satellite images, and ASTER images from 1974 to 2014, which were obtained mainly between September and November(Table 1). In order to eliminate hill shadows, extract the river basin and derive altitudinal parameters, the appropriate and available DEM was used, such as 1:50, 000 DEMs(1974-11)digitized from topographical maps and SRTM(2000-02). Other data sources include the First Glacier Inventory of China(FGI-China, 1950-1980) and the Second Glacier Inventory of China(SGI-China, 2005-2010). Meteorological data was obtained from Nyalam National Station, which includes monthly temperature and precipitation from 1974 to 2014.
| No. | Satellite sensor | Path/Row | Date | Resolution(m) |
| 1* | Landsat MSS | 151/40 | 1977-09-16 | 57.0 |
| 2* | Landsat MSS | 151/41 | 1975-11-20 | 57.0 |
| 3 | Landsat TM | 141/40 | 1988-10-12 | 28.5 |
| 4 | Landsat TM | 141/40 | 1991-11-30 | 28.5 |
| 5* | Landsat TM | 141/41 | 1991-11-30 | 28.5 |
| 6 | Landsat TM | 141/40 | 2005-11-12 | 28.5 |
| 7* | Landsat TM | 141/40 | 2006-10-14 | 28.5 |
| 8* | Landsat TM | 141/40 | 2009-06-16 | 28.5 |
| 9 | Landsat TM | 141/40 | 2009-10-22 | 28.5 |
| 10 | Landsat TM | 141/40 | 2009-11-07 | 28.5 |
| 11 | Landsat ETM | 141/40 | 2000-11-22 | 28.5 |
| 12 | Terra ASTER | -- | 2005-12-06 | 15.0 |
| 13* | Terra ASTER | -- | 2005-09-26 | 15.0 |
| 14 | Landsat OLI | 141/40 | 2014-10-04 | 28.5 |
| 15* | Landsat OLI | 141/40 | 2014-04-11 | 28.5 |
| * references satellite images. | ||||
Initially, all satellite images were matched and georeferenced in ENVI software using topographical maps as the base map, the error of which is controlled under 0.8 pixel. Then after rectification of images, the Poiqu River Basin boundary was obtained by extracting the drainage boundary extraction together with the border between China and Nepal. Image enhancement was performed using ArcGIS software.
Secondly, the "Global-Local" stepwise iteration segmentation method(Li et al.,2011)was employed to delineate lake extents, which was modified manually with the assistance of high resolution Google Earth images, selected according to Chen et al.(2007)for moraine-dammed glacial lakes with an area of more than 0.2 km2. Afterwards, the b and ratio segmentation method(red b and /mid-infrared b and )was used to delineate glacier outlines, which were split separately according to the drainage basin boundary and ridge lines extracted automatically based on aspect differences(Yao et al.,2012a). According to the selected moraine-dammed glacial lakes, the corresponding source glaciers were chosen and finally improved manually with the assistance of experts.
Finally, the area error assessment influenced by sensors and co-registration errors was calculated by the equation of Hall et al.(2003) and Wei et al.(2015).
| ${\varepsilon _l} = n \cdot {\mu ^2}/2$ | (1) |
where εlis the area error of glacier or glacial lake, n is the total count of pixels along the outline and μ is the spatial resolution of images(28.5 m for TM or ETM and 15 m for ASTER).
When the digital Chinese topographic maps are co-registered to the Landsat scenes, the error is 12.8 m for topographic maps at a scale of 1:50, 000. Uncertainty of glacier or glacial lake outlines(μt)may be 12 m(Wei et al.,2014). Therefore, the error of glacier or glacial lake area(εt)measured from topographic maps at a scale of 1:50, 000 is the sum of uncertainty along the perimeter of glacier or glacial lake outlines, calculated by
| ${\varepsilon _t} = n \cdot {\mu _t} \cdot \sqrt {{{\left( {{\mu _t}/2} \right)}^2} + {\sigma ^2}} $ | (2) |
where σis the co-registration error. The final error of the area change ε is calculated by the errors of the glacier or glacial lake outlines in period 1(ε1) and period 2(ε2), respectively.
| $\varepsilon = \sqrt {\varepsilon _1^2 + \varepsilon _2^2} $ | (3) |
Here, we analyzed 12 moraine-dammed glacial lakes with an area of more than 0.2 km2, from 1974 to 2014(Table 2).
| No. | Lakes | 1974-1988 | 1988-2000 | 2000-2014 | |||||||
| Annual lake change(km2/a) | Intensity index of lake change* | Annual lake change(km2/a) | Intensity index of lake change* | Annual lake change(km2/a) | Intensity index of lake change* | ||||||
| 5 | Jialongco | 0.002±0.004 | 1.747 | 0.006±0.005 | 5.256 | 0.028±0.007 | 23.727 | ||||
| 12 | No name | 0.001±0.003 | 0.332 | 0.001±0.003 | 0.418 | 0.000±0.002 | 0.174 | ||||
| 14 | Galongco | 0.047±0.020 | 2.988 | 0.082±0.020 | 5.239 | 0.144±0.030 | 9.199 | ||||
| 23 | Xiahu | 0.001±0.002 | 0.455 | 0.001±0.001 | 0.490 | 0.003±0.001 | 1.057 | ||||
| 27 | Kangxico | 0.078±0.017 | 4.852 | 0.059±0.020 | 3.659 | 0.085±0.020 | 5.264 | ||||
| 28 | Yinreco | 0.004±0.002 | 1.409 | 0.001±0.001 | 0.260 | 0.001±0.001 | 0.368 | ||||
| 30 | Youmojanco | 0.008±0.006 | 3.819 | 0.007±0.005 | 3.267 | 0.009±0.006 | 4.495 | ||||
| 31 | Cawuqudenco | 0.008±0.005 | 1.737 | 0.000±0.001 | 0.054 | 0.002±0.001 | 0.509 | ||||
| 32 | Gangpuco | 0.000±0.001 | 0.030 | 0.000±0.002 | 0.105 | 0.000±0.002 | 0.172 | ||||
| 33 | Paquci | 0.008±0.001 | 1.710 | 0.002±0.001 | 0.379 | 0.002±0.001 | 0.420 | ||||
| 35 | Taraco | 0.001±0.002 | 0.620 | 0.000±0.001 | 0.229 | 0.001±0.001 | 0.482 | ||||
| 42 | Cirenmaco | −0.051±0.008 | −5.847 | 0.007±0.006 | 0.754 | 0.009±0.006 | 1.082 | ||||
| Total | 0.106 | 0.166 | 0.285 | ||||||||
| * represents the intensity index of glacial lake or glacier area changes which can be calculated as: I=(Aj−Ai)/(∆Tij×A)×100, I is the intensity index of glacial lake or glacier area changes, Ai or Aj is the glacial lake or glacier area at time i or j, A represents the area of glacial lake or glacier in 1974, ∆Tij is the time period(Wan et al., 2010). | |||||||||||
Firstly, all 12 moraine-dammed glacial lakes except for Lake Cirenmaco showed expansion from 1974 to 2014. The area decrease for Lake Cirenmaco occurred during the outbursts of 1981 and 1983, but tended to enlarge after 1988. All 12 glacial lakes have generally increased in area at rates from 0.106 km2/a in 1974-1988 to 0.166 km2/a in 1988-2000, and 0.285 km2/a in 2000-2014. In particular, in 1974-1988, the maximum and minimum expansion rates was 0.078 km2/a for Lake Kangxico and 0.0001 km2/a for Lake Gangpuco respectively, and the shrinking rate was −0.052 km2/a for Lake Cirenmaco. In 1988-2000, the maximum and minimum expansion rate was 0.082 km2/a for Lake Galongco, and 0.0002 km2/a for both Lake Cawuqudenco and Lake Gangpuco respectively, without any shrinking lakes. In 2000-2014, the maximum expansion rate was 0.144 km2/a for Lake Galongco and the minimum expansion rate was 0.0004 km2/a for Lake Gangpuco.
Secondly, the intensity index represents the expansion rate of a glacial lake, which in fact normalizes the annual area change rate by glacial lake area in order to provide comparable data from different periods. Glacial lake intensity index exemplifies the same expansion change trend that most of the 12 moraine-dammed glacial lakes experienced, with the exception of Lake Cirenmaco in 1974-1988, as annual lake area change. Specifically, the intensity indices of Lake Kangxico were at a maximum in 1974-1988, and Lake Jialongco in 1988-2000 and 2000-2014. This occurred due to the two outburst floods of Lake Jialongco on May 23 and June 29, 2002, which lead to extreme shrinkage and then rapid growth demonstrated by the anomaly of Lake Jialongco in 2000-2014. Furthermore, most of the intensity indices of lake area change remain positive during the three periods except Lake Cirenmaco. Meanwhile, Lake Cirenmaco still grows without consideration of 1974-1988 when the outburst flood in 1981 and 1983 occurred.
Most moraine-dammed glacial lake area changes are facing north(1.34 km2) and east(0.7 km2)in 1974-1988, while northeast(1.69 km2)in 1988-2000 and southeast(3.66 km2)in 2000-2014(Figure 2). In these three periods, moraine-dammed glacial lakes exp and ed slowly in southern, southwestern and western directions. Meanwhile, the st and ard deviations of these glacial lake area changes indicate that moraine-dammed glacial lakes are relatively stable during the periods of 1974-1988 and 1988-2000 while dramatically undulating in 2000-2014.
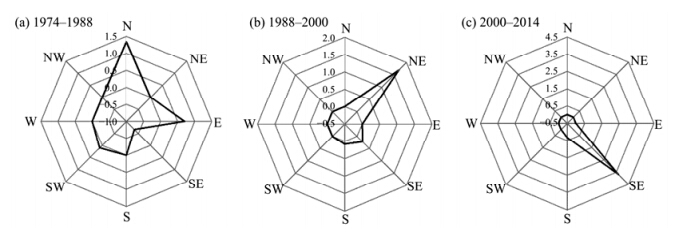 |
| Figure 2 Aspect of moraine-dammed glacial lake area change from 1974 to 2014 in the Poiqu River Basin |
The annual glacier area changes and the intensity indices of source glacier changes corresponding to the 12 glacial lakes reduced during the aforementioned three periods(Table 3).
| No. | Lakes | 1974-1988 | 1988-2000 | 2000-2014 | |||||||||
| Annual glacier change(km2/a) | Intensity index of glacier change | Annual glacier change(km2/a) | Intensity index of glacier change | Annual glacier change(km2/a) | Intensity index of glacier change | ||||||||
| 5 | Jialongco | −0.010±0.008 | −0.172 | −0.068±0.008 | −1.373 | −0.006±0.005 | −0.102 | ||||||
| 12 | No name | −0.004±0.003 | −0.114 | −0.003±0.003 | −0.081 | −0.001±0.001 | −0.019 | ||||||
| 14 | Galongco | −0.039±0.020 | −0.184 | −0.169±0.020 | −0.930 | −0.099±0.020 | −0.467 | ||||||
| 23 | Xiahu | −0.002±0.001 | −0.114 | −0.010±0.005 | −0.784 | −0.001±0.0005 | −0.087 | ||||||
| 27 | Kangxico | −0.069±0.010 | −0.912 | −0.118±0.010 | −1.828 | −0.086±0.007 | −1.134 | ||||||
| 28 | Yinreco | −0.024±0.020 | −0.092 | −0.094±0.020 | −0.420 | −0.019±0.000 | −0.074 | ||||||
| 30 | Youmojanco | −0.011±0.009 | −0.109 | −0.063±0.010 | −0.698 | −0.007±0.005 | −0.064 | ||||||
| 31 | Cawuqudenco | −0.023±0.004 | −0.355 | −0.020±0.004 | −0.370 | −0.006±0.004 | −0.100 | ||||||
| 32 | Gangpuco | −0.008±0.002 | −0.620 | −0.008±0.003 | −0.671 | −0.004±0.003 | −0.271 | ||||||
| 33 | Paquci | −0.021±0.006 | −0.385 | −0.036±0.007 | −0.781 | −0.004±0.003 | −0.069 | ||||||
| 35 | Taraco | −0.007±0.001 | −0.239 | −0.049±0.002 | −1.860 | −0.003±0.001 | −0.104 | ||||||
| 42 | Cirenmaco | −0.046±0.007 | −1.267 | −0.038±0.008 | −1.209 | −0.014±0.007 | −0.383 | ||||||
| Total | −0.265 | −0.675 | −0.249 | ||||||||||
Total annual glacier area changes decreased from 0.265 km2/a in 1974-1988, to 0.675 km2/a in 1988-2000, to 0.249 km2/a in 2000-2014. In particular, in 1974-1988, the maximum and minimum shrinking rate was 0.069 km2/a for Lake Kangxico and 0.002 km2/a for Lake Xiahu, respectively. In 1988-2000, the maximum and minimum shrinking rate was 0.169 km2/a for Lake Galongco and 0.003 km2/a for Lake No. 12, respectively. In 2000-2014, the maximum shrinking rate was 0.099 km2/a for Lake Galongco, and the minimum shrinking rate was 0.001 km2/a for Lake No. 12.
Theoretically, the intensity index of glacial lake change is opposite to the index of glacier change, since glacial area is the main supply to moraine-dammed glacial lakes. Nonetheless, there are disparities in the source glaciers of Lake Cirenmaco(1974-1988). The anomaly of Lake Cirenmaco can be ascribed to the outburst floods in 1981 and 1983. Specifically, the intensity index of Lake Cirenmaco was at the maximum in 1974-1988, for Lake Jialongco in 1988-2000, and Lake Kangxico in 2000-2014.
Those facing east had maximum glacial area change coverage of approximately −2.07 km2 in 1974-1988, −4.67 km2 in 1988-2000 and −2.96 km2 in 2000-2014(Figure 3). Meanwhile, north, west and northwest facing glaciers barely have area changes. The st and ard deviations of these source glacier area changes indicate that they were relatively stable in 1974-1988 and 2000-2014, while sharply fluctuating in 1988-2000.
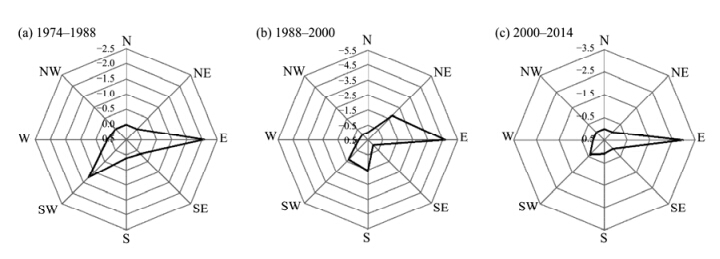 |
| Figure 3 Aspect of source glacier area changes from 1974 to 2014 in the Poiqu River Basin |
Moraine-dammed glacial lakes or their source glacier areas in the Poiqu River Basin have changed largely over the past 40 years. These areas are divided into three time intervals to calculate the area change rates when glacier lakes or their source glacier areas enlarge or shrink with a corresponding tendency in each interval(Figure 4).
 |
| Figure 4 Area changes of moraine-dammed glacial lakes and their source glaciers from 1974 to 2014 in the Poiqu River Basin |
As illustrated in Figure 4a, glacial lake areas from 0.3 km2 to 0.5 km2 remain the most stable with area change rates concentrated between 2.6% and 32.7% during the three intervals. Glacial lake areas from 0.2 km2 to 0.3 km2 and from 0.5 km2 to 1 km2 change in dispersive velocities during the three intervals with a maximum area change rate of nearly 190% for Lake Jialongco from 2000 to 2014 and nearly −90% for Lake Cirenmaco from 1974 to 1988, respectively. As for glacial lakes with areas under 0.2 km2 and over 1 km2, the maximum area change rate was more than 70%. In addition, the mean rates of glacial lake area changes for different area size are 49.03%, 23.10%, 18.42%, −12.92% and 44.12%, respectively. This indicates that moraine-dammed glacial lakes with an area under 0.2 km2 and over 1 km2 are more sensitive while intermediate size area remains comparatively stable. Therefore, more attention should be paid to moraine-dammed glacial lakes with an area over 1 km2 for dangers of future outburst floods.
Meanwhile, Figure 4b shows a shrinking tendency in various glacier area sizes in the three intervals. Glacier areas from 10 km2 to 30 km2 have smaller changes with an area change rate of −4.7% whilst the area change rate of the other glaciers ranges from −6.5% to −9.5%. This means that smaller glaciers have a smaller variation of area and greater area change rate due to higher sensitivity to climate change. Moreover, the tendency of glacier area change is opposite to that of moraine-dammed glacial lakes, which manifests the close relationship between moraine-dammed glacial lakes and their associated glaciers.
5 Discussions 5.1 Temperature and precipitation tendencyRegarding the formation of glacial lakes, there are two key factors of replenishment in mountain regions, one of which is glacier melt and the other is climate conditions especially precipitation(Kääb, 2005). Moreover, glaciers, as a sign of climate change, are subject to summer mean temperature and annual precipitation, which have an effect on ablation rate and accumulation rate, respectively(Li et al.,2003). The mean monthly air temperature and precipitation from Nyalam Meteorological Station from 1974 to 2014 are selected to calculate the annual average temperature and precipitation, and the anomaly of annual precipitation, as well as the simple linear regression of the annual temperature and precipitation in the three periods(Figure 5).
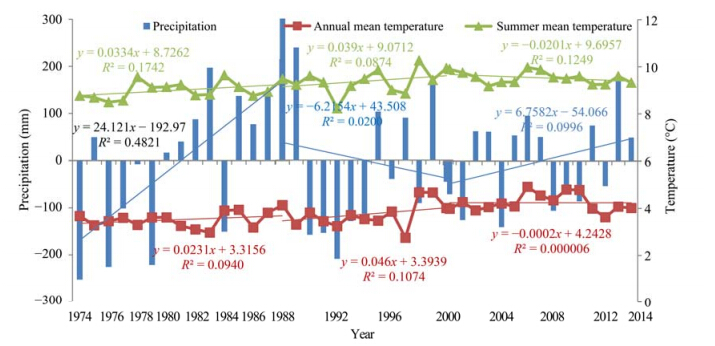 |
| Figure 5 Time series of annual mean temperature and precipitation trends in Nyalam Meteorological Station from 1974 to 2014 |
From 1974 to 2014, the temperature increased roughly at 0.28 °C/decade with a mean temperature of 3.81 °C, while precipitation decreased by 17.2 mm/decade with a mean annual precipitation of 653.2 mm. As for the period of 1974-1988, the annual mean temperature increased by 0.23 °C/decade with the summer mean temperature increase of 0.33 °C/decade, while the precipitation augmented by 241.2 mm/decade with an annual mean precipitation of 731.1 mm. In the period of 1988-2000, the annual mean temperature increased by 0.46 °C/decade, summer mean temperature increased by 0.39 °C/decade, while precipitation decreased by 62.2 mm/decade with an annual mean precipitation of 605.3 mm. During the period of 2000-2014, annual mean temperature decreased by 0.002 °C/decade, summer mean temperature decreased by 0.2 °C/decade, while precipitation augmented by 67.6 mm/decade with an annual mean precipitation of 630.1 mm. Thus, concerning both glaciers and glacier lakes which are affected by temperature and precipitation, the warm and arid tendency of climate change could accelerate glacier melt and reduce glacier mass accumulation(Ren et al.,2003), which illustrates the reason for shrinking glacier areas. The moraine-dammed glacial lakes, as a specific type of glacier-fed lakes, are mainly influenced by glacier changes, while precipitation and evaporation are the secondary factors(Wang et al.,2013). Thus, glacier melt is the reason for enlargement of moraine-dammed glacial lakes in the Poiqu River Basin.
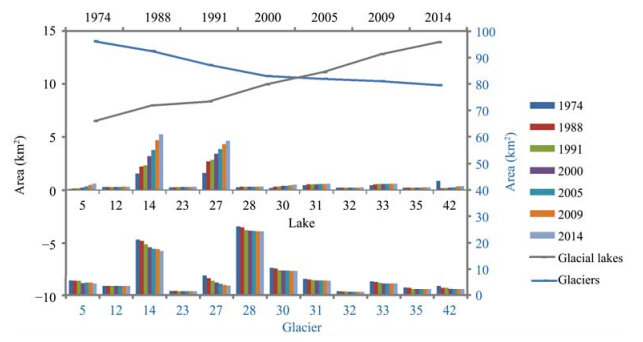
5.2 The interaction between moraine-dammed lakes and their source glaciersExcept for the meteorological influence, the effect of glacier changes on moraine-dammed glacial lakes should be considered. Therefore, the overall analysis of 12 glacial lakes and their source glaciers in the Poiqu River Basin is presented in Figure 6.
 |
| Figure 6 Individual and overall changes of moraine-dammed glacial lake area and their source glacier area from 1974 to 2014 in the Poiqu River Basin |
From 1974 to 2014, the surfaces of these moraine-dammed glacial lakes all exhibited continuous growth with an accelerating enlargement rate, while areas of their source glaciers decreased conversely. Also, these moraine-dammed glacial lakes all exp and ed towards the direction of their source glaciers, most likely because the retreating source glacier provided space for expansion of the glacial lake. Individually, lakes Galongco, Kangxico and Youmojanco exhibited rapid growth from 1974 to 2014 corresponding to their source glaciers' retreat, which verify that melting of the source glacier is the main replenishment especially for moraine-dammed glacial lakes. In the period of 1974-1988, the area of Lake Cirenmaco decreased dramatically due to catastrophic floods from this lake, which caused severe damage to downstream areas.
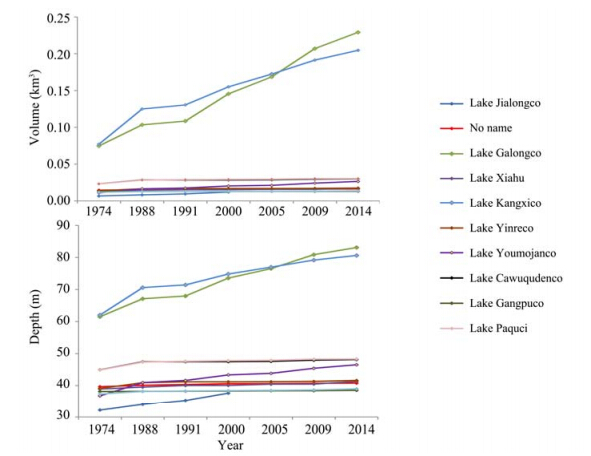
5.3 Analysis of potentially dangerous moraine-dammed glacial lakesBecause there is no feasible way to derive lake volume directly from optical satellite images, empirical equations between glacier lakes area and water depth or volume were proposed for lakes in North America, South America, Icel and and the Alps(Huggel et al.,2002). According to Yamada(1988) and Sakai et al.(2005), the lake basin of Lake Imja has changed a little while the area has changes substantially. As for lake volume, empirical equations may be the only choice in poorly known high mountain regions owing to the limits of present remote sensing techniques and field measurements. We therefore chose an area-depth relationship obtained from several Himalayan glacial lakes(Yao et al.,2012b) and an empirical formula for the volume-area relationship deduced from volume and area data of Longbasaba Lake in the northern Himalayas in different periods(Fujita et al.,2013).
| $D = 55{A^{0.25}}$ | (4) |
| $V = 0.0493{A^{0.9304}}$ | (5) |
where D is the mean depth of glacial lake(m), A is the lake area(km2), and V is the glacial lake volume(km3).
Therefore, in Figure 7 we summarize water depth, storage capacity and moraine-dammed glacial lake areas in the Poiqu River Basin during the period of 1974-2014 excluding Lake Cirenmaco(1974-2014) and Lake Jialongco(2000-2014)due to historical outburst floods.
 |
| Figure 7 Changes of water depth and storage capacity for moraine-dammed glacial lakes in 1974-2014 |
In summary, there is an overall trend towards increase of both volume and mean depth of glacial lakes from 1974 to 2014. However, this trend occurs only at some moraine-dammed glacial lakes while other lakes do not seem to change much. Between 1974 and 2014 the volume and mean depth of lakes Galongco, Kangxico and Youmojanco increased noticeably while Lake Jialongco kept increasing in lake volume and mean depth from 1974 to 2000. Nevertheless, the other moraine-dammed glacial lakes seem to change slightly in 1974-2014 in line with their area changes.
According to the slope classification of Tobias et al.(2008), the study area was divided into five slope classes to represent the morphometric characteristics of typical moraine-dammed glacial lakes(Figure 8). These lakes and their surroundings continued to grow in area, lake volume and mean depth in 1974-2014. Since the growth rate of lakes Youmojianco, Galongco and Kangxico is linear, which likely continue to grow, analysis of the slope gradients of their source glaciers and the terminal moraine dams shows that less attention could be paid to them. Because most of their source glacier tongues have a slope of less than 10°, the risk of an avalanche into the lake is low. Meanwhile the moraine dam of Lake Galongco seems comparatively stable. Although lake volume and mean water depth of Lake Jialongco and Lake Cirenmaco are not considered due to the historical GLOFs, they should be continuously monitored due to rapid lake growth and potential dangers of steep slope gradients surrounding them.
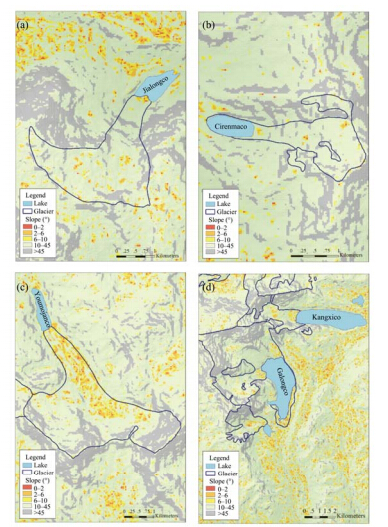 |
| Figure 8 Slope gradients of five moraine-dammed glacial lakes and their surroundings.(a)Lake Jialongco(No. 5);(b)Lake Cirenmaco(No. 42);(c)Lake Youmojanco(No. 30);(d)Lake Galongco(No. 14) and Lake Kangxico(No. 27) |
In this study, multi satellite images and DEMs were used to analyze moraine-dammed glacial lakes over 0.2 km2 and their source glaciers, which were defined as potentially dangerous glacial lakes in past research. The following conclusions have been obtained:
1)According to the intensity of moraine-dammed glacial lake area and glacier area changes from 1974 to 2014 in the Poiqu River Basin, 12 moraine-dammed glacial lakes enlarged, except Lake Cirenmaco, from 1974 to 1988 while their source glaciers shrank. All moraine-dammed glacial lakes exp and ed by 7.46 km2 in total with the glaciers retreating by a total of 15.29 km2 correspondingly.
2)The analysis in area changes of moraine-dammed glacial lakes and their source glaciers for different area sizes demonstrate that moraine-dammed glacial lakes with an area under 0.2 km2 and over 1 km2 are more sensitive to climate change, while smaller glaciers are more sensitive to climate change due to smaller variation of area and greater area change rate. Moreover, the opposite tendency of area changes for moraine-dammed glacial lakes and glaciers manifests the shrinkage of the source glaciers as the most significant sources for expansion of moraine-dammed glacial lakes.
3)The warm and dry tendency of climate change in Nyalam region from 1974 to 2014 could accelerate glacier melt and reduce glacier mass accumulation, and then augment the supply of moraine-dammed glacial lakes from glacier melt.
4)Lake volume and water depthchanged from 1974 to 2014, an important evaluation index, for moraine-dammed glacial lakes except Lake Cirenmaco in 1974-2014 and Lake Jialongco in 2000-2014. This indicates that more attention should be paid to lakes Kangxico, Galongco, and Youmojanco due to a high increase in water depth and storage capacity.
5)Although lake volume and mean water depth of Lake Jialongco and Lake Cirenmaco are not considered due to historical GLOFs, they should be continuously monitored due to rapid lake growth and potential dangers of steep slope gradients surrounding them.
Acknowledgments:
This study was supported by programs from the Ministry of Science and Technology of China(MOST)(Grant Nos. 2013FY111400 and 2012BAC19B07) and the National Natural Science Foundation of China(Grant No. 41190084). The first and second Chinese Glacier Inventory data were provided by an immediate past Project from MOST(Grant No. 2006FY110200). Satellite images are from the United States Geological Survey(USGS) and National Aeronautics and Space Administration(NASA).
| Ashraf A, Naz R, Roohi R, 2012. Glacial lake outburst flood hazards in Hindukush, Karakoram and Himalayan Ranges of Pakistan: implications and risk analysis. Geomatics, Natural Hazards and Risk, 3(20): 113–132. DOI: 10.1080/19475705.2011.615344. |
| Babu Govindha Raj K, 2010. Remote sensing based hazard assessment of glacial lakes: a case study in Zanskar basin, Jammu and Kashmir, India. Geomatics, Natural Hazards and Risk, 1(4): 339–347. DOI: 10.1080/19475705.2010.532973. |
| Bajracharya SR, Mool P, 2009. Glaciers, glacial lakes and glacial lake outburst floods in the Mount Everest region, Nepal. Annals of Glaciology, 50(53): 81–86. DOI: http://dx.doi.org/10.3189/172756410790595895. |
| Bolch T, Buchroithner MF, Peters J, et al., 2008. Identification of glacier motion and potentially dangerous glacial lakes in the Mt. Everest region, Nepal using spaceborne imagery. Natural Hazards and Earth System Science, 8(6): 1329–1340. DOI: 10.5194/nhess-8-1329-2008. |
| Che T, Jin R, Li X, et al., 2004. Glacial lakes variation and the potentially dangerous glacial lakes in the Pumqu Basin of Tibet during the last two decades. Journal of Glaciology and Geo-cryology, 26(4): 397–402. |
| Che T, Li X, Mool PK, et al., 2005. Monitoring glaciers and associated glacial lakes on the east slopes of Mount Xixabangma from remote sensing images. Journal of Glaciology and Geocryology, 27(6): 801–805. |
| Chen NS, Hu GS, Deng W, et al., 2013. On the water hazards in the trans–boundary Kosi River basin. Natural Hazards and Earth System Science, 13: 795–808. DOI: 10.5194/nhess-13-795-2013. |
| Chen XQ, Cui P, Li Y, et al., 2007. Changes in glacial lakes and glaciers of post-1986 in the Poiqu River basin, Nyalam, Xizang (Tibet). Geomorphology, 88(3): 298–311. DOI: 10.1016/j.geomorph.2006.11.012. |
| Chen XQ, Cui P, Yang Z, et al., 2006. Cause analysis and preven-tion countermeasure of 2002 debris flow of Chongdui gully in Nyalam County. Journal of Glaciology and Geocryology, 26(5): 776–781. |
| Fujita K, Sakai A, Takenaka S, et al., 2013. Potential flood volume of Himalayan glacial lakes. Natural Hazards and Earth System Sciences, 13: 1827–1839. DOI: 10.5194/nhess-13-1827-2013. |
| Hall DK, Bayr KJ, Schn?er W, et al., 2003. Consideration of the errors inherent in mapping historical glacier position in Austria from ground and space (1893–2001). Remote Sensing of Environment, 86(4): 566–577. DOI: 10.1016/S0034-4257(03) 00134-2. |
| Huggel C, K??b A, Haeberli W, et al., 2002. Remote sensing based assessment of hazards from glacier lake outbursts: a case study in the Swiss Alps. Canadian Geotechnical Journal, 39(2): 316–330. DOI: 10.1139/t04-053. |
| Huss M, Bauder A, Werder M, et al., 2007. Glacier-dammed lake outburst events of Gornersee, Switzerland. Journal of Glaci-ology, 53(181): 189–200. DOI: http://dx.doi.org/10.3189/ 172756507782202784. |
| IPCC, 2013. Climate Change 2013: The Physical Science Basis. Working Group I Contribution to the Fifth Assessment Report of the Intergovernmental Panel on Climate Change. WMO/UNEP, Cambridge University Press, Cambridge, United Kingdom and New York, USA. |
| K??b A, 2005. Combination of SRTM3 and repeat ASTER data for deriving alpine glacier flow velocities in the Bhutan Himalaya. Remote Sensing of Environment, 94(4): 463–474. DOI: 10.1016/j.rse.2004.11.003. |
| Li JL, Sheng YW, Luo JC, 2011. Automatic extraction of Himalayan glacial lakes with remote sensing. Journal of Remote Sensing, 15(1): 29–43. |
| Li ZQ, Han TD, Jin ZF, et al., 2003. A summary of 40-year observed variation facts of climate and Glacier No. 1 at headwater of Urumqi River, Tianshan, China. Journal of Glaciology and Geocryology, 25(2): 117–123. |
| Liu CH, Sharma CK, 1988. Report on First Expedition to Glaciers and Glacier Lakes in the Pumqu (Arun) and Poiqu (Bhote–Sun Kosi) River Basins, Xizang (Tibet), China. Beijing: Science Press. |
| Nyalam, 2009. Statistic year books from 1997 to 2008. Nyalam. |
| Ren JW, Qin DH, Kang SC, et al., 2003. Glacier changes and climatic characteristics of warming and drying statement in central Himalaya. Science Bulletin China, 48(23): 2478–2482. |
| Ren ZY, Liu YX, 2013. Exploring the regional ecological security evaluation methods based on values: A case study in the energy region of northern Shaanxi. Geographical Research, 32(10): 1771–1781. |
| Sakai A, Chikita K, Yamada T, 2000. Expansion of a mo-raine-dammed glacial lake, Tsho Rolpa, in Rolwaling Himal, Nepal Himalaya. Limnology and Oceanography, 45(6): 1401–1408. DOI: 10.4319/lo.2000.45.6.1401. |
| Sakai A, Fujita K, Yamada T, 2005. Expansion of the Imja glacier lake in the east Nepal Himalaya. In: Mavlyudov BR (ed.). Glacier Caves and Glacial Kerst in High Mountains and Polar Regions. Institute of Geography, Russian Academy of Sciences, pp. 74–79. |
| Shen YP, Ding YJ, Liu SY, et al., 2004. An increasing glacial lake outburst flood in Yarkant River, Karakorum in past ten years. Journal of Glaciology and Geocryology, 26(2): 234. |
| Shu YF, Wang GC, Zhuang SY, et al., 2010. A weight determination method based on rough set for hazard assessment of typical moraine-dammed lake outburst in Himalayan region. Bulletin of Soil and Water Conservation, 30(5): 109–114. |
| Vilímek V, Zapata ML, Klime? J, et al., 2005. Influence of glacial retreat on natural hazards of the Palcacocha Lake area, Peru. Landslides, 2(2): 107–115. DOI: 10.1007/s10346-005-0052-6. |
| Wan W, Xiao PF, Feng XZ, et al., 2010. Remote sensing analysis for changes of lakes in the southeast of Qiangtang area, Qinghai-Tibet Plateau in recent 30 years. Journal of Lake Sciences, 22(6): 874–881. |
| Wang WC, Xiang Y, Gao Y, et al., 2015. Rapid expansion of glacial lakes caused by climate and glacier retreat in the Central Himalayas. Hydrology Process, 29: 859–874. DOI: 10.1002/hyp.10199. |
| Wang X, 2008. Methods and application for the hazard assessment of moraine-dammed lake outburst floods in the Himalayas, China. Doctoral Dissertation, Graduate School of Chinese Academy of Sciences. |
| Wang X, Siegert F, Zhou AG, et al., 2013. Glacier and glacial lake changes and their relationship in the context of climate change, Central Tibetan Plateau 1972–2010. Global and Planetary Change, 111: 246–257. DOI: 10.1016/j.gloplacha.2013.09.011. |
| Wei JF, Liu SY, Guo WQ, et al., 2014. Surface-area changes of glaciers in the Tibetan Plateau interior area since the 1970s using recent Landsat images and historical maps. Annals of Glaciology, 55(66): 213–222. DOI: http://dx.doi.org/10.3189/2014AoG66A038 . |
| Wei JF, Liu SY, Xu JL, et al., 2015. Mass loss from glaciers in the Chinese Altai Mountains between 1959 and 2008 revealed based on historical maps, SRTM, and ASTER images. Journal of Mountain Science, 12(2): 330–343. DOI: 10.1007/s11629-014-3175-1. |
| Xu DM, 1987. Characteristics of debris flow caused by outburst of glacial lakes on the Boqu River in Xizang, China. Journal of Glaciology and Geocryology, 9(1): 23–34. |
| Xu DM, 1988. Characteristics of debris flow caused by outburst of glacial lake in Boqu River, Xizang, China, 1981. GeoJournal, 17(4): 569–580. DOI: 10.1007/BF00209443. |
| Yamada T, 1998. Glacier lake and its outburst flood in the Nepal Himalaya. Data Center for Glacier Research, Japanese Society of Snow and Ice, Tokyo. |
| Yao XJ, Liu SY, Guo WQ, et al., 2012a. Glacier changes of Altay mountain in China from 1960 to 2009-based on the second glacier inventory of China. Journal of Natural Resources, 27(10): 1734–1745. |
| Yao XJ, Liu SY, Sun MP, et al., 2012b. Volume calculation and analysis of the changes in moraine-dammed lakes in the north Himalaya: a case study of Longbasaba lake. Journal of Gla-ciology, 58(210): 753–760. DOI: http://dx.doi.org/10.3189/ 2012JoG11J048 . |
| Ye QH, Yao TD, Zheng HX, et al., 2008. Glacier and lake co-variations and their responses to climate change in the Mapam Yumco Basin on Tibet. Geographical Research, 27(5): 1178–1190. |
| Zhao CY, Nan ZR, Feng ZD, 2004. GIS-assisted spatially distrib-uted modeling of the potential evapotranspiration in semi-arid climate of the Chinese Loess Plateau. Journal of Arid Environments, 58(3): 387–403. DOI: 10.1016/j.jaridenv.2003.08.008. |
 2015, 7


