Article Information
- Wei Ma, Tuo Chen. 2015.
- Analysis of permanent deformations of railway embankments under repeated vehicle loadings in permafrost regions
- Sciences in Cold and Arid Regions, 7(6): 645-653
- http://dx.doi.org/10.3724/SP.J.1226.2015.00645
Article History
- Received: March 16, 2015
- Accepted: June 12, 2014
1 Introduction
As a major representative project in cold regions, the Qinghai-Tibet Railway(QTR)is a l and mark of implementation of the Western Development Strategy of China. As the highest and longest plateau railway in the world, the Golmud-Lhasa section of the QTR is 1, 142 km in length, of which 550 km crosses large areas of continuous permafrost regions(the talik region of permafrost area is 101.68 km). The length of subgrade accounts for 72.3% of the total length in permafrost regions(Cheng, 2002; Wang LM et al.,2009). The dynamic vibration and deformation of embankments due to high-speed trains is a key area of scientific investigation. For example, at some sections in permafrost regions, embankment subsidence and cracks in frozen soil occurred in less than two months after the opening of the QTR. Therefore, scientific and rational study of the dynamic response and deformation characteristics of embankments under train load vibration is important for the stability of railway embankments in permafrost regions. Our study of the characteristics of embankment deformation under train loadings, specifically the transient dynamic response and deformation mechanism, demonstrates that the deformation produced by repeated vehicle loads is permanent. The embankment creep effect under long-term train loads should therefore be the subject of more research.
The dynamic response and deformation of railway embankments has been researched in many previous studies. For example, Li et al.(2008)studied the temperature field of the embankments of the QTR by applying the finite element method. The dynamic characteristics of vibration on pore water pressure, stress, and displacement were analyzed as well, combined with the distribution of the temperature field. A 3-D finite element model was developed by Shi(2011)to simulate the stability of train-track-embankment systems in permafrost regions along the QTR, under repeated loadings, and the influence of the temperature and ice content was discussed as well. Gu(2009)studied the influence of the soil temperature and train speed on the dynamic response of embankments in frozen regions. The dynamic system, including the sleepers- ballast-embankment-ground systems, was delineated by Yu(2006)to discuss the vibration response of embankments induced by train loading, and the main factors affecting the reaction. Wang et al.(2002)studied the stress and deformation distribution of an embankment caused by dynamic train loading using a 2-D numerical model, which took into account the influence of creep deformation, volumetric deformation, and instantaneous deformation of the frozen soil under different soil conditions. Wang LN et al.(2009) and Zhu(2009)monitored the vibration response of tracks, sleepers, embankments, and ground induced by train dynamic loading in permafrost areas on the Qinghai-Tibet Plateau and in the Daqing seasonal frozen ground areas. With their on-site monitoring and time data, they investigated the vibration response characteristics and the influence of the frozen soil layer. However, the study of the cumulative deformation of embankments under train loading based on the evaluat ion of the actual vibration loading is still in the exploratory stage.
Based on these studies and taking the QTR as an example, we conducted a study of the permanent deformation of a railway embankment under repeated vehicle loads in a permafrost region. Using the strong-motion data obtained by real-time strong-motion tests, the train load was converted to an equivalent force. The creep effect of the plain fill embankment on permafrost was simulated using a creep model coupled with a time-hardening power function rule and the Drucker-Prager yield and failure criterion. The cumulative deformation of the embankment under train loading was obtained, and the impact of the dynamic train loading was added to obtain the total deformation of the embankment.
2 Creep model of frozen soilThe creep characteristics of frozen soil have been previously investigated(e.g., Wu and Ma, 1994). According to related research, the viscoplastic strain increment {dε}vp can be expressed as follows(Li, 2008):
| ${\{ d\varepsilon \} ^{vp}} = {\{ d\varepsilon \} ^c} = d\overline {{\varepsilon ^c}} \frac{{\partial \overline \sigma }}{{\partial \{ \sigma \} }}$ | (1) |
where $d\overline {{\varepsilon ^c}} $is the equivalent creep strain increment, and $\overline \sigma $ refers to the equivalent stress.
The stress in soil under train loading is small and the creep of the soil is mainly the viscoelastic creep, which can be obtained according to the following creep equation:
| $\overline {{\varepsilon ^c}} = {C_1} \cdot {\overline \sigma ^{{C_2}}} \cdot {t^{{C_3}}} \cdot {e^{ - \frac{{{C_4}}}{T}}}$ | (2) |
where C1, C2, C3, and C4 are coefficients from the creep test, t st and s for time, and T refers to the soil temperature.
The creep strain rate can be obtained by calculating the derivative of Equation (2) and can be expressed as follows(Zheng et al.,2009):
| $\mathop {\overline {{\varepsilon ^c}} }\limits^ \bullet = {C_1} \cdot {C_3} \cdot {\overline \sigma ^{{C_2}}} \cdot {t^{{C_3} - 1}} \cdot {e^{ - \frac{{{C_4}}}{T}}}$ | (3) |
Geomaterials may creep under certain conditions. When the loading rate is of the same order of the creep time scale, the plasticity and creep equations must be solved using a coupled solution procedure. ABAQUS has a creep model that can be used to augment the Drucker-Prager plasticity for such problems.
3.1 Time-hardening creep lawThe time-hardening model can be expressed by the creep rate as follows(Liao and Huang, 2008):
| $\mathop {\overline {{\varepsilon ^{cr}}} }\limits^ \bullet = A{(\overline {{\sigma ^{cr}}} )^n}{t^m}$ | (4) |
| $\varepsilon = \frac{A}{{m + 1}}{\sigma ^n}{t^{m + 1}}$ | (5) |
where $\mathop {\overline {{\varepsilon ^{cr}}} }\limits^ \bullet $refers to the equivalent creep strain rate and A, n, m are the model parameters. Generally, the parameters A >0, n >0, and −1< m ≤0.
This creep law can be used when the stress in the material remains essentially constant. In finite element numerical calculations, the train loading should be considered as an equivalent force. Combining Equation (4) with the creep equation of permafrost (3), the frozen soil parameters of the time-hardening model can be converted as:
| $A = {C_1} \cdot {C_3} \cdot {e^{ - \frac{{{C_4}}}{T}}}$ | (6) |
| $n = {C_2}$ | (7) |
| $m = {C_3} - 1$ | (8) |
The Drucker-Prager creep model uses a hyperbolic creep flow potential which ensures that the creep(deformation)flow direction is always defined uniquely:
| ${G^{cr}} = \sqrt {{{(\varepsilon {{\overline {\left. \sigma \right|} }_0}\tan \psi )}^2} + {q^2}} - p\tan \psi $ | (9) |
where the initial yield stress, ${\overline {\left. \sigma \right|} _0}$, is defined by the Drucker-Prager hardening option, ψ refers to the dilatancy angle in the p-q plane, p=−$\frac{1}{3}$(σ1+2σ3), q=σ1−σ3, and ε is the drift rate.
4 Finite element numerical model and parameters 4.1 Finite element numerical modelA typical embankment along the QTR in a permafrost region was selected as the object of study. An analysis model was built based on the borehole data and the railway subgrade structure, as shown in Figure 1. According to the engineering geological conditions(Zhang et al.,2007), the soil layer distribution was determined to be silty s and , silty clay, and weathered mud stone from top to bottom, respectively, and the permafrost table located 3 m below the ground surface. The simulation was carried out assuming plane strain. The lateral boundary conditions used an infinite element boundary which diminished the influence of the boundary conditions; the reflection of the fluctuation at the boundary was reduced as well(Dassault, 2010; Fei and Zhang, 2010). The bottom boundary used an artificial boundary condition. The finite element model contained 2, 220 elements and 2, 328 nodes, and the size of the element was set as 1m×1m.
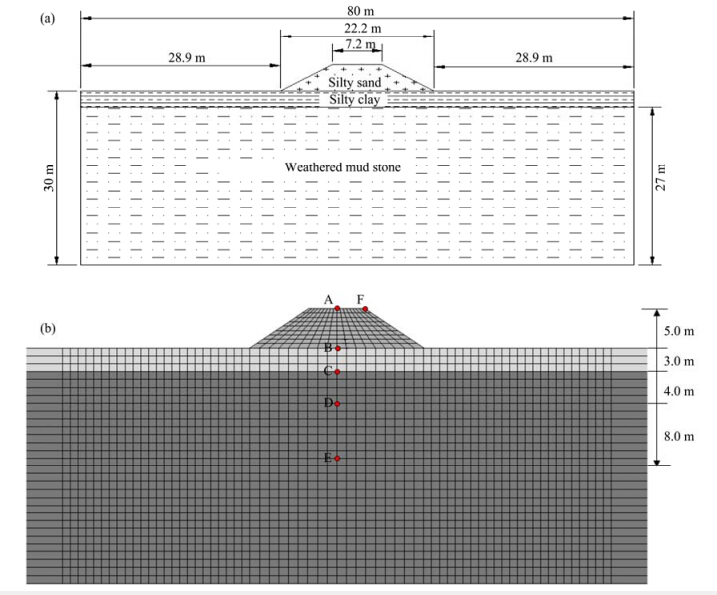 |
| Figure 1 The embankment models.(a)Solid model;(b)Finite element model(Unit: m. The letters A-F denote different positions) |
In finite element numerical calculations, the analysis of the creep characteristics of the embankment could not be coupled with the real-time temperature, due to the large difference between train loading time and the time involved in the actual study project. To solve the time-scale problem, the initial temperature conditions were assumed for this model. The temperature was set equal to the initial conditions under repeated train loadings.
The temperature conditions of each soil layer in the model were defined according to the ground temperature curve of the borehole at the center of the embankment, shown in Figure 2. The temperature of the permafrost was set as −1 °C and the active layer was set as 2 °C, in the thawed state. In the numerical calculations, the soil mechanical parameters were given to the different soil layers based on the temperature.
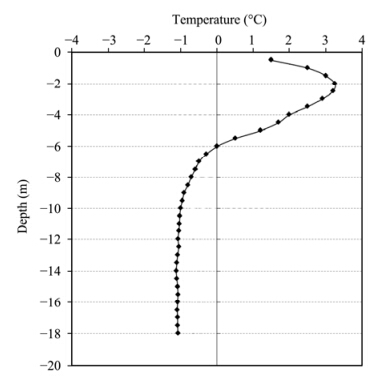 |
| Figure 2 The ground temperature curve in the borehole at the center of the embankment |
In the finite element numerical calculations, the soil mechanical parameters were selected on the basis of the results of a dynamic triaxial test at low temperatures(Xu et al.,1998). The soil was regarded as an elastic-plastic medium which was suitable for the Drucker-Prager criterion. The soil mechanical parameters of the numerical analysis are shown inTable 1, and the specific parameters tanβ, d and C were calculated from Equations (10) and (11), based on the Mohr-Coulomb criterion(Zhao et al.,2005).
| $\tan \beta = \frac{{\sqrt 3 \sin \varphi }}{{\sqrt {1 + \frac{1}{3}{{\sin }^2}} \varphi }}$ | (10) |
| $\frac{d}{c} = \frac{{\sqrt 3 \cos \varphi }}{{\sqrt {1 + \frac{1}{3}{{\sin }^2}} \varphi }}$ | (11) |
| Lithology | Temperature(°C) | Density(kg/m3) | Modulus of elasticity(MPa) | Poisson's ratio | Cohesion(kPa) | Friction angle |
| Silty s and | 2 | 2, 000 | 60 | 0.35 | 51 | 35° |
| Silty clay | 2 | 1, 900 | 80 | 0.40 | 254 | 34° |
| Weathered mud stone | −1 | 2, 200 | 250 | 0.25 | 492 | 49° |
The soil creep parameters in the numerical calculations were determined from triaxial rheological experiments on the frozen soil(Zheng et al.,2006; Zhang et al.,2012). The parameters of the soils in the numerical analysis are shown in Table 2.
| Lithology | Temperature(°C) | C1 | C2 | C3 | C4 | A | n | m |
| Silty s and | 2 | 3.679E−7 | 1.181 | 0.077 | 0.535 | 4.84E−8 | 1.181 | −0.923 |
| Silty clay | 2 | 2.983E−7 | 1.071 | 0.065 | 0.524 | 3.27E−8 | 1.071 | −0.935 |
| Weathered mud stone | −1 | 2.875E−7 | 1.065 | 0.059 | 0.517 | 2.84E−8 | 1.065 | −0.941 |
| Note: Parameters are as defined in Section 3.1. | ||||||||
The long-term settlements of embankments under train loads are not a transient problem in the kinetic theory, which can be attributed to the creep problem. The impact of train loading can be regarded as the equivalent static load in road engineering, converted to equivalent stress as well(Liao and Huang, 2008). Analysis of the deformation of the frozen soil can be done using a creep model.
Dynamic train loading is a complex issue. It involves many factors such as the axle weight, suspension system, traveling speed, track structure, and geometric irregularity of the lines. It was feasible in our numerical calculations to convert the train load to the force on the road surface, while neglecting the influence of the above factors.
Based on the strong-motion data obtained by real-time strong-motion tests carried out at a typical embankment along the QTR in the warm season of 2009, the train load was converted to an equivalent force. Figure 3 shows the vertical acceleration waveform recorded at the shoulder of the embankment when a train was passing; the peak acceleration at the shoulder of the embankment was 220 m/s2.
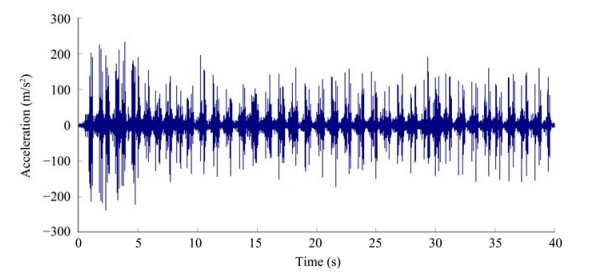 |
| Figure 3 Vertical acceleration waveform recorded at a railway shoulder |
The acceleration curve can be regarded as the constant value, and the dynamic train load was converted into equivalent creep force F, by using the equivalent static force method. Using Equation (12) in the numerical calculation, the direction of F was downward.
| $F{\rm{ = }}m \cdot \overline a $ | (12) |
where F st and s for the equivalent creep force, m refers to the mass per unit volume of soil, and $\overline a $is the average value of the acceleration envelope.
In the numerical analysis, the gravity stress field of the embankment was calculated first. The consolidation under the effect of gravity had been completed and did not generate creep. The gravity stress field was not added in subsequent creep computations. According to the equivalent force method, in the creep analysis stage a uniform load F was applied on top of the subgrade surface model. Based on the vertical acceleration waveform recorded at the shoulder when the trains passed, and ignoring the influence of train types, the time of train loading was considered as 30 s per trip, 16 trips a day on the QTR. Based on this assumption, the deformation characteristics of the embankment under repeated train loadings were studied.
6 The numerical results 6.1 The displacement responseIn order to guarantee the stability and the safe operation of trains on the QTR, the embankment deformations should be rationally analyzed. The development of embankment settlement deformation, as well as the permanent deformation of the embankment, are analyzed here.
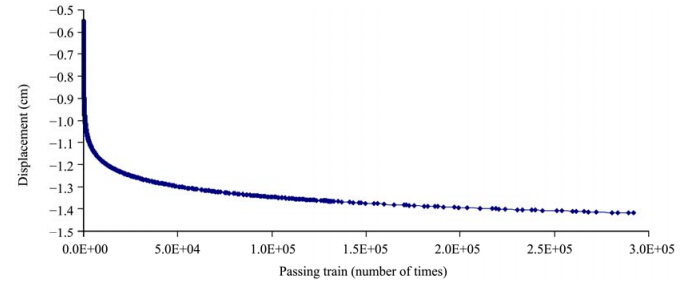
For embankments, the vertical vibration displacement under repeated train loadings should be the subject of more research. Figure 4 shows the displacement-time curve after 292, 000 trains passing of a point at the center of the top surface of the embankment; Figure 5 shows the displacement-time curve after 292, 000 trains passing of a point at the center of the shoulder of the embankment. As can be seen, the creep deformation trends were similar. However, the amount of deformation varied depending on the position. The deformation at the center of the top surface of the embankment was much larger, reaching as much as 2.08 cm, than that at the road shoulder, which was just 1.42 cm. Moreover, the maximum deformation rate occurred in the first stage(within 10, 000 trains passing), and the deformation rate decreased with the increasing time.
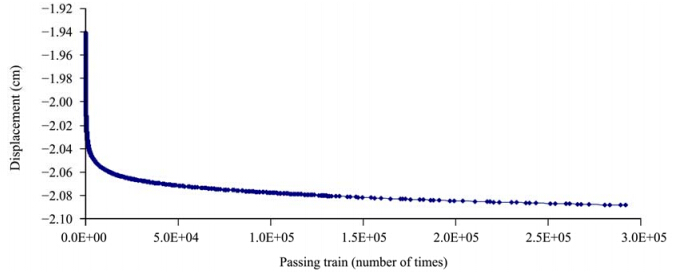 |
| Figure 4 Vertical displacement-time curve at the center of the embankment surface |
 |
| Figure 5 Vertical displacement-time curve at the shoulder of the embankment |
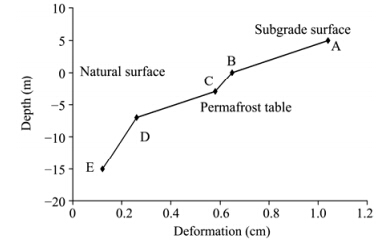
In order to avoid repetition, the creep-time curves of points B to E at different depths below the embankment are not given here. They were the same as at point A, which was at the center of the top surface of the embankment; point B was located on the natural surface of the roadbed; and point C was located on the permafrost table. Figure 6 shows the distribution of vertical displacement along various depths within the embankment, and it can be seen that the influence of train load on the deformation of the subgrade gradually decreased with the increase in depth. The creep displacement of points A to E, after 292, 000 trains loading(the cumulative traffic volume in 50 years), could reach 2.09 cm, 1.30 cm, 1.16 cm, 0.52 cm, and 0.24 cm, respectively. The deformation characteristics of the different observation points indicated that after the railway was opened to traffic, the first embankment deformations were caused by its own weight and the train loads. With the increase in loading times, the deformation increased and then entered into the creep deformation stage. The deformation rate decreased gradually.
 |
| Figure 6 Distribution of displacement at various depths within the embankment |
From the embankment deformation process under repeated train loadings, the cumulative amount of deformation increased with the increase of train loading times. The greatest cumulative amount of deformation occurred at the center of the top surface of the embankment, reaching 2.1 cm.
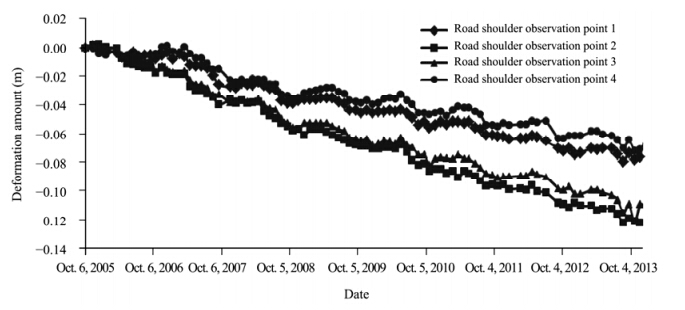
If our calculated results are correct, we can roughly analyze the share of permanent deformation induced by train load in the total deformation measured by other researchers. Figure 7 shows the total deformation process determined by Sun et al.(2013), which includes thawing settlement, compression deformation, and creep deformation from 2005 to 2013 in a typical subgrade section along the QTR. The maximum deformation of the embankment reached up to 12.2 cm. Based on the settlement and deformation calculation model put forward by Zhang et al.(2007), the total deformation can reach to about 10 cm, which is consistent with their field monitoring results. According to that model, the total subgrade settlement deformation after 50 years could reach 30 cm. Comparison of these results suggests that the deformation induced by train loads is less than 10% of the total deformation.
 |
| Figure 7 Deformation process in a typical subgrade section of the QTR(data from Sun et al.,2013) |
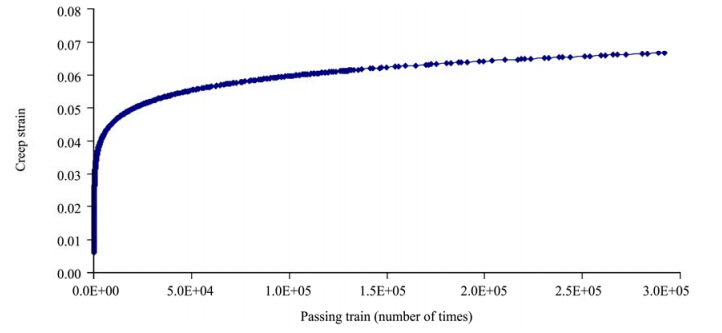
Figure 8 shows the contour plot of shear strain of the embankment after 292, 000 trains loading(the cumulative traffic volume in 50 years). In the figure, the largest shear strain occurs on both slope toes of the embankment under the long-term impact of train loading, the value of which can reach 0.186. Furthermore, the large strain zone which extended upwards from the slope toe gradually forms a continuous plane. Figure 9 shows the contour plot of equivalent creep strain(CEEQ)of the embankment after the same number of train loadings. The maximum cumulative creep strain occurs on both slope toes of the embankment and it is shown to be 7%. Figure 10 shows the creep strain-time curve of the embankment slope toe. With the increase of time, the creep strain increases while the rate decreases. This analysis shows that reinforcement on both sides of the slope toe should be considered in the QTR.
 |
| Figure 8 Contour plot of shear strain of the embankment after 292, 000 train loadings |
 |
| Figure 9 Contour plot of equivalent creep strain of the embankment after 292, 000 train loadings |
 |
| Figure 10 The creep strain-time curve of the embankment slope toe |
Based on real-time vibration tests which were carried out on a typical embankment at the Beilu River segment along the Qinghai-Tibet Railroad, the train loads were converted to equivalent creep stress using the acceleration waveforms at the shoulder when the trains passed. From the study of the rheological properties of frozen soil, a creep equation was introduced and a time-hardening power function rule and the Drucker-Prager yield and failure criterion were applied. A creep model was established to simulate the creep effect of a plain fill embankment at a permafrost area of the QTR. The main conclusions of this paper are as follows:
1)A coupled creep model derived from a time-hardening power function rule and the Drucker-Prager yield and failure criterion could reflect the long-term effects of train loads on a QTR embankment. With the increase in time, the embankment had different deformation characteristics and the calculated values of the deformation also became larger.
2)The effect of deformation under train loads accounted for about 10% of the total settlement of the embankment. In the vertical direction, the influence of train loads on the deformation of the subgrade gradually decreased with the increase in depth. The deformation at the center of the top surface of the embankment was much larger than that at the shoulders. The creep strain value of the slope toe was the greatest and increased gradually with time, while the strain rate decreased.
3)Under the long-term impact of train loads, the maximum shear strain occurred at the bottom of both slopes, and the shear strain gradually extended upwards from the toe position. Moreover, the maximum creep strain occurred on both sides of the toe position, and a steady upward trend of creep strain was observed as well, which means that embankment reinforcement in the QTR should be considered.
Acknowledgments:This work was supported by the National Key Basic Research Program of China(973 Program)(No. 2012CB026106), the Program for the Innovative Research Group of the National Natural Science Foundation of China(No. 41121061), and the Project for Excellence, State Key Laboratory of the National Natural Science Foundation of China(No. 41023003).
| Cheng G, 2002. The interacting of Qinghai-Tibet Railway and permafrost and the environmental effect. Publication of Chi-nese Academy of Sciences, 17(1): 21–25. |
| Dassault Systèmes Simulia Corp. (Dassault), 2010. ABAQUS Theory Manual: ABAQUS 6.10 Help Documentation. Available at: http://www.simulia.com (Cited in Mar. 12, 2013). |
| Fei K, Zhang JW, 2010. Application of ABAQUS to Geotechnogical Engineering. Beijing: China Water Power Press. |
| Gu HD, 2009. Numerical analysis of frozen soil foundation under traffic dynamic loads. Ph.D. dissertation, Harbin Institute of Technology, Harbin, China. |
| Li SY, 2008. Numerical study on the thermal-mechanical stability of railway subgrade in permafrost regions. Ph.D. dissertation, Graduate University of the Chinese Academy of Sciences, Beijing, China. |
| Li SY, Zhang MY, Zhang SJ, et al., 2008. Analysis of the dynamic response of Qinghai-Tibetan Railway embankment in permafrost regions under train load. Journal of Glaciology and Geocryology, 30(5): 860–867. |
| Liao GY, Huang XM, 2008. ABAQUS finite element software application in road engineering. Ph.D. dissertation, Southeast University, Nanjing, China. |
| Shi YH, 2011. Study on stability of permafrost subgrade under train loading and freeze-thaw. Ph.D. dissertation, Beijing Jiao-tong University, Beijing, China. |
| Sun ZZ, Ma W, Dang HM, et al., 2013. Characteristics and causes of embankment deformation for Qinghai-Tibet Railway in permafrost regions. Rock and Soil Mechanics, 34(9): 2667–2671. |
| Wang LN, Ling XC, Zhang F, et al., 2009. Field monitoring on vibration acceleration response of railway in seasonal frozen region of Daqing induced by train-steering in winter. Science Paper Online, 4(7): 507-511. |
| Wang LM, Wu ZJ, Sun JJ, et al., 2009. Characteristics of ground motion at permafrost sites along the Qinghai-Tibet Railway. Soil Dynamics and Earthquake Engineering, 29(6): 974–981. DOI: 10.1016/j.soildyn.2008.11.009. |
| Wang TX, Hu CS, Li N, 2002. Stress-strain numerical model for frozen soil subgrade. Chinese Journal of Geotechnical Engi-neering, 24(2): 193–197. |
| Wu ZJ, Ma W, 1994. Strength and Creep of Frozen Soil. Lanzhou, China: Lanzhou University Press. |
| Xu XY, Zhong CL, Chen YM, et al., 1998. Research on dynamic characters of frozen soil and determination of its parameters. Chinese Journal of Geotechnical Engineering, 20(5): 80–84. |
| Yu Y, 2006. Study on dynamic response of frozen embankment under train vibration load. Ph.D. dissertation, Harbin Institute of Technology, Heilongjiang, China. |
| Zhang JM, Liu D, Qi JL, 2007. Estimation on the settlement and deformation of embankment along Qinghai-Tibet Railway in permafrost regions. China Railway Science, 28(3): 12–17. |
| Zhang QL, Bai CG, Wang HF, 2012. Test research of soil under triaxial impact loading. Laboratory Science, 15(2): 77–80. DOI: 10.3969/j.issn.1672-4305.2012.02.026. |
| Zhao SY, Zheng YR, Zhang YF, 2005. Study on slope failure criterion in strength reduction finite element method. Rock and Soil Mechanics, 26(2): 332–336. |
| Zheng B, Zhang JM, Ma XJ, et al., 2009. Study on compression deformation of warm and ice-rich frozen soil. Chinese Journal of Rock Mechanics and Engineering, 28(Supp.1): 3063–3069. |
| Zheng B, Zhang JM, Ma XJ, 2006. Studying and thinking on set-tlement of railway roadbed in permafrost regions. China Safety Science Journal, 16(12): 140–144. |
| Zhu ZY, 2009. Train-induced vibration response and subsidence prediction of permafrost subgrade along Qinghai-Tibet Railway. Ph.D. dissertation, Harbin Institute of Technology, Hei-longjiang, China. |
 2015, 7


