Experimental investigations of freezing soils at ground conditions of Astana, Kazakhstan
1 Introduction
Frost susceptibility of soils influence stability of buildings and construction. Since soil volume increases during freezing conditions and according to soil type(silty, clay), differential uplifting of foundations could depend on moisture degree(Hoekstra et al.,1965; Konrad, 1980). Also, differential settlement could damage foundation stability after freezing-thawing conditions. Soil conditions in Astana are linked with clayey and silty soils which have high frost susceptibility, and ground water level is located near the soil surface. Therefore, experimental investigation of frost susceptibility is very important for Astana. The definition of frost characteristics for soils predicts unsuspectible deformation of soil ground. Also, extra measures such as monitoring systems could be utilized to predict frost susceptibility. In-situ monitoring systems of frost depth provides freezing depth results and moisture content, important for projects designed in areas of frozen surficial deposits(Shin et al.,2011).
2 Soil specimen properties and freezing experiments
It is important to know soil ground properties to determine frost susceptibility, which is necessary for design and construction of buildings in frozen environments(Zhussupbekov et al., 2011). Frost susceptibility could be estimated roughly by freezing soil normative according to soil properties.
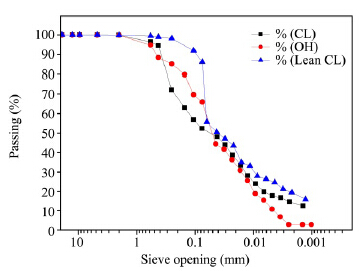
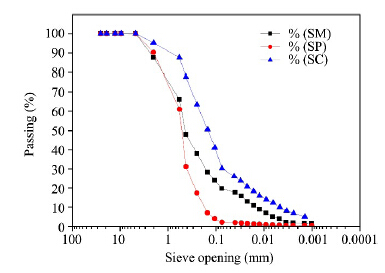
In this study, we used a special mold which could eliminate the side friction between soil and wall. The geotechnical properties of soil specimens are presented in Table 1(Shakhmov, 2012, 2013, 2014). Also, the grain size distribution curves of the soils are presented in Figure 1 and 2.
Table 1 Geotechnical properties of soil specimens
| |
| Description | Sandy lean clay | Lean clay | Clayey sand | Organic silt | Silty clayey s and | Poorly graded sand |
| Specific gravity(Gs, kN/m3) | 2.62 | 2.61 | 2.62 | 2.63 | 2.67 | 2.63 |
| Natural water content(wn, %) | 21.00 | 27.00 | 32.00 | 54.00 | N.P. | N.P. |
| Particle size(Passed No. 200)(%) | 52.00 | 86.10 | 30.20 | 66.00 | 19.60 | 1.90 |
| Liquid limit(LL, %) | 27.01 | 42.00 | 25.00 | 50.50 | N.P | N.P |
| Plastic limit(PL, %) | 17.75 | 17.00 | 15.00 | 31.94 | N.P | N.P |
| Maximum dry unit weight(γdmax, kN/m3) | 1.79 | 1.76 | 1.79 | 1.27 | 1.93 | 1.92 |
| Optimum water content(wopt, %)USCS | 15.90 CL | 18.00 CL | 15.90 SC | 32.25 OH | 12.40 SM | 11.50 SP |
| AASHTO | A4 | A7-5 | A-2-4 | A7 | A-1-a | A-3 |
| GOST 25100-95 | Clay loam, light silty | Clay, light silty | Clay sand | Clay, light silty | Middle size particle sand | Sand with large particle |
| |
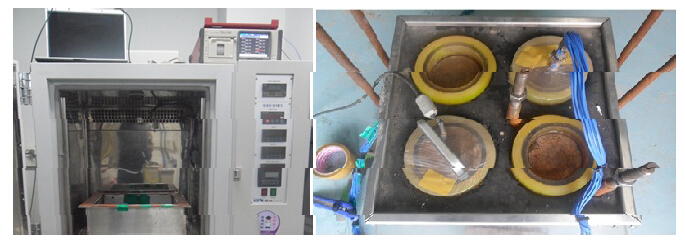
The specimens were remolded and prepared in a special mold appropriate for the freezing chamber. They were placed into the freezing apparatus(Figure 3)after full saturation(Shin et al., 2012a, b; Zhussupbekov et al., 2012, 2015).
The top and bottom plates of the specimens were held at 3 °C for 24 hours. The first freezing period started at the beginning of the second 24 hours period. The temperature of the top plate was lowered to −3 °C, and the temperature of the bottom plate was kept at 3 °C for 8 hours(ASTM D 5918-06).
According to Transport and Road Research(TRRL)Laboratory, after a pre-test conditioning period of 24 hours at room temperature, the trolley is wheeled into a cold room operating at −17 °C. The push rod system was zeroed so as to allow subsequent frost heave to be determined during the 10-day freezing period(Jones and Lomas, 1984).
According to Kazakhstan normatives, sands with coarse and average size particles, solid and semi-solid clay, and loams are not considered as frost heaving soils or susceptible to frost.
3 Experimental freezing test results and discussion
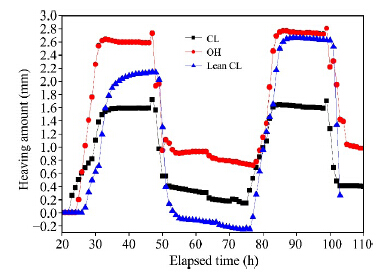
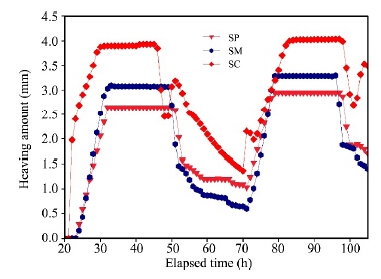
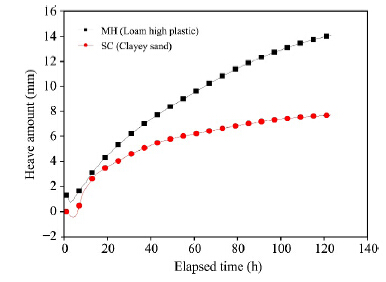
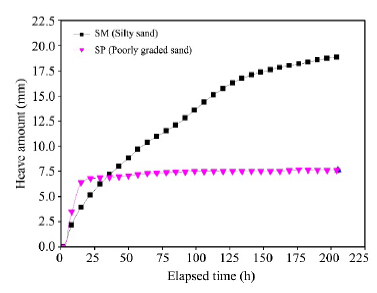
Experimental freezing tests were performed to determine frost susceptibility of soils and prediction of possible frost action in the region of Kazakhstan. Frost heaving results of the soil specimens after two freeze-thaw cycles are presented in Figures 4 and 5.
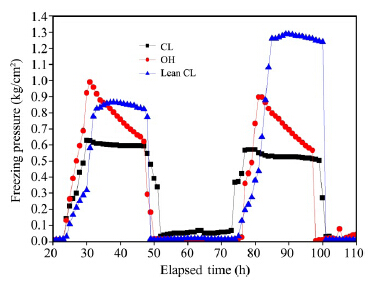
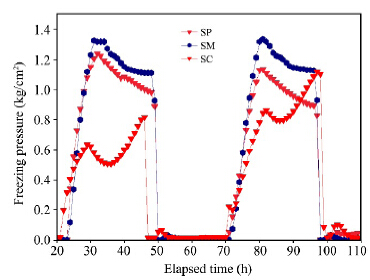
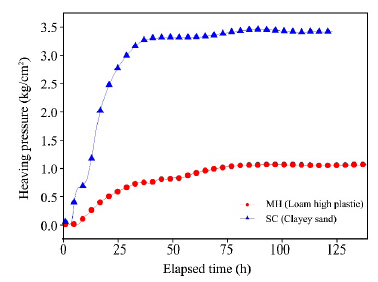
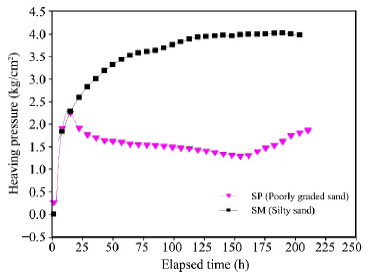
Frost heaving pressure of soil specimens according to ASTM are presented in Figures 6 and 7. The heave amount of the soil is also related to frost susceptibility of the soil. When the soil temperature decreases, ice cyrstals first form in the center of the pores. The molecules of the outer water film also start to join with the ice crystal by decreasing temperature. The water film has a tendency to return to their original thickness in places where the ice crystal has penetrated the film and therefore the film pushes the ice crystal further away from the soil particles(Keinonen, 1960).
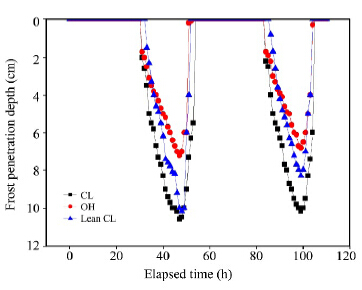
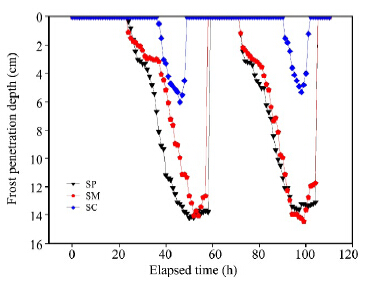
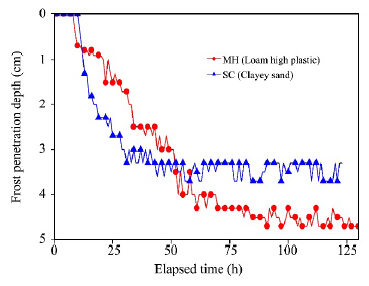
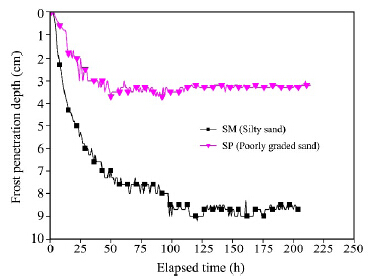
The freezing depth results of the soil specimens are presented in Figures 8 and 9. Also, results of the freezing test and the TRRL test were compared in Figures 10 and 11. The frost heaving amounts of soil specimens were presented in these curves.
The results of the frost heaving pressure of soil specimens by TRRL are provided in Figures 12 and 13. Previous researches(Penner, 1961; Shin and Park, 2012; Shin et al., 2013)demonstrated that the reason for frost-heaving is the formation of ice-lens in the soil and that a thin water layer must exist between soil particles and ice so that the ice-lens may be segregated from the soils(Taber, 1929; Beskow, 1935).
The freezing depth results by TRRL are presented in Figures 14 and 15. At present, research has not been able to explain the physical aspects in the formation of frost heaving pressure. There is no quantitative evaluation technique to determine frost heaving pressure interacting with the foundation of buildings and other underground structures. Taber(1929)studied the pressure swelling of frozen clayey soils and noted that the swelling pressure was 0.27 MPa in a closed system and over 1.4 MPa in an open system with inflow of water from the outside. An experimental study of frost heaving was conducted by Morarescul and Dalmatov(1959)showing that the heaving pressure was almost the same in freezing of the soil in conditions of open and the closed system. Also, the pressure depended on temperature, freezing time, and compressibility of the underlying layer when the soil thawed and reached 0.5 MPa to 1.0 MPa.
The frost penetration rate depends on ground thermal properties, moisture content, and ambient air temperature. The density, conductivity of soil particles and water content of the soil are influenced by thermal conductivity of soils(Miller, 1972). Because clay particles have a higher insulation value than those of silt or sand particles, clay soils normally retain more moisture than silt and sand . Thus, the depth of frost penetration is usually greater in silt and sand (light-textured soils)than in clays and silty clays(heavy-textured soils).
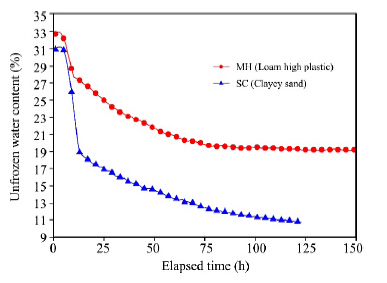
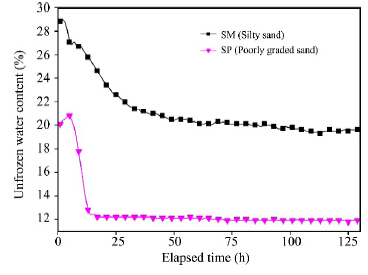
Unfrozen water content during a freezing period is presented in Figures 16 and 17(Shin et al., 2005). Results show that unfrozen water content in sandy soils decrease rapidly compared with silty soils.
The process of water migration from bottom to top during a freezing period is complicated, with complex development forces in various climatic conditions. Moisture migration depends mainly on water movement on the films surrounding firm particles, owing to a gradient of an attraction forces of water molecules on the surface of firm particles with freezing borders within an absorption zone. Thus, it is necessary to emphasize the extreme complexity process of moisture.
The freezing pressure and heaving amount of soil specimens change with frost susceptibility of the soil. According to TRRL results, frost susceptibility properties like frost heaving could reach more than 18 mm and heaving pressure 400 kPa. Frost heaving heigth and pressure at these levels could damage roads and other light-weight construction such as one to two store buildings, roads, and dams(Dalmatov, 1957; Nevzorov, 2000; Abzhalimov, 2008).
4 Monitoring of frost penetration in Kazakhstan
Frost penetration is an important parameter for earth works and road construction in cold regions. The frost penetration for road construction is calculated by(Teltaev, 2013):
| $Z = \sqrt {\frac{{\lambda T}}{{273.15\rho W\gamma }}\left[ {{t_{{\rm{liq}}}} - {t_{{\rm{gas}}}} + ({t_{{\rm{gas}}}} - {t_{{\rm{sol}}}})\frac{{{R_n} + {R_0}}}{R}} \right]} $ |
(1)
|
where
λ isthe coefficient of thermal conductivity of frozen soil, (W/(m·K));
T is the time of soil freezing, (hour);
ρ is the latent heat of ice, which is equivalent to 0.341((W·h)/kg);
W is the moisture of soil, expressed as a decimal(%);
γ is the density of soil(kg/m
3);
tgas,
tliq,
tsol are the temperatures of air, water and ice formation, °C, respectively;
Rn is the thermal resistance roadbed, ((m
2·°C)/W);
R0 is the thermal resistance of the road pavement, ((m
2·°C)/W);
R is the total thermal resistance, ((m
2·°C)/W).
Climate of the Astana region is sharply continental and arid. The winter is severe and long with firm snow cover. The ground in this region is insufficient and unstable according to moisture content moistening. Annual changes of air temperature is due to strong frost during winter, and increase in land temperature during the short spring and summer seasons.
The average monthly and annual temperature changes in the Astana region according to data from Kazakhstan Hydro-Meteorological Republican State Enterprise are presented in Table 2.
Table 2 Average low temperature of the cold months
| |
| January(°C) | February(°C) | March(°C) | November(°C) | December(°C) | Year | F, freezing index(°C∙d) |
| −14.1 | −14.8 | −1.9 | −2.0 | −12.4 | 2001 | 1, 354.8 |
| −6.3 | −5.6 | 0.9 | −2.5 | −17.8 | 2002 | 978.9 |
| −13.6 | −15.1 | −9.3 | −6.9 | −9.5 | 2003 | 1, 634.2 |
| −14.8 | −9.6 | −7.5 | −1.4 | −12.8 | 2004 | 1, 398.9 |
| −14.3 | −19.1 | −3.2 | −2.3 | −10.5 | 2005 | 1, 471.8 |
| −23.0 | −10.7 | −1.6 | −3.2 | −7.0 | 2006 | 1, 375.2 |
| −8.5 | −10.9 | −9.0 | −4.4 | −12.9 | 2007 | 1, 379.6 |
| −21.5 | −13.6 | 0.2 | −0.9 | −11.4 | 2008 | 1, 427.7 |
| −13.5 | −16.0 | −4.5 | −4.0 | −14.0 | 2009 | 1, 560.0 |
| −19.4 | −20.0 | −6.7 | 0.2 | −12.6 | 2010 | 1, 759.7 |
| −18.5 | −13.6 | −7.4 | −8.8 | −15.0 | 2011 | 1, 912.7 |
| Source: Kazakhstan Hydro-Meteorological Republican State Enterprise, 2011. |
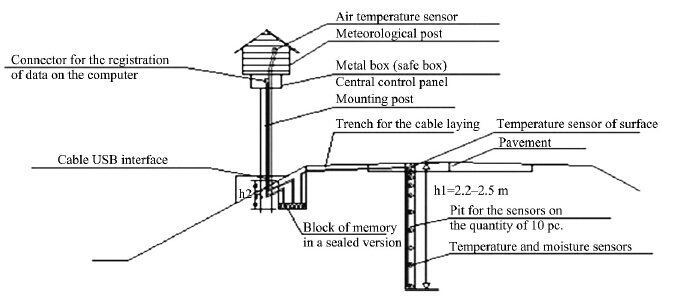
Recently, road construction in Kazakhstan has become very important, especially the remarkable highway between Astana and Borovoe(Astana-Borovoe Highway). Therefore, it is very important to monitor frost penetration along this road. The scheme of the monitoring system is presented in Figure 18, and composition of the two type pavement is presented in Table 3.
Table 3 Composition of two type pavement layers
| |
| Asphalt pavement | Thickness(cm) | Concrete pavement | Thickness(cm) |
| Stone-mastic asphalt concrete layer | 6.0 | Cement-concrete layer | 26.5 |
| Geogrid | 0.4 | Coarse grain sand layer | 23.5 |
| Coarse grained layer | 9.0 | Macadam layer | 30.0 |
| Black crashed stone layer | 12.0 | Subgrade layer(clay, loam) | -- |
| Crushed stone layer reinforced by 7% cement | 18.0 | | |
| Crushed stone layer | 15.0 | | |
| Screening crushing layer | 20.0 | | |
| Subgrade layer(silt, clay) | -- | | |
| |
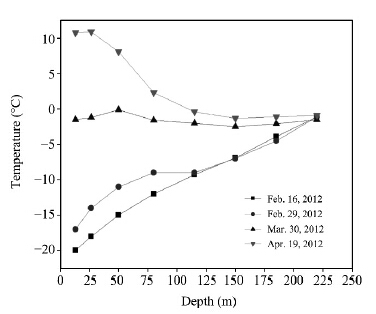
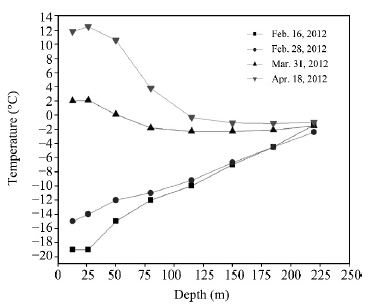
The monitoring system was installed at two different locations(about 40 km between locations)along the road. The first one was installed in asphalt surface pavement and the second one in cement-concrete pavement. Measurement results during winter and spring for the two types of pavement are presented in Figures 19 and 20.
The results and analytical calculations according to Kazakhstan normative are comparable(Table 4). Frost penetration depth of estimated and graph analytical methods are calculated according to Kazakhstan recommendation normative R RK 218-38-04(2004).
Table 4 Comparison results of frost penetration
| |
| Methods of define frost depth | Asphalt pavement | Concrete pavement |
| Estimated | 2.33 m | 2.35 m |
| Graph-analytical | 2.01 m | 2.01 m |
| Monitoring | 2.30 m | 2.50 m |
| |
These results show that monitoring of frost penetration depths provide accurate data compared to estimated and graph-analytical methods. Also, calculation by the estimated method provides better results compared to graph analytical method. Thus, the estimated method could be used if monitoring is not an option.
5 Conclusions
In this paper, a number of freezing test were performed to describe the frost heave rates in the region of Kazakhstan, and a monitoring system was set up on the Astana-Borovoe Highway. Moreover, the frost heaving rate and pressure of different types of soil specimens were used in soil ground, and the most appropriate soil type was determined. Frost depth results of the monitoring system for asphalt surface and cement-concrete surface pavement show higher values than calculations of the analytical method. These results show that the monitoring system has a significant contribution in defining the accuracy of frost penetration depth. There are several ways to prevent frost heave damage to construction in frozen soils of Kazakhstan. The frost heaving susceptible soil could be replaced by granular soil. A drainage system must be developed to dissipate water sources from the road. Finally, design and construction should be developed with consideration of frost penetration depth, freezing index, frost susceptibility characteristics, and embankment height of the road.
Acknowledgments:
The author express his deep gratitude for guide and support of the research study in freezing geotechnical laboratories to Prof. Eun Chul Shin(Incheon National University, Incheon, Republic of Korea) and also to Dr. Bagdat B. Teltaev(KazDorNII, Almaty, Kazakhstan)for giving possibility participate in the research by using of monitoring system in the field conditions.
 2015, 7


