Article Information
- Andrei Petriaev. 2015.
- Stress states of thawed soil subgrade
- Sciences in Cold and Arid Regions, 7(4): 348-353
- http://dx.doi.org/10.3724/SP.J.1226.2015.00348
Article History
- Received: February 15, 2015
- Accepted: May 22, 2015
1 Introduction
Operating experience with railway subgrades has shown that with the increasing weight and speed of trains, even at constant axle loads, subgrade deformations appear certain places where they have not been before. In most cases the noted subgrade defects are the result of the dynamic vibration impact on the strength and deformation characteristics of soils while trains pass.
Previous research(Pupatenko, 1993; Prokudin et al.,1999; Prokudin and Zhuravlev, 2001; Petryaev and Ganchits, 2003; Stoynovich, 2005; Petryaev and Morozova, 2013; Wang et al.,2013;Kolos and Morozova, 2014; Petriaev, 2015)has shown that the rolling load over thawed soils causes uneven stress states of the ballast and subgrade soil at different points of the cross section. However, there is a lack of studies examining the distribution of horizontal and vertical stresses in thawed soil subgrade. Our experiments give an opportunity to present a general picture of the stress changes and their pulsations at different depths under a track panel during the thawing.
2 The method of assessing the problemIn order to identify the magnitude and stress distribution in the thawed soil subgrade during the passage of trains, PSTU conducted experimental studies on the October railway in the spring period. Freight trains were presented by st and ard cars with locomotives VL-23 with axle load 230 kN and passenger trains with locomotives CS-6, CS-2T with axle load 210 kN.
This stress distribution study was carried out with the use of oscillogram recordings during the passage of trains at different speeds. The sensors installation scheme is given in Figure 1. Waveform analysis clearly showed that the nature of the vertical and horizontal stresses in the ground was significantly different. Vertical sensors clearly recorded the passage of rolling stock and accurately registered the bogie axles. Therefore, the curve of stresses is conventionally divided into the following components: total stresses σf, static stresses σst, and stress pulsation Δσ.
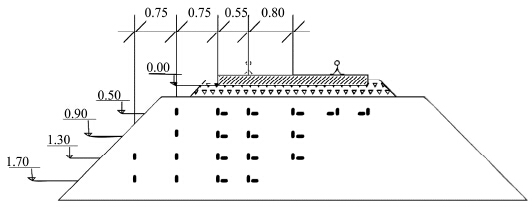 |
| Figure 1 The sensors installation scheme |
In our opinion, the static component mostly depended on the rolling load per meter of the subgrade, and the dynamic component characterized the stress pulsation resulting from unsprung mass, track irregularity, and wheel thread. Sensors recording the horizontal stresses also registered the static component, but the magnitude of the horizontal stresses was less than of the vertical ones. The magnitude of the total stresses depended on the speed of the rolling stock and the axle load. As the speed and load rose, the total stresses increased according to the indications of both the vertical and horizontal earth pressure cells.
3 DiscussionWhen the distance from the sleeper sole increased, the magnitude of σst decreased and its registration duration increased due to the increased impact load time at the point of stress measurement. Vertical stress bursts corresponded to the passage of mounted wheels on the sleeper.
The ratio of the total vertical stresses and their pulsations in the ballast at a depth of 10 cm from a sleeper bed during the passage of the rolling stock was in the range of 0.40 to 0.45. With increasing depth, the ratio of Δσ/σf reduced and was 0.30-0.35 at a depth of 50 cm, 0.20-0.25 at a depth of 90 cm, and 0.15-0.20 at a depth of 130 cm. These data show that when the depth increased, the proportion of static stresses σst within the total stresses σf increased due to the impact of the adjacent axles of the rolling stock.
The axle load and the rolling stock unsprung mass had a great influence on the pulsation magnitude. The passage of the locomotive VL-23, the unsprung mass of which was almost three times more than that of rolling stock with bogies CRI-X-3, caused stress pulsations 1.5 to 1.7 times greater than that of loaded wagons.
Empty or not fully loaded wagons caused dynamic stresses which were 25%-50% less than those of the locomotive. Stresses arising from the passage of passenger locomotives were 40%-50% more than those under wagons at a level of 50 cm from the sleeper sole. When removed from the sleeper sole, there was a significant reduction of stresses during the passage of passenger cars due to their lower axle and linear loads. A comparison of the stress oscillograms recorded during the passage of freight locomotives and loaded wagons, gondolas, and tank cars showed that stresses arising from their passage were practically the same. However, with the passage of freight trains consisting of hopper wagons, special carriages, and wagons for transporting heavy bulk materials, there were stresses on the top of the subgrade, which in some cases exceeded similar stresses arising from the locomotive VL-23. They resulted from the greater axle loads of those rolling stocks.
Based on experimental data, the distribution of the maximum probable stresses in the roadbed is shown in Figure 2, which indicates that the trains' dynamic vibration impact caused uneven stress states along the sleeper length. The maximum stresses were recorded in the rail cross section, and the minimum stresses were registered along the center of the track. Taking the magnitude of the vertical stresses σz in the rail cross section at a level of 10 cm from the sleeper sole as 100%, the value of these stresses at the end of a sleeper amounted to 55%-70%. With increasing depth, the gradual adequation of stresses along the length of a sleeper took place. Therefore, at a depth of 80-90 cm from the sleeper sole, vertical stresses at the end of the sleeper were 65%-85% of the value for the rail cross section.
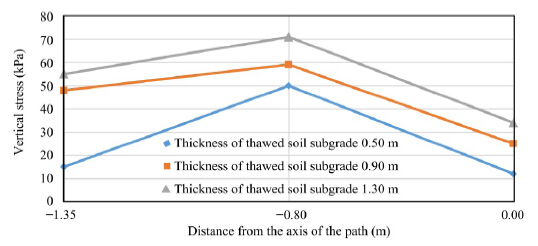 |
| Figure 2 Distribution of the total vertical stresses along the length of a sleeper at a depth of 0.90 m |
At a depth of 130-170 cm, the stresses were almost aligned, and a similar pattern was observed in the center of the track cross section. If at a distance of 50 cm from the sleeper sole the stresses were 23%-35%, at a depth of 90 cm they were 45%-53% of the stresses in the area under the rails.
The distribution of the total horizontal stresses resulting from a rolling load in the cross section of the subgrade is presented in Figure 3. The results of field experiments were obtained during the passage of the locomotive VL-23 at a speed of 70 km/h.
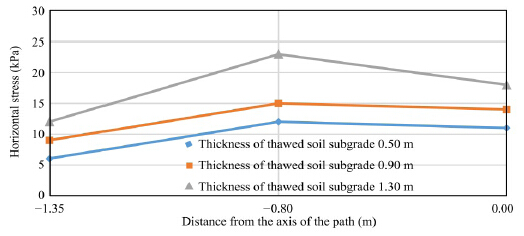 |
| Figure 3 Distribution of the total horizontal stresses along the length of the sleeper at the depth 0.90 m |
A similar dependence was fixed for other speeds. These data indicate that a high stress level registered in the roadbed and an uneven stress state along the length of the sleeper, due of the dynamic vibration impact of trains in the horizontal plane. The maximum stresses were recorded in the area under rails, reaching 0.05 MPa under the sleeper sole during the passage of the locomotive VL-23 at a speed of 70 km/h. The maximum absolute value of the vertical compressive stresses σz in the area under the rails certainly caused the maximum horizontal stresses σy.
It should be noted that the zone of the uneven stress state of the ballast under the sleeper, in both the horizontal and vertical planes within the studied speed intervals, was for all practical purposes determined by the location of the frozen soil surface. The nature of the stress state of the subgrade soil was significantly influenced by the location of the frozen and thawed soil boundary in the subgrade. With the increasing depth of thawed soil, there was a gradual rise in the ratio of stresses in the area under the rails and at the end of the sleeper. The share of stresses at the end of the sleeper arising from stresses in the under-rail section at the thawed layer depth of 50-90 cm was 93%, and at the frozen layer boundary of 130-160 cm it was 57%.
Thus, in typical designs of track structure, the upper part of the subgrade sustains uneven loading in the transverse and vertical directions. This creates dangerous sections for the development of inadmissible residual deformations under adverse combinations of operational factors during the thawing season.
Studies of the effect of train speed on the magnitude of the total stresses in thawing subgrade were carried out on experimental sections during the passage of locomotives CS-6, CS-2T, and VL-23. Figure 4 shows the dependence of the total probable maximum horizontal stresses across the track in the under-rail cross section on the speed of freight and passenger locomotives. Stresses in the roadbed were measured when the speed of locomotive VL-23 was 40-70 km/h, and when the speed of the locomotive CS-2T was 80-120 km/h.
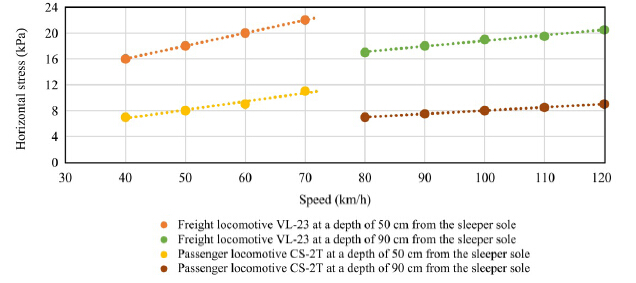 |
| Figure 4 Dependence of the horizontal stresses in the under-rail cross section on the speed of freight and passenger locomotives |
As shown in Figure 4, the horizontal stress had a linear dependence on the speed of trains in the realizable speed range:
| $\sigma = {\sigma _b} + {K_v}\left( {{V_i} - {V_b}} \right)$ | (1) |
If we consider the ratio Kv behavior under the rail section, with increasing depth its value changed in both ballast and in soil. For the locomotive CS-6, the horizontal stress rise rate at a depth of 90 cm was 0.25(kPa·h)/km and at a distance of 170 cm from the sleeper sole it was 0.125(kPa·h)/km.
In addition, the value of Kv varied in different sections(in the area under rails, at the end of the sleeper, and in the center of the track). When the depth of the thawed layer was 130-160 cm, at a depth of 90 cm under the sleeper sole in the cross section along the center of the track, the σy enlargement ratio with increasing speed of the locomotive VL-23 was 0.32(kPa·h)/km; in the under-rail section it was 0.42(kPa·h)/km; and in the cross section at a distance of 75 cm from the end of the sleeper, Kv was reduced to 0.035(kPa·h)/km. Thus, the train speed had a considerable impact on the magnitude of the horizontal stresses.
A similar linear relation could approximate the dependence of the vertical stresses on the train speed; our results were similar to those obtained by Stoynovich(2005). Typical diagrams for the under-rail section are shown in Figure 5.
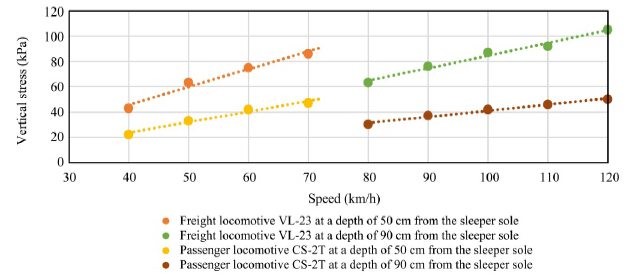 |
| Figure 5 Dependence of the vertical stress in the under-rail cross section on the speed of freight and passenger locomotives |
With increasing train speed, the vertical stress rise rate determined by the value of Kv was greater than the corresponding value of the horizontal stress. Thus, in the under-rail section at the level of the track formation, the Kv values for the vertical and horizontal stresses were 0.40(kPa·h)/km and 0.15(kPa·h)/km, respectively. With increasing train speed, stresses increased most intensively in the under-rail section, they were lessened at the end of the sleeper, and barely changed along the center of the track.
The stress rise rate changed with both increasing train speed and changes in the track plan. On track curves, due to the rise of horizontal transverse loads, the horizontal stress rise rate increased and , as a result, their absolute values increased. For example, on an experimental track located at the end of a circular curve(R = 2, 500 m), in the under-rail section at a depth of 50 cm from the sleeper sole and with a thawed layer 90-130 cm thick, the horizontal stress rise rate under the locomotive CS-6 was 0.25(kPa·h)/km, while under similar conditions on a tangent track, Kv = 0.10(kPa·h)/km. During the passage of the locomotive CS-6 at a speed of 120 km/h, the value of σy on the tangent track was 11(kPa·h)/km, while on the curved track it increased to 23 kPa. In comparison, with increasing train speed, the vertical stress rise rates in both sections were almost identical, being 0.78(kPa·h)/km on the curved track and 0.75(kPa·h)/km on the tangent track.
The same levels of stresses arising in the subgrade and in the ballast layer were registered during the passage of passenger and freight locomotives, the speed of the former being more than 30-50 km/h. It should be noted that with the increasing train speed, the value of the horizontal/vertical stress ratio also rose. In the under-rail section at a depth of 0.90 m from the sleeper sole, with a thawed soil layer 130-160 cm thick, the passage of the locomotive VL-23 at speeds of 50, 60, and 70 km/h produced stress ratios of 0.21, 0.25, and 0.33, respectively. This increase was due to the more intensive growth of the horizontal stresses compared to the vertical ones.
The stress ratio increased due to the train speed at a certain point of the subgrade cross section, which varied depending on the type of the rolling load, the design of the track structure, the thickness of the ballast layer, and the soil comprising the roadbed. Therefore, Kv values obtained in our experiments characterized the stress rise with the increasing train speed in these soil conditions at these features of the track.
Our study of the stress distribution in the depth of the ballast and subgrade was carried out according to the oscillogram data, which were recorded by earth pressure cells at various levels under a sleeper sole. To compare the results, horizontal and vertical stresses were registered when the locomotives ES-6, ES-2T, and VL-23 were run on the track at different speeds. Figure 6 illustrates the attenuation of the total stresses in the under-rail section of the sleeper when the locomotive VL-23 ran at speeds of 40 and 70 km/h. In all the cross sections under the sleeper sole, the stresses rose with the increasing train speed and , at the same time, the rate of stress attenuation in the upper part of the ballast also rose. This indicates the crucial role of the ballast layer strength in order to reduce stresses arising from rolling loads.
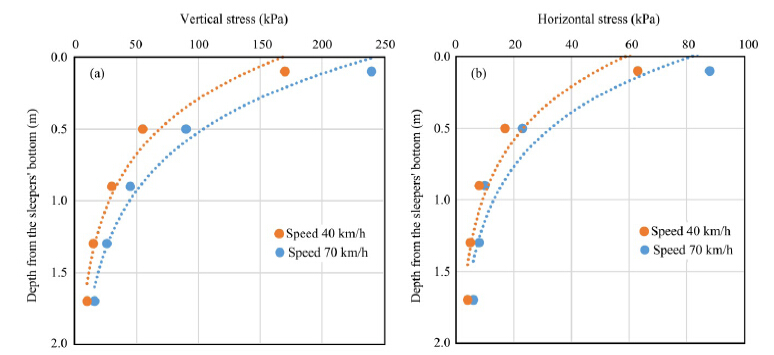 |
| Figure 6 Attenuation of the horizontal and vertical stresses at various depths in the under-rail section of a sleeper from the passage of locomotive VL-23 |
To further elucidate the nature of stress attenuation at various depths, Figure 7 presents the change in the depth of the indicator δ, defined as the ratio of the stresses registered at a certain depth from the sleeper sole σh to the stresses directly under the sleeper sole σ0. The resulting curves were nearly exponential, with index lgδ.
 |
| Figure 7 The attenuation ratio of stresses at various depths |
The attenuation of horizontal stresses σy in the vertical section along the center of the track was different from that in the under-rail section and at the end of the sleeper. From the surface to a depth of 80-90 cm from the sleeper bed, the transverse stress rose due to the increasing impact loads in the area under the rails. Further, with the increasing depth, its gradual attenuation occurred. This pattern of stress attenuation occurred when the middle part of the sleeper was not supported on ballast. Also, the distribution and attenuation of the stress pulsation under the track panel had dependencies similar to those of the total stresses.
4 ConclusionsThe results obtained during the field studies of the stress states of roadbed thawed soil subgrade during the passage of trains led to the following conclusions:
1)Stress rise was directly proportional to the increasing train speed in the studied range. With increasing train speed, the stress rise rate was greater in thawing ground than in thawed soils.
2)The rolling load over thawed soil subgrade caused uneven stress states. In this study, the maximum stresses and their pulsations were recorded in the under-rail section.
3)The presence of a thawing layer significantly changed the nature of the stress state. On the boundary of the thawing and the frozen layer, the area of the horizontal transverse stress distribution increased. As the strength of the thawed layer increased, the horizontal stress maximum was shifted toward the slope.
4)The dynamic vibration impact arising from passing trains led to a rise in transverse stress and , as a result, the coefficient of earth pressure increased, the value of which rose with increasing speed.
5)Stress attenuation at various depths in the area under the rails and at the end of the sleeper had an exponential dependence.
| Kolos AF,Morozova AA, 2014. Tracks under-sleeper base in high axial loads. Road and Track Facilities, 7: 13-14. |
| Petriaev AV, 2015. Thawing railroad bed and methods of its reinforcing. Computer Methods and Recent Advances in Geomechanics. In: Proceedings of the 14th International Conference of International Association for Computer Methods and Recent Advances in Geomechanics. Kyoto, Japan, pp. 265. |
| Petryaev A, Morozova A, 2013. Railroad bed bearing strength in the period of thawing and methods of its enhancement. Sciences in Cold and Arid Regions, 5(5): 548-553. |
| Petryaev AV, Ganchits VV, 2003. The impact of geosynthetic materials on the vibrodynamic process subgrade soil. In: Problems and Prospects of Development of Railway Transport. Proc., All-Russian Scientific and Technical Conference, Ekaterinburg, Russia, Vol.1, pp. 59-62. |
| Prokudin IV, Kolos AF, Kuprashevich MV, 1999. Conserve resources in track facilities through the use of soil-concrete layer under ballast to strengthen the subgrade. Resource-saving technologies and technical means on the October Railway: Abstracts of Scientific and Technical Conference. St. Petersburg, Russia, pp. 105-107. |
| Prokudin IV, Zhuravlev IN, 2001. Modern geomaterials, model tests in the laboratory. In: Contemporary and Advanced Technologies to Track Facilities on October Railway. Proc., 43rd Scientific and Technical Conference, St. Petersburg, Russia, pp. 119-122. |
| Pupatenko VV, 1993.Subgrade strength of narrow gauge railways under the influence of rolling stock (In the context of the Sakhalin Railway).Ph.D. dissertation, St. Petersburg State Transport University, St. Petersburg, pp. 179. |
| Stoynovich GM, 2005. In Situ Study of the Dynamic Vibration Magnitude of the Impact of a Moving Load on the Ground. Khabarovsk: Khabarovsk Book Publishers, pp. 147. |
| Wang XZ, Zhang LF, Wang LN, et al., 2013. Field monitoring of railroad embankment vibration responses in seasonally frozen regions. Sciences in Cold and Arid Regions, 5(4): 393-398. |
 2015, 7


