Article Information
- SangYeob Kim, JongSub Lee. 2015.
- Strength and stiffness variation of frozen soilsaccording to confinement during freezing
- Sciences in Cold and Arid Regions, 7(4): 335-339
- http://dx.doi.org/10.3724/SP.J.1226.2015.00335
Article History
- Received: February 17, 2015
- Accepted: May 24, 2015
1 Introduction
The characteristics of frozen soils are different from those of unfrozen soils due to ice bonding in pores. As the soils are composed of four components including soil particles, water, air and immobility moisture, the ice-lens formed in frozen soils yields soil particle rearrangement and volume expansion such as heaving(Shunsuke, 1980). Furthermore, the characteristic variation of frozen soils is one of the most important factors of the foundation design for the stability of the frozen ground in cold regions.
Field tests in cold regions such as polar regions have limitations due to low accessibility. Thus, numerous types of laboratory tests have been conducted on the characterization of frozen soils including strength and stiffness(Linelland Lobacz, 1980; Bragg and Andersland , 1981; Weaver and Morgenstern, 1981; Zhu et al.,1988; landanyi and Theriault, 1990). For the characterization of the strength of frozen soils, direct shear tests have been conducted(Fitzsimons et al.,2001; Yasufuku et al., 2003; Christ and Park, 2010). In addition, for the investigation of stiffness, elastic waves have been measured(Wang et al.,2006; Park and Lee, 2014).
In this study, shear strength and stiffness of frozen soils, which underwent confinement in freezing and shearing phases, are investigated. The specimens are prepared by mixing sand and silt, and placed into a shearing cell at 60% relative density and 10% degree of saturation. The confining stresses applied in normal direction of the shear plane are 5, 10, 25 and 50 kPa. After the temperature of the specimens decreases up to −5 °C, the shear strength and shear stiffness are estimated during direct shear tests. Direct shear tests of frozen soils are conducted up to the horizontal displacement of 20 mm. In addition, shear waves are measured during shearing phase to investigate stiffness change. This paper describes the measurement system of the direct shear test, shear wave propagation, measured test results, and analyses.
2 Experimental setup 2.1 SpecimensThe specimens are prepared by mixing sand and silt at the silt fraction of 30% in weight(Wsilt/Wsand × 100%). Note that silt fraction is the weight ratio of silt to sand. The specific gravity(ASTM D854, 2006)of the sand -silt mixture is 2.59. The maximum void ratio(ASTM D4253, 2006) and minimum void ratio(ASTM D4252, 2006)of the specimen are 0.79 and 0.45, respectively. The specimens are saturated at 10% degree of saturation and placed into the shearing cell in five layers. Each layer is compacted by the same number blows to apply uniform energy. The relative density of specimens prepared into the cell is 60%. Furthermore, the temperature is continuously observed by a K-type thermocouple, which is installed in the middle of the specimen during tests including freezing and shearing phases.
2.2 Direct shear testFor the strength characterization of frozen soils, the direct shear device with high capacity, which applies the horizontal stress up to 5 MPa, is adopted. The capacity is enough to reach peak strength of the frozen soils with the cross-sectional of 100cm2 in the laboratory. Note that the dimensions of the cell for the direct shear tests are 100 mm in width, 100 mm in length, and 76 mm in height. The direct shear cell is made of brass, whose thickness in length and width directions are 20 mm, to prevent bending during shearing under high loadings in normaland shearing directions.
After the specimens are prepared, different confining stresses are applied to the specimens during freezing phase in a cold chamber. The confining stresses applied in normal direction are 5, 10, 25 and 50 kPa. Before the direct shear tests are carried out, the time for lowering temperature of the specimen up to −5 °C is taken about 10 hours. For the investigation of the normal stress effect during shearing, the applied normal stresses changed from 5 to 50 kPa. The shearing rate is fixed at 0.33 mm/min. The direct shear tests are conducted up to the horizontal displacement of 20 mm.
2.3 Shear wave measurementsShear waves are measured during freezing and shearing stages for the investigation of stiffness change according to temperature change and shearing. For the generation and detection of shear waves, two pairs of bender elements are installed into the direct shear cell. Bender elements are commonly used sensors in laboratory tests due to good coupling between transducersand soils. One pair is installed into the upper celland the other pair is for bottom cell. Shear waves are continuously measured through the upper pair through upper bender elements, and across the shear plane by using upper and lower bender elements.
The configuration of the measurement system of shear waves is shown in Figure 1. A function generator generates input signals into the source bender, and the generated shear waves are propagated through the specimen and received by the other bender element, which is instrumented across the source. The received signals are filtered and amplified, the filtered signals are displayed on an oscilloscope and the displayed signals are stored into a computer.
 |
| Figure 1 Shear wave measurement system:(a)schematic drawing;(b)photo of devices |
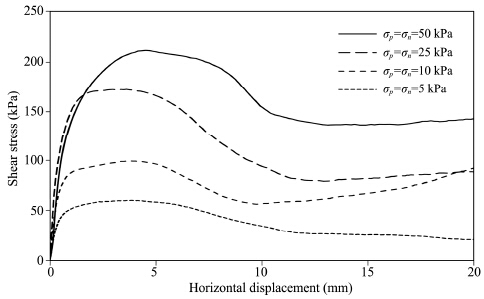
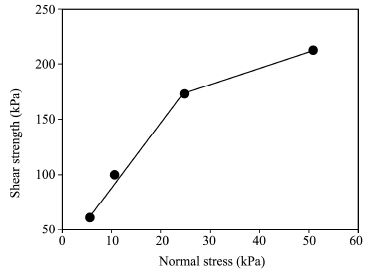
The shear stresses versus horizontal displacement at the normal stresses of 5, 10, 25 and 50 kPa are plotted in Figure 2. The peak and residual strengths increase according to the normal stress. The shearing behavior of the frozen specimens is similar to that of the unfrozen specimens, because the degree of saturation of the frozen specimen is only 10%. The peak strength versus the applied normal stress is plotted in Figure 3. Figure 3 shows that the peak shear strengths are 60.8, 99.6, 172.9 and 212.2 kPa at the normal stresses of 5, 10, 25 and 50 kPa, respectively, during freezing(σp) and shearing(σn)phases. Figure 3 shows that the relationship between strength versus normal stress is bilinear such as continuum(Indraratna and Haque, 1997).
 |
| Figure 2 Direct shear test results according to normal stresses. σp: normal stress during freezing; σn: normal stress during shearing |
 |
| Figure 3 Peak shear strength versus normal stress |
For the estimation of variation of stiffness, shear wave velocity is used to figure out shear modulus, which represents stiffness of the specimens by Equation (1):
| $G = \rho V_s^2$ | (1) |
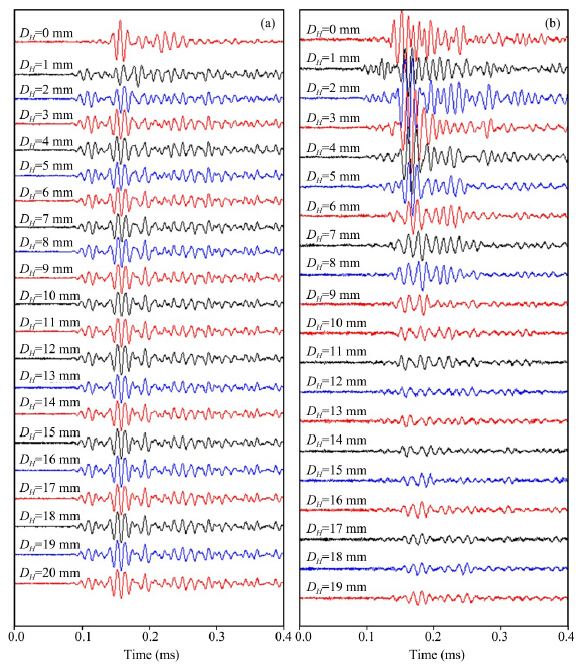
The shear wave signatures along the upper-upper and upper-lower bender elements at the normal stress of 50 kPa are plotted in Figure 4. The number of signals is 21 which are gathered at each 1 mm of the horizontal displacement from 0 mm(before shearing)to 20 mm. Figure 4 shows that first arrival time and amplitude of the shear waves above the shear plane(upper-upper bender elements)are almost constant during shearing phase as shown in Figure 4a. However, shear waves, which reflect bonding breakage on the shear plane(upper-lower bender elements), change according to the horizontal displacement as shown in Figure 4b. Figure 4b shows that the first arrivaland amplitude of shear waves generally decreases as the horizontal displacement increases.
 |
| Figure 4 Shear wave signatures:(a)above shear plane;(b)passing shear plane. DH: horizontal displacement |
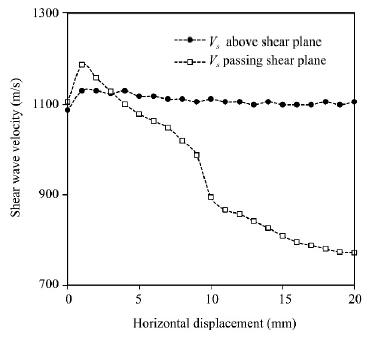
The shear wave velocity is the ratio of the tip-to-tip distance of two bender elements to the first arrival(Lee and Santamarina, 2005). Calculated shear wave velocities are plotted in Figure 5. Figure 5 shows that the shear wave velocity is almost constant during shearing in upper part of the shear plane, and generally decreases at the shear plane. Shear wave velocity across the shear plane significantly drops near the horizontal displacement of 10 mm as shown in Figure 5. Note that the shear stress decreases dramatically near the horizontal displacement of 10 mm as shown in Figure 2. Both the stressand shear wave velocity across the shear plane along the horizontal displacement show the ice bonding breakage.
 |
| Figure 5 Shear wave velocity according to horizontal displacement(σn =50 kPa) |
The goals of this study are to evaluate the strength characteristics of frozen soils, which underwent confinement in freezing and shearing stages, and to estimate the stiffness variation during shear phase by shear wave velocity. Specimens with 60% relative density and 10% degree of saturation are prepared in a brass cell. The normal stresses, which are applied on the soils, are 5, 10, 25 and 50 kPa. The specimens are placed into the freezing chamber to lower the temperature up to −5 °C. The shear waves are gathered through the frozen soils during shearing phase to detect stiffness change. The main observations of this study are as follows:
• The shear strength increases with an increase in the normal stress. The bilinear relationship between shear strength and normal stress is observed.
• The shear wave velocity and amplitude which reflect breakage of ice bonding on the shear plane gradually decreases with an increase in horizontal displacement.
• At the similar horizontal displacement(approximately 10 mm), both shear wave velocity and shear stress of the specimen significantly decrease due to ice bonding breakage during shearing.
Acknowledgments: This research was supported by a grant(13IFIP-B06700801)from Plant Research Program funded by Korea Agency for Infrastructure Technology Advancement.| ASTM D4253-00, 2006.Standard Test Methods for Maximum Index Density and Unit Weight of Soils Using a Vibratory Table.Annual Book of ASTM Standard. |
| ASTM D4254-00, 2006.Standard Test Methods for Minimum Index Density and Unit Weight of Soils Calculation of Relative Density.Annual Book of ASTM Standard. |
| ASTM D854-10, 2006.Standard Test Methods for Specific Gravity of Soil Solids by Water Pycnometer.Annual Book of ASTM Standard. |
| Bragg RA, Andersland OB, 1981. Strain rate temperature and simple size effects on compressions and tensile properties of frozen sand. Engineering Geology, 18(1-4): 35-46. DOI: 10.1016/0013-7952(81)90044-2. |
| Christ M, Park JB, 2010.Laboratory determination of strength properties of frozen rubber-sand mixtures. Cold Regions Science and Technology, 60: 169-175.DOI: 10.1016/j.coldregions.2009.08.013. |
| Fitzsimons SJ, McManus LJ, Sirota P, et al., 2001. Direct shear tests of materials from a cold glacier: implications for landform development. Quaternary International, 86(1): 129-137. DOI: 10.1016/S1040-6182(01)00055-6. |
| Indraratna B, Haque A, 1997. Experimental study of shear behavior of rock joints under constant normal stiffness conditions. International Journal of Rock Mechanics and Mining Sciences, 32(3-4): 141.e1-141.e14. DOI: 10.1016/S1365-1609(97)00068-3. |
| Landanyi B,Theriault A, 1990.A study of some factors affecting the adfreezebond of piles in permafrost.Canadian Geotechnical Engineering Congress GSP 27 ASCE, 1: 213-224. |
| Lee JS,Santamarina JC, 2005. Bender elements: performance and signal interpretation. Journal of Geotechnical and Geoenvironmental Engineering, ASCE, 131(9): 1063-1070.DOI: 10.1061/(ASCE)1090-0241(2005)131:9(1063). |
| Linell KA, Lobacz EF, 1980. Design and construction of foundations in areas of deep seasonal frost and permafrost. Special Report of Cold Regions Research Engineering Laboratory, U.S. Army, pp.80-134. |
| Park JH, Lee JS, 2014.Characteristics of elastic waves in sand-silt mixtures due to freezing. Cold Regions Science and Technology, 99: 1-11.DOI: 10.1016/j.coldregion.2013.11.002. |
| Shunsuke T, 1980. The adsorption force theory of frost heaving. Cold Regions Science and Technology, 3(1): 57-81.DOI: 10.1016/0165-232X(80)90007-5. |
| Wang DY, Zhu YL, Ma W, et al., 2006. Application of ultrasonic technology for physical-mechanical properties of frozen soil. Cold Regions Science and Technology, 44(1): 12-19. DOI: 10.1016/j.coldregions.2005.06.003. |
| Weaver JS, Morgenstern NR, 1981. Pile design in permafrost. Canadian Geotechnical Journal, 18(2): 357-370. DOI: 10.1139/t81-043. |
| Yasufuku N, Springman SM, Arenson LU, et al., 2003, Stress-dilatancybehavior of frozen sand in direct shear.Proceedingof the Eighth International Conference on Permafrost, Switzerland, pp. 1253-1258. |
| Zhu Y, Zhang J, Shen Z, 1988.Uniaxial compressive strength of frozen medium sand under constant deformation rates.5th International Symposium on Ground Freezing, Rotterdam, pp. 225-232. |
 2015, 7


