Article Information
- DongQing Li, Xing Huang, Feng Ming, Yu Zhang, Hui Bing. 2015.
- Experimental research on acoustic wave velocity of frozen soils during the uniaxial loading process
- Sciences in Cold and Arid Regions, 7(4): 323-328
- http://dx.doi.org/10.3724/SP.J.1226.2015.00323
Article History
- Received: February 26, 2015
- Accepted: May 16, 2015
2. University of Chinese Academy of Sciences, Beijing 100049, China;
3. College of Architecture and Urban-Rural Planning, Sichuan Agricultural University, Du Jiangyan, Sichuan 611830, China
1 Introduction
As the artificial freezing method is widely applied in tunnel boring and other underground engineering under complicated geological conditions, the related researches have increased in recent years. During construction, once a frozen wall is unstable or broken it will bring great hidden danger for tunneling and will have a terrible consequence if the defects cannot be discovered and h and led in time. Rapid detection of this condition in the field has become one of the most important key technologies, because the deformation and failure of frozen walls is difficult to detect. The acoustic characteristics of frozen soils are closely related to their temperature, water content, density, cracks, and stress states. Yang and Li(1997)researched the change rule of acoustic parameters of frozen soils during loading to explore the acoustic characteristics of frozen walls in the deformation or broken state. The variations in characteristics of acoustic waves can be used to detect the deformation of frozen wallsand forecast their stability over time, to ensure the security of underground engineering under complicated geological conditions.
Since the 1970s, many experts have used ultrasonic inspection in the study of frozen soils, and much research has been done in this field. The research work mainly focuses on two aspects, theoretical derivation and experimental study. Regarding the first aspect, Leclaire et al.(1995)derived the wave equation of a three-phase medium which was composed of solid particles, ice, and water. They predicted that there exist three kinds of longitudinal wavesand two kinds of shear waves, and obtained two high-velocity longitudinal wavesand shear waves. Zhou and Lai(2011)derived the analytical expression of elastic wave propagation velocity and attenuation in saturated frozen soil, and analyzed the relationship between wave velocity and ice content, porosity, and density. In experimental studies, Timur(1968)used the pulse-first-arrival technique to measure the longitudinal wave velocity of rocks under different temperatures. Nakano et al.(1972)used the ultrasonic detection technique to study the characteristics of artificial frozen soil. Their research results showed that the ultrasonic wave velocity of frozen sand changed little with temperature, while the velocity of frozen silt decreased with an increase of temperature. Yang et al.(1997)used an SYC-2 nonmetal ultrasonic test meter to study the relationship between tensile and compressive strengthsand longitudinal and shear wave velocities of artificial frozen clay and frozen sand . Sheng et al.(2000) and Wang et al.(2003)analyzed the impact of unfrozen water content on ultrasonic wave velocity based on their experiments.
Previous research introduced the acoustic wave propagation properties of frozen soilsand the relationship between acoustic parametersand the physical properties of frozen soils, but there has been relatively little research on the damage evolution of frozen soil by using ultrasonic testing. Ultrasonic testing is a useful technology to detect cracksand defects in rock or concrete, so it can also be used to detect the damage of frozen soil. Uniaxial compression strength is an important mechanical testing index in the design and implementation of artificial freezing methods. Therefore, this paper explores the obtained acoustic travel time and waveforms of P-waves of frozen silt and frozen sand during the uniaxial loading process, to establish an experimental relation model between stressand P-wave velocity, and to research the variation characteristics of velocity. The change of acoustic wave propagation characteristics during the uniaxial loading process has an important influence on the evaluation of engineering stability. This research lays the foundation for the future application of ultrasonic testing of frozen soils.
2 Basic physical properties of test specimens 2.1 Tested soilsIn this test we chose two typical soils to analyze, silt and sand . The soils had been dried, crushed, and sifted. The liquid limit of the silt was 24%, the plastic limit was 15.6%, and its plastic index was 8.4. The optimum water content and maximum dry density were obtained from light compaction tests, in which the compaction work per unit volume was 592.2 kJ/m3, the core diameter of the compaction cylinder was 102 mm, the height was 116 mm, and its volume was 947.4 cm3. The test produced the compaction curves of silt and sand ; a compaction curve is the relationship between dry density and water content. The vertical coordinate corresponding to the peak point is the maximum dry density of the specimen, and the corresponding horizontal coordinate is the optimum water content. In this test the optimum water content of the silt was 16% and its maximum dry density was 1.76 g/cm3, and the optimum water content of the sand was 12% and its maximum dry density was 1.82 g/cm3. An automated laser particle tester was used to test the soils, and their grain size distribution curves are shown in Figure 1.
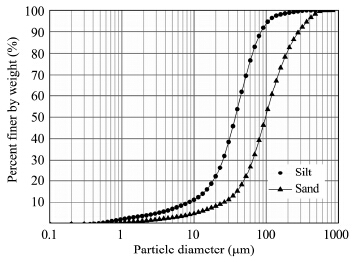 |
| Figure 1 Grain size distribution of the tested soils |
In order to be compared to practical engineering, the specimens had to have the optimum water content and the maximum dry density. Distilled water was added as necessary to the soil samples, which were placed inside sealed containers for up to 12 hours to distribute the water content evenly in the soils. Then each test specimen was created based on the engineering st and ard GB50324-2001(2001), with a diameter of 61.8 mm and a length of 125 mm. At least three other qualified specimens were established as parallel control samples.
Each specimen was placed into a steel mold to protect it from deformation and loss of water. Then it was put into an incubator with a temperature below −30 °C. After 24 hours the specimen was removed from the incubator and was unmolded, and its height, diameter, and weight were measured. The purpose of this step was to make the specimen freeze rapidly and decrease its water migration; if this step is omitted before testing the wave velocity during the uniaxial loading process under certain negative temperatures, there will be a great deal of water migration and the water distribution in the specimen will become uneven. The basic physical properties of the specimens are shown in Table 1.
| Soil type | Number | w(%) | ρd(g/cm3) | L(mm) | T(°C) |
| Silt | HT-1 | 15.95 | 1.77 | 125.0 | −15 |
| HT-2 | 15.95 | 1.77 | 124.8 | −10 | |
| HT-3 | 15.95 | 1.76 | 125.1 | −5 | |
| HT-4 | 15.95 | 1.77 | 124.8 | −1 | |
| sand | ST-1 | 11.86 | 1.85 | 124.6 | −15 |
| ST-2 | 11.86 | 1.84 | 124.8 | −10 | |
| ST-3 | 11.86 | 1.83 | 125.0 | −5 | |
| ST-4 | 11.86 | 1.82 | 124.7 | −1 | |
| Note: w is the water content, ρd is the dry density, L is the initial length of the specimen, and T is the temperature. | |||||
A universal material testing machine was used as the uniaxial loading device. For acoustic testing, an RSM®-SY5(T)nonmetal ultrasonic test meter developed and produced by the Wuhan Geotechnical Engineering Institute was used. The test system was composed of an ultrasonic test meter, wire, and transmitting and receiving transducers that could bear pressure. The frequency of the P-wave transducer was 50 kHz. In order to make the test results more comparable, the test instrument had to always have the same parameters(transmission pulse-width, gain). Also, a temperature control box was adopted in the experiment; the temperature control ranged from −40 °C to 40 °C and its precision reached 0.02 °C.
3.2 Testing methodThe system to test the wave velocity of frozen soils under the condition of uniaxial loading is shown in Figure 2. The test temperatures were −1, −5, −10, and −15 °C, and the system was set at the test temperature for at least 24 hours. The uniaxial compression test loading rate was 1 mm/s. This test system could collect the P-wave velocity, stress, and strain synchronously during the loading. The values of stressand strain during the loading, the displacement, and the loading time were obtained by the data acquisition instrument of the uniaxial loading device.
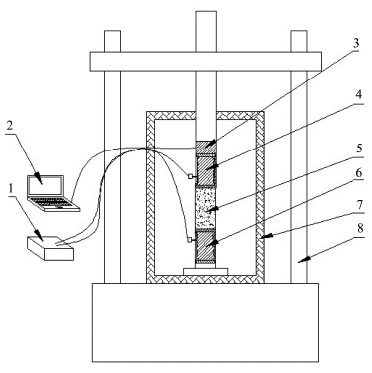 |
| Figure 2 Schematic of the test system. 1: ultrasonic test meter; 2: data acquisition instrument; 3: pressure and displacement sensor; 4: pressure-bearing transmitting transducer; 5: specimen; 6: pressure-bearing receiving transducer; 7: temperature control box; 8: uniaxial loading device |
The acoustic travel time through the specimen was obtained by the ultrasonic test meter. The P-wave velocity of the specimen at different times could be obtained from following formula:
| ${V_P} = {{{\left( {L - \Delta L} \right)} / {\left( {t - {t_0}} \right)}}}$ | (1) |
The travel time of the wave, t, refers to the first wave which was automatically determined by the ultrasonic test meter. If it was necessary to stop the sampling processand make the waveform fixed on the screen, the cursor of the mouse could be moved to the position of first wave jumping-off point, and the travel time of this point was the first travel time of the wave.
4 Analysis of experiment results 4.1 Study of P-wave velocity under uniaxial loadingThe relationship among the P-wave velocity, stress, and strain of the complete process of uniaxial loading of frozen silt and frozen sand specimens were obtained from our experiments, as shown in Figures 3 and 4. The stress-strain curves of these two soil samples both have a pronounced peak value under the condition of uniaxial loading. These two soil samples have the property of strain softening and their behavior has the characteristics of brittle failure(Guo and Sun, 2012). At the initial loading, the stress increased with an increase of strain, while the stress decreased with the increase of strain after reaching the ultimate strength.
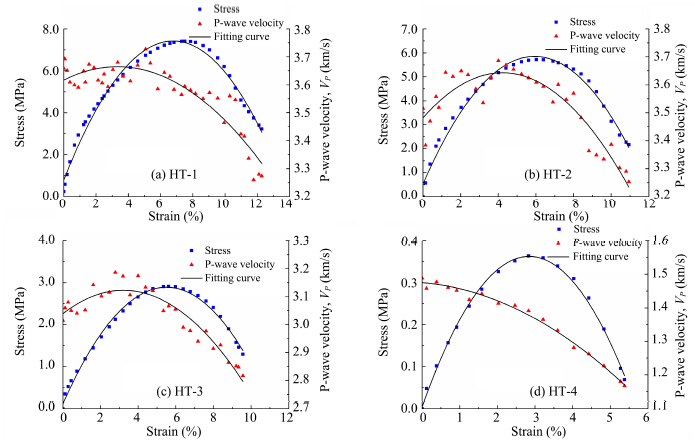 |
| Figure 3 P-wave velocity-stress-strain curves of frozen silt |
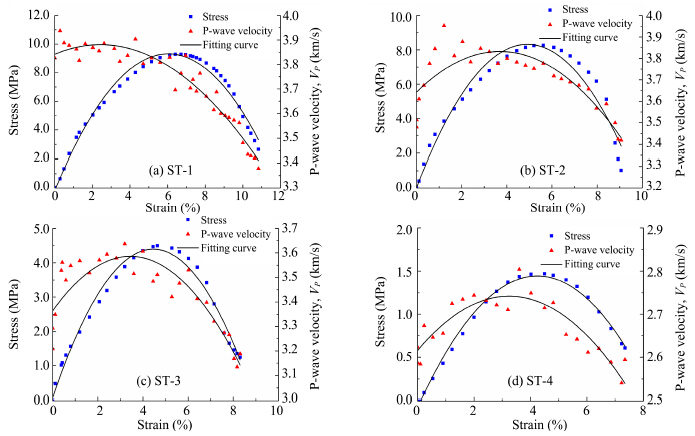 |
| Figure 4 P-wave velocity-stress-strain curves of frozen sand |
As can be seen from Figures 3 and 4, the P-wave velocity of the frozen silt was less than that of frozen sand at the same temperature. The velocity of these two soil samples(except HT-4)first increased with the increase of strain, and then decreased with the increase of strain after reaching the maximum velocity. The velocity was influenced by soil type and also by the temperature and pressure.
The P-wave velocity decreased with an increase of temperature because in rising temperatures the unfrozen water content in frozen soil will increase and the relative ice content will become reduced. The wave velocity of water is lower than that of ice. The cohesive force of particles becomes weak, which leads to the reduced elasticity of frozen soil(Huang et al.,2013).
The P-wave velocity increased with the increasing load during the initial loading process, mainly because of primary interior defects such as holesand fissures in the artificially frozen soil samples. At the initiation of loading, the specimen had been compressed, the volume of frozen soil was decreased, and its density increased to a particular point and its porosity decreased correspondingly. Thus, the acoustic wave attenuation became small and the wave velocity increased. The wave velocity increased slowly when the pressure consolidation process was over.
Table 2 presents the results of the experiments, permitting analysisand conclusions. The P-wave velocity of the frozen silt reached its maximum at 75.71%-94.62% of ultimate strength, and the change rate of the wave velocity was 1.10%-4.60%(the change rate of the wave velocity is the ratio of the difference between the maximum velocity and the value of the initial wave velocity to initial wave velocity). The P-wave velocity of the frozen sand reached its maximum at 40.0%-77.36% of ultimate strength, and the change rate of the wave velocity was 1.57%-11.83%. After the wave velocity reached its maximum, a crack began to form and it developed as the load increased. In the crack growth stage, the path length of the wave become long and the travel time increased due to the wave diffraction in the soil samples. At this stage, the wave velocity decreased with the increase of load. When the stress reached the ultimate strength, the wave velocity decreased significantly. Thus, the P-wave velocity can reflect the development of cracks in frozen soilsand their mechanical properties. Furthermore, the relationship among P-wave velocity, peak stress, and peak strain followed same laws according to the types of soils.
| Soil type | No. | Initial wave velocity(km/s) | Maximum of wave velocity(km/s) | Stress ratio of peak wave velocity(%) | Change rate of wave velocity(%) | Uniaxial compressive strength(MPa) |
| Silt | HT-1 | 3.62 | 3.66 | 75.71 | 1.10 | 7.41 |
| HT-2 | 3.48 | 3.64 | 92.10 | 4.60 | 5.72 | |
| HT-3 | 3.04 | 3.12 | 79.99 | 2.63 | 2.91 | |
| HT-4 | 1.48 | 1.48 | 0.00 | 0.00 | 0.36 | |
| sand | ST-1 | 3.82 | 3.88 | 40.00 | 1.57 | 9.32 |
| ST-2 | 3.64 | 3.83 | 74.01 | 5.22 | 8.32 | |
| ST-3 | 3.21 | 3.59 | 77.36 | 11.83 | 4.40 | |
| ST-4 | 2.62 | 2.74 | 77.19 | 4.58 | 1.44 | |
| Note: The travel time and the wave velocity were extracted and computed by the artificial, so the wave velocities are dispersed datum. The wave velocity values here were obtained from the fitting curves. The stress ratio of peak wave velocity is the ratio of stress corresponding to peak wave velocity to compressive strength. | ||||||
The wave velocity of the frozen silt and frozen sand decreased with the increase of temperature, so the initial wave velocity was obtained at the beginning stage of loading. The initial wave velocity is the comprehensive reflection of the change of density, structure, and unfrozen water content of the frozen soil, so the initial wave velocity and uniaxial compressive strength are inherent attributes of frozen soils. Figure 4 shows that there is an exponential relationship between P-wave velocity and uniaxial compressive strength:
| ${\sigma _c} = a{{\rm{e}}^{b{V_P}}}$ | (2) |
Figure 5 shows the curves of the relationship between P-wave velocity and uniaxial compressive strength of the frozen silt and sand .
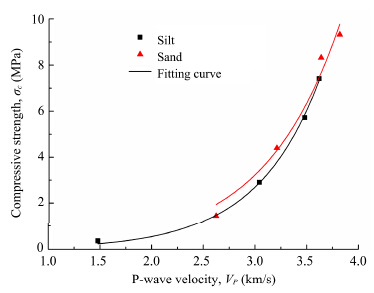 |
| Figure 5 Relationship between P-wave velocity and uniaxial compressive strength of frozen soils |
The uniaxial compressive strength is one of the most important mechanical parameters of frozen soils, and this parameter is usually obtained from destructive tests. In contrast, ultrasound technology is nondestructive.
5 ConclusionsUnder our experimental conditions of uniaxial loading, the velocity of ultrasonic wave travel through soil specimens changed. We can combine all of the resulting information to analyze the damage situation of frozen soils during the loading process. This information can be used to comprehensively evaluate the damage of frozen soil and provide references for the evaluation of engineering stability.
1)The P-wave velocity was affected by soil materialsand external loads. The P-wave velocity of frozen silt was smaller than that of frozen sand , but all increased at first and then decreased with the increase of strain.
2)The P-wave velocity decreased with a rise of temperature.
3)There was a good exponential relationship between P-wave velocity and uniaxial compressive strength, and the correlation coefficient was high.
4)The characteristics of acoustic wave velocitycan, to some extent, reflect the development of internal cracks in frozen soils during loading.
Acknowledgments:
This work is supported by the National Natural Science Foundation of China(No. 41271080), the National Basic Research Program("973")of China(No. 2012CB026102), and the Western Project Program of the Chinese Academy of Sciences(No. KZCX2-XB3-19).
| GB 50324-2001, 2001. Code for Engineering Geological Investigation of Frozen Ground. Beijing: China Planning Press. |
| Guo QL, Sun YZ, 2012. Thermal physical performance and compressive strength characteristics of short-term frozen soil in southern area of China. Yangtze River, 43(9): 51-54. |
| Huang X, Li DQ, Ming F, et al., 2013. An experimental study on the relationship between acoustic parameters and mechanical properties of frozen silty clay. Sciences in Cold and Arid Regions, 5(5): 596-602. DOI: 10.3724/SP.J.1226.2013.00596. |
| Leclaire P, Cohen-tenoudji F, Aguirre PJ, 1995. Observation of two longitudinal and two transverse waves in a frozen porous medium. Acoustical Society of America, 97(4): 2052-2055. |
| Nakano Y, Martin AJ, Smith M, 1972. Ultrasonic velocities of the dilatational and shear waves in frozen soils. Water Resources Research, 8(4): 1024-1030. |
| Sheng Y, Fukuda M, Kim H, et al., 2000. Effect of unfrozen water content on the ultrasonic velocities in tire-mixed frozen soils. Chinese Journal of Geotechnical Engineering, 22(6): 716-719. |
| Timur A, 1968. Velocity of compressional waves in porous media at permafrost temperature. Geophysics, 33: 584-595. |
| Wang DY, Zhu YL, Ma W, et al., 2003. Testing study on relationship between ultrasonic wave velocities and physico-mechanical property of frozen soils. Chinese Journal of Rock Mechanics and Engineering, 22(11): 1837-1840. |
| Yang P, Li Q, 1997. Experimental study on mechanical property and the relativity of acoustic parameter of frozen soil. Chinese Journal of Geotechnical Engineering, 19(4): 78-82. |
| Yang P, Li Q, Yu CH, 1997. An experimental study on the acoustic wave parameters of artificial frozen soil. Journal of Glaciology and Geocryology, 19(2): 149-153. |
| Zhou FX, Lai YM, 2011. Propagation characteristics of elastic wave in saturated frozen soil. Rock and Soil Mechanics, 32(9): 2669-2674. |
 2015, 7


