Article Information
- HaoLin Yu, XinLei Na, ZhaoHui Joey Yang. 2015.
- Characterization of frozen soil-cement mixture for berm construction in cold regions
- Sciences in Cold and Arid Regions, 7(4): 300-306
- http://dx.doi.org/10.3724/SP.J.1226.2015.00300
Article History
- Received: March 21, 2015
- Accepted: May 29, 2015
2. University of Alaska Anchorage, Anchorage, Alaska, USA
1 Introduction
Wastewater lagoons are a low cost solution for wastewater treatment in rural villages throughout Alaska. The lagoons in many villages of Alaska have to be constructed on permafrost sites with permafrost materials due to limited resources and lack of more suitable construction materials. Many of these sites consist of warm and ice-rich permafrost. As the permafrost begins to melt and excess water from melted ice lens dissipates(i.e., consolidation), the lagoon embankments settle and fail, along with many other foundations used for homes and schools in these native villages.
The berm itself is often built with pulverized permafrost due to lack of thawed materials and a tight construction schedule(Tart, 1983). Ice-poor permafrost would be a better choice than ice-rich permafrost for this purpose. However, excavation at a deep depth or borrowing from a faraway site is often necessary to access ice-poor permafrost, resulting in very high construction cost. These berms and geotextile liners compose the barrier between wastewater and the surrounding l and . Improper treatment of ice-rich permafrost used for construction, and climate change in rural Alaska have led to stability issues for these wastewater treatment lagoon berms, which often shortens the lifespan of these lagoons. These result in early replacement due to environmental concerns, making these projects very expensive. Figure 1 shows such a construction site in Eek, Alaska, where a new wastewater treatment lagoon(right)is being constructed around an existing old lagoon. It is worth noting that the old lagoon berms with an original height of five feet have settled and have only one and a half feet left on the ground.
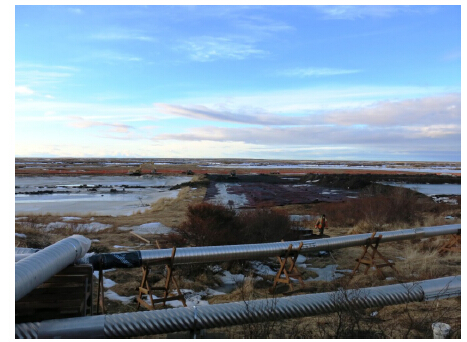 |
| Figure 1 Construction of Sewage Lagoon in Eek, Alaska(Courtesy of Simon A. Evans, Alaska Native Tribal Health Consortium) |
A possible solution for this problem is to mix stabilizing additives such as Portl and cement and other additives with frozen soils during berm construction. On one h and , the stabilizing additives can help absorb the excess water generated during thawing of ice-rich permafrost(Jo et al.,2007; Ren and Hu, 2014); on the other h and , it will help strengthen the soil by cementation(Kumar et al.,2006; Tang et al.,2007). This paper presents a summary of this study including sample preparation, experimental design, testing apparatus and procedures, results and analyses. In the end, a few preliminary conclusions are presented.
2 Sample preparationAll samples used in this study were taken from a site in Anchorage, Alaska. Water content and grain-size distribution of the samples were measured based on the ASTM St and ards D-2216 and D-6913, respectively. The initial water content was 12%, and one example particle-size distribution is presented in Figure 2. The soil can be classified as SM according to Unified Soil Classification System, which is similar to that found in the construction site.
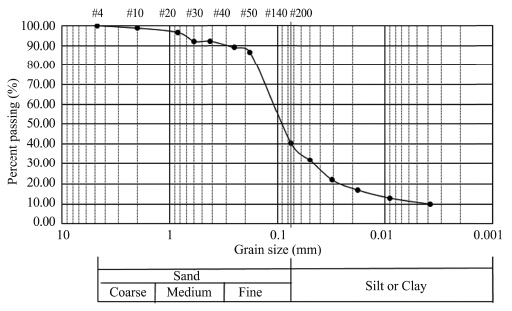 |
| Figure 2 Sieve analysis result of original soil sample(SM) |
According to the geotechnical report on the frozen soil of the construction site, the ice content of the frozen silt is around 30%. After drying the samples in an oven for 24 hours, water was added to the soil to bring the water content to the same as that found on the construction site, and the samples were thoroughly mixed and sealed in containers, and then left in a cold room at −20 °C for 24 hours before testing.
3 Experimental designIn order to find an effective and practical soil mixing method, c and idate additives chosen for soil mixing test include Nano-silica, Portl and cement(Type I) and polypropylene fiber(or PPF). A series of mixing ratios were designed according to the orthogonal experiment principle for the three factors at three levels to find an optimized mixing ratio, as presented in Table 1.
| Specimen No. | NS | C | PPF | Level |
| 0 1 2 3 4 5 6 7 8 9 | NS1=0.0% NS1=0.2% NS1=0.2% NS1=0.2% NS2=0.6% NS2=0.6% NS2=0.6% NS3=1.2% NS3=1.2% NS3=1.2% | C1=0.0% C1=3.0% C2=6.0% C3=10.0% C1=3.0% C2=6.0% C3=10.0% C1=3.0% C2=6.0% C3=10.0% | PPF1=0.0% PPF1=0.5% PPF2=1.0% PPF3=1.5% PPF2=1.0% PPF3=1.5% PPF1=0.5% PPF3=1.5% PPF1=0.5% PPF2=1.0% | 0 1 2 3 3 1 2 2 3 1 |
| NS: Nano-Silica; C: Cement; PPF: Polypropylene fiber. | ||||
The experiment apparatus used in this research mainly included thaw settlement and direct shear testing devices. According to ASTM st and ard D5918(2013), the thaw settlement testing device was developed, which is composed of a compaction cylinder, base plate, surcharge weight, a Campbell Scientific CR-3000 data logger, K-type thermo-couples, LVDT displacement sensors LD320-2.5, glass fiber insulation, and an insulation container. Figure 3 presents a schematic of the thaw settlement test assembly. The direct shear test apparatus was ELE Digital Direct/Residual Shear Apparatus26-2114/01 and ASTM st and ard D3080(2011)was followed for all direct shear tests.
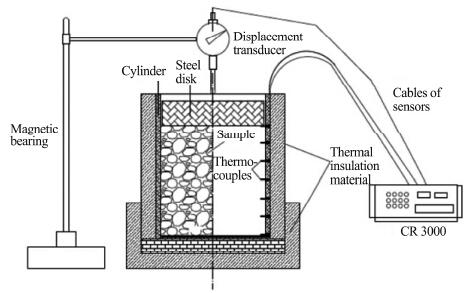 |
| Figure 3 Thaw settlement test assembly |
Each test utilizes the following procedure:
1)Pulverize the frozen samples into small pieces passing the sieve with 12.5 mm opening.
2)Mix a certain quantity of pulverized frozen silt and additives with a mixing ratio from Table 1 in a cold room.
3)Compact the soil-additive mixture in an acrylic compaction cylinder with 150 mm in height and 146 mm inner diameter, by the Proctor compaction test until reaching a target dry density of about 1.4 g/cm3.
4)Apply a surcharge weight with a steel mass of 5.5 kg on top of the sample, setting the displacement sensor on the surcharge weight and connecting all the sensors with the data acquisition system; wrapping the cylinder with fiber insulation.
5)Conduct a thaw settlement test at room temperature for 24 hours.
6)Collect 27 specimens from the thawed soil for direct shear test and water content test; sealing the remaining samples and storing them at room temperature for seven days for a repeat direct shear test.
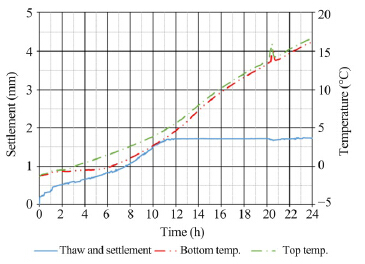
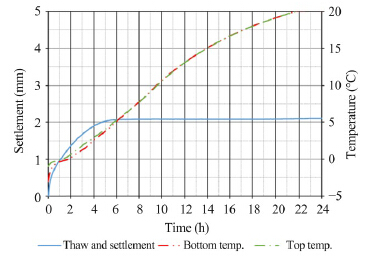
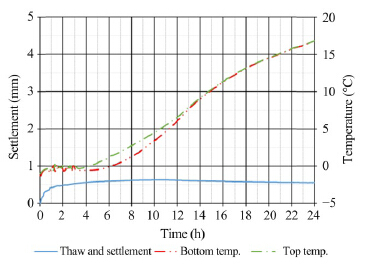
5 Testing resultsThe collected testing data were processed and selected results are presented. Figures 4-7 present the thaw settlement and soil temperature vs. time for the untreated soil and soils treated with mix ratio #1, #6 and #7, respectively. Table 2 summarizes the thaw settlement for the untreated soil specimen and specimens treated with mix ratio #1-#9 as presented in Table 1.
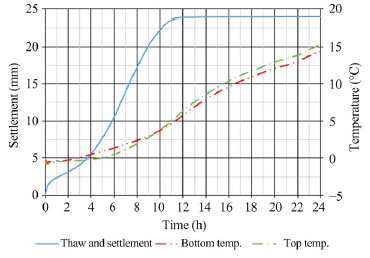 |
| Figure 4 Thaw settlement and temperature for the original soil |
 |
| Figure 5 Thaw settlement and temperature for mix ratio No.1 |
 |
| Figure 6 Thaw settlement and temperature for mix ratio No. 6 |
 |
| Figure 7 Thaw settlement and temperature for mix ratio No. 7 |
| Test No. | 0 | 1 | 2 | 3 | 4 | 5 | 6 | 7 | 8 | 9 |
| Settlement amount(mm) | 24.0 | 1.7 | 2.7 | 2.1 | 4.0 | 1.4 | 2.1 | 0.5 | 1.3 | 0.9 |
It can be seen from the figures and Table 2 that most of the settlement occurred in the first 10 hours from the beginning of thaw settlement test, and between −1 °C and 2 °C of the samples temperature. The settlement amount of pulverized frozen silt sample was 24.0 mm, which is much larger than the thaw settlement range of 0.5 mm to 4.1 mm of those with stabilizing additives. The largest reduction in thaw settlement reached 97.9%, and the least is 83.3%. The average reduction rate is 92.3%. The addition of the three additives effectively reduces the thaw settlement of the frozen soil(SM). In general, within the ranges of the amounts studied in this paper, the more additives were added, the less the thaw settlement was.
The direct strength vs. normal stress for the original soil specimen and specimens with mix ratio #1, #6 and #7 are presented in Figures 8-11, respectively. Tables 3 and 4 present the shear strength values corresponding to each normal stress level for specimens with various mix ratios. Compared to the shear strength of the original soil sample, the shear strengths of the stabilizing additive-treated soil samples demonstrate great enhancement after seven days. The enhancement after 24 hours was visible but not as great as those after seven days. This proves that strength enhancement was primarily due to the hydration of cement and the cementation formed between soil particles by cement. At the same normal stress, the shear strengths of specimen with mix ratio #3, #4, #5 and #6 were higher than the other specimens. These results indicate that the three additives are effective in enhancing the shear strength of the thawed ice-rich soil.
| Test No. | 0 | 1 | 2 | 3 | 4 | 5 | 6 | 7 | 8 | 9 |
| Normal stress(kPa) | Shear stress(kPa) | |||||||||
| 32.1 | 11.5 | 14.1 | 16.6 | 27.7 | 26.7 | 33.0 | 30.5 | 11.5 | 12.8 | 14.1 |
| 64.2 | 20.4 | 19.1 | 24.2 | 51.9 | 27.9 | 41.8 | 25.4 | 20.4 | 17.8 | 19.1 |
| 96.3 | 26.7 | 35.5 | 39.3 | 73.4 | 30.5 | 51.9 | 48.1 | 30.5 | 28 | 31.7 |
| Test No. | 0 | 1 | 2 | 3 | 4 | 5 | 6 | 7 | 8 | 9 |
| Normal stress(kPa) | Shear stress(kPa) | |||||||||
| 32.1 | 12.4 | 21.6 | 20.4 | 31.7 | 36.8 | 38.0 | 54.5 | 30.5 | 39.3 | 31.7 |
| 64.2 | 21.5 | 24.2 | 39.3 | 60.8 | 50.7 | 48.4 | 57.0 | 38.5 | 44.4 | 45.6 |
| 96.3 | 27.8 | 35.5 | 43.1 | 81.0 | 69.6 | 75.9 | 78.4 | 39.3 | 48.1 | 50.7 |
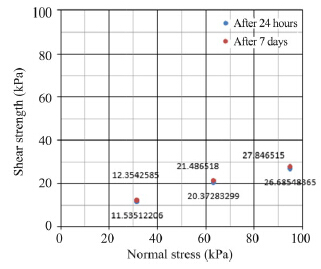 |
| Figure 8 Shear strength for the original soil |
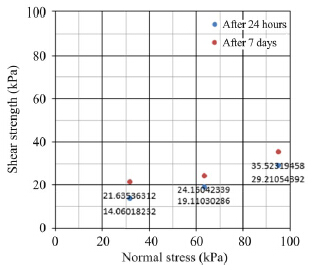 |
| Figure 9 Shear strength for mix ratio No. 1 |
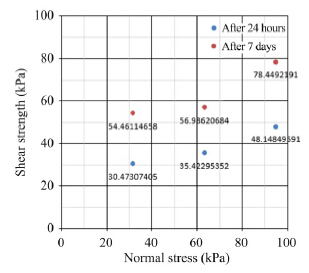 |
| Figure 10 Shear strength for mix soil No. 6 |
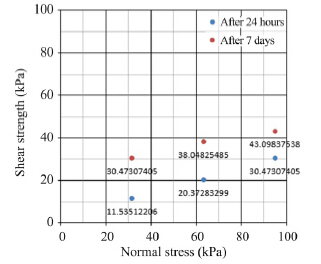 |
| Figure 11 Shear strength for mix soil No. 7 |
Table 5 presents the orthogonal analysis of the thaw settlement test data. From Table 5, one can see that nano-silica has the most significant impact on thaw settlement of the treated soil, PPF comes in second, and cement has the least influence. The fundamental mechanism of thaw settlement is volume decrease when ice melts and consolidation due to pore pressure dissipation after thawing. In the 24-hour thaw settlement test, of all three additives, nano-silica has the strongest water absorbing capacity; therefore it is not surprising that nano-silica was the most effective in reducing the amount of thaw settlement.
| Testing factor | Nano-silica(mm) | Cement(mm) | PPF(mm) | Displacement |
| I | 6.5 | 6.2 | 5.1 | Nano-silica > PPF > Cement |
| II | 7.5 | 5.4 | 7.6 | |
| III | 2.7 | 5.1 | 4.0 | |
| D | 1.6 | 0.4 | 1.2 | |
| Note: I, II and III are respectively the sums of testing results with a certain testing factor at the first, second and third level. D is the range of all the sums with a certain factor at all levels. | ||||
Table 6 presents the orthogonal analysis of direct shear test results 24 hours after soil mixing. In Table 6, the most significant factor to shear strength of treated soil 24 hours after soil mixing is different at different levels of normal stress. When the normal stress is 32.1 kPa, the most important factor is nano-silica; when the normal stress is 64.2 kPa, the most important factor is cement; when the normal stress is 96.3 kPa, the most important factor is PPF. The reason may be that greater normal stress contributes to a larger friction between silt, cement and PPF.
| Testing factor | Nano-silica | Cement | PPF | Shear strength at different normal stress | |||
| 32.1 kPa | 64.2 kPa | 96.3 kPa | |||||
| I | 32.1 kPa | 58.0 | 52.9 | 58.0 | Nano-silica > PPF > Cement | Cement> PPF >Nano-silica | PPF > Cement >Nano-silica |
| 64.2 kPa | 95.2 | 67.4 | 60.3 | ||||
| 96.3 kPa | 141.9 | 90.2 | 105.2 | ||||
| II | 32.1 kPa | 90.2 | 62.4 | 57.4 | |||
| 64.2 kPa | 95.1 | 83.8 | 71.2 | ||||
| 96.3 kPa | 130.5 | 119.1 | 101.5 | ||||
| III | 32.1 kPa | 38.4 | 69.3 | 71.3 | |||
| 64.2 kPa | 57.4 | 96.5 | 114.1 | ||||
| 96.3 kPa | 90.1 | 153.1 | 155.9 | ||||
| D | 32.1 kPa | 28.0 | 12.4 | 15.7 | |||
| 64.2 kPa | 13.4 | 18.9 | 14.7 | ||||
| 96.3 kPa | 17.2 | 27.9 | 28.2 | ||||
For the direct shear test results seven days after soil mixing, it is apparent that the least contribution to shear strength is PPF, and when the normal stress is low, i.e., 32.1 kPa and 64.2 kPa, the most significant factor is nano-silica; when the normal stress is high, the most significant is cement(Table 7). The enhancement of shear strength of treated soil after curing for seven days is mainly due to cement hydration and nano-silica also plays a positive role in this regard. PPF has nearly no effect on enhancing inter-particle cementation.
| Testing factor | Nano-silica | Cement | PPF | Shear strength at different normal stress | |||
| 32.1 kPa | 64.2 kPa | 96.3 kPa | |||||
| I | 32.1 kPa | 73.7 | 88.9 | 116.5 | Nano-silica > Cement > PPF | Nano-silica > Cement > PPF | Cement > Nano-silica > PPF |
| 64.2 kPa | 124.3 | 113.9 | 88.9 | ||||
| 96.3 kPa | 159.6 | 144.4 | 100.2 | ||||
| II | 32.1 kPa | 129.4 | 97.7 | 125.6 | |||
| 64.2 kPa | 157.1 | 133.1 | 132.6 | ||||
| 96.3 kPa | 223.9 | 167.2 | 148.2 | ||||
| III | 32.1 kPa | 101.5 | 117.9 | 162.1 | |||
| 64.2 kPa | 128.0 | 163.4 | 163.4 | ||||
| 96.3 kPa | 138.1 | 210.1 | 193.2 | ||||
| D | 32.1 kPa | 28.6 | 18.5 | 9.2 | |||
| 64.2 kPa | 31.5 | 23.2 | 7.5 | ||||
| 96.3 kPa | 12.2 | 30.7 | 10.4 | ||||
This study shows that the addition of nano-silica, cement and PPF greatly reduces thaw settlement and increases shear strength, particularly long term strength, of ice-rich silt. The mixing ratio designed in this paper is effective and can be considered for field experiments. Nano-silica is the most significant factor to thaw settlement reduction. The influence level of the three additives on the shear stress of the mixing soil after 24 hours is different with the normal stress levels. However, for the shear strength after seven days, nano-silica is the most important factor at low normal stress, while cement plays a key role in enhancing the strength at higher normal stress.
The study results in this paper prove the feasibility and effectiveness of using frozen soil as the main construction material for lagoon berm construction in cold regions. Further research is warranted for optimizing the mix ratio and studying other physical properties of the treated soil such as hydraulic conductivity as well as how these properties change with freeze-thaw cycles. It is worthy of noting that nano-silica is quite expensive so it is important to find cheaper alternatives.
Acknowledgments: The authors want to thank Messrs. Simon A. Evans and Gregory McConnell, Civil Engineers of Alaska Native Tribal Health Consortium, for providing soil data and construction site pictures from Eek, Alaska.
| ASTM D3080-2011, 2011.Standard Test Method for Direct Shear Test of Soils Under Consolidated Drained Conditions. |
| ASTM D5918-2013, 2013.Standard Test Methods for Frost Heave and Thaw Weakening Susceptibility of Soils. |
| Jo BW, Kim CH, Tae GH, et al., 2007. Characteristics of cement mortar with nano-SiO2 particles. Construction and Building Material, 27(6):1351-1355.DOI:10.1016/j.conbuildmat.2005.12.020. |
| KumarA, WaliaBS, MohanJ, 2006.Compressive strength of fiber reinforced highly compressible clay. Construction and Building Material, 20(11): 1063-1068. DOI:10.1016/j.conbuildmat.2005.02.027. |
| Ren XC, Hu K, 2014.Effect of nanosilica on the physical and mechanical properties of silty clay.Nanoscience and Nanotechnology Letters, 6:1010-1013. DOI: 10.1166/nnl.2014.1857. |
| Tang CS, Shi B, GaoW, et al., 2007.Strength and mechanical behavior of short polypropylene fiber reinforced and cement stabilized clayed soil. Geotextile and Geomembranes, 25(10):194-202.DOI:10.1016/j.geotexmem.2006.11.002. |
| Tart RG Jr,1983. Cold Regions Earthwork. Cold Regions Construction: A State of the Practice Report Papers Presented during a Session at the ASCE Annual Convention,pp. 32-37. |
 2015, 7


