Article Information
- Alexander Isakov, Anna Lavrova. 2015.
- Accounting for the solar radiation in thermal regime prediction for railway subgrade in cold regions
- Sciences in Cold and Arid Regions, 7(4): 293-299
- http://dx.doi.org/10.3724/SP.J.1226.2015.00293
Article History
- Received: April 17, 2015
- Accepted: June 10, 2015
1 Introduction
The impact of solar radiation, that is, the energy flux coming from the Sun to the Earth, on the Earth surface is the main factor determining the planet's thermal balance, not only during a single day but in the whole yearly cycle. The process of freezing-thawing of the so-called active layer of ground subjected to seasonal temperature fluctuations begins from its surface; therefore, to control this process it is necessary to know the degree of the solar radiation impact on it. This is even more important when considering railway subgrades.
2 Radiation balance and temperature correction
When solving any problem regarding subgrade freezing, it is necessary to specify two boundary conditions. The first is at the depth of the zero yearly temperature amplitudes, and the other is at the daylight surface. The latter assumes specifying the temperature of the ground or snow cover surface layer in the winter period, but this is complicated because this temperature is different from that of ambient air. The difference between these temperatures may be found from the Newton-Richman law:
| $P = \alpha \cdot ({t_{{\rm{srf}}}} - {t_{{\rm{air}}}})$ | (1) |
The air heat flow density P, which is necessary for determining the value of the temperature correction Δt = tsrf − tair, is one of the components of thermal balance, that is, the algebraic sum of the heat flows coming to the Earth surface and leaving it:
| $R + P + LE + B = 0$ | (2) |
The main component of thermal balance is the radiation balance R, the algebraic sum of the radiant energy consumed and radiated by the Earth surface:
| $R = Q \cdot (1 - A) + {E_{eff}}$ | (3) |
Shown in Figure 1 are the computing results obtained from Equations(1)-(3) of the temperature correction Δt = tsrf − tair to the annual variation of the air temperature for climatic conditions in the city of Novosibirsk area(SNiP 23-01-99*, 2003).
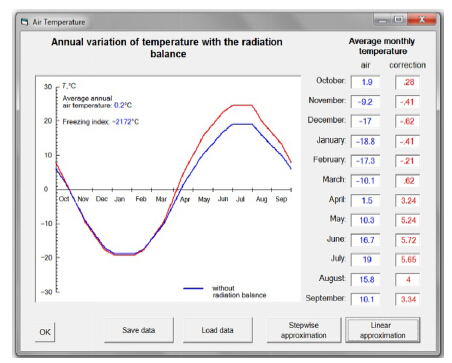 |
| Figure 1 Graph of annual variations of the air temperature for climatic conditions in the city of Novosibirsk area, accounting for the temperature correction in the Freeze-1 program |
All of the following temperature correction calculations were accomplished with the inclusion of the geographical location of the cities(latitude and longitude), the average monthly air humidity(Weather and climate, 2015), and the effective radiation and solar radiation in accordance with known climatological databases and publications(SNiP 23-01-99*, 2003). The amount of effective radiation was calculated using the programs(Teniz Ltd., 2013; Tsoi et al., 2014).
It is distinctly seen in Figure 1 that the maximum values of temperature correction correspond to the summer months, when the subgrade stratum warms. In the winter months, when subgrade freezing occurs, the correction values are not great. This means that the difference between the depths of the seasonal freezing calculated with and without temperature correction will be determined by some difference in the summer warming of the subgrade. Thus, it is an indirect factor which cannot have a significant influence on the final result.
3 Accounting for the temperature correction in calculating the depth of seasonal freezing of the subgradeTo validate the above temperature corrections, we used the Freeze-1 program to compare the depths of seasonal freezing of a subgrade of light loamy soil with 20% moisture content calculated for a closed system(without additional source of moisture). The Freeze-1 program was set up for st and ard subgrade construction(45 cm of crushed rock and 20 cm of s and )applicable to different climatic zones of Russia(STN Z-01-95, 1996), and the results are shown in Figure 2.
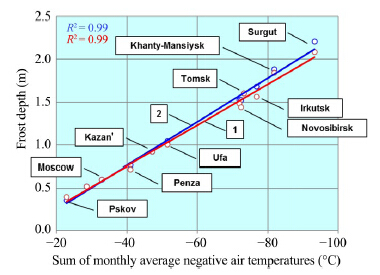 |
| Figure 2 Freeze-1 calculated depths of subgrade freezing under the main area of a railway track, with accounting for the temperature correction(1) and without it(2) |
As shown in Figure 2, the solar radiation doesn't have a serious impact on the seasonal freezing of the railway subgrade even in winter low-temperature conditions.
4 Influence of solar radiation on the depth of seasonal thawing of the subgrade in a cryolite zoneRegarding the impact of solar radiation on the thermal mode of a railway subgrade, a quite different situation occurs in the condition of permafrost. In the case of loamy soil subgrade, the problems are caused by seasonal freezing; in cryolite zones, however, the problems are caused by seasonal thawing and the degradation of permafrost, with both processes taking place in the warm season. As shown in Figure 3, it is exactly in this period, the summer months, when the maximum values of temperature correction occur, increasing the thermal impact on the subgrade.
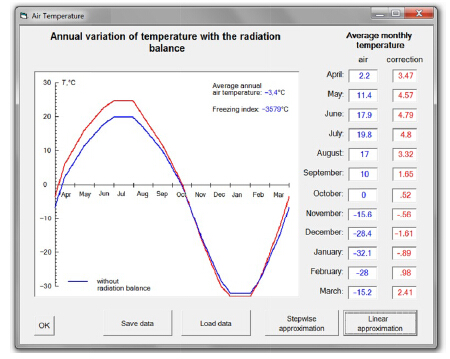 |
| Figure 3 Graph of annual variation of the air temperature in Kyzyl in south-central Russia, with accounting for temperature correction in the Freeze-1 program |
The beginning of the annual variation of the air temperature is taken as April 1, the onset of subgrade thawing. By analogy with the process of subgrade seasonal freezing, where its depth correlates well with sum of the average monthly negative air temperatures, it is reasonable to consider the seasonal thawing in cryolite zones as a function of the sum of average monthly positive air temperatures(Figure 4).
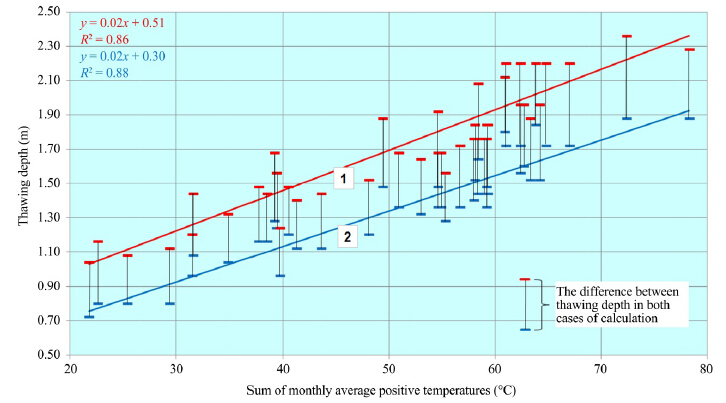 |
| Figure 4 Calculated depth of subgrade thawing under the main platform of a railway track, with accounting for the temperature correction(1) and without it(2) |
The calculation data points in Figure 4 reflect a wide range of climatic conditions in more than 40 cities in Russia(in the parentheses are the values of the sums of monthly average positive air temperatures, °С): Hodovarviha(21.8), Yukspor(22.6), Var and ey(25.4), Anadyr'(29.4), Vorkuta(31.5), Indiga(31.6), Hoseda(34.9), Brokhovo(37.7), Petrun(38.5), Ossora(39.2), Korf(39.4), Markovo(39.7), Okhotsk(40.5), Palatka(41.3), Turukhansk(43.6), Uakit(48.1), Mondy(49.4), Verkhnembatsk(50.9), Velmo(53.0), Perevoz(54.6), Sosnovo-Ozerskoye(54.6), Varnava(54.9), Kalakan(55.3), Tynda(56.7), Ekichman(58), Dubrovskoe(58.1), Vitim(58.4), Aleks and rovsk-Sakhalinskiy(58.4), Olekminsk(59.2), Ichera(59.2), Bodaybo(59.3), Nikolayevsk na Amure(61.0), Skovorodino(62.4), Krasnyy Chikoy(62.4), Ogoron(62.7), Dambuki(63.3), Yeniseysk(63.8), Bomnak(64.2), Chita(64.8), Zeya(67.0), Shimanovsk(72.4) and Kyzyl(78.3).
The high degree of correlation of the values presented in Figure 4 proves the validity of the selected functional dependency. In this case, accounting for the temperature correction Δt = tsrf −tair, determined by the influence of solar radiation, exerted a substantial influence on the final calculation of the depth of the subgrade seasonal thawing. The difference of the calculated values of the depth of seasonal thawing of the ground under the main area of the subgrade reached 20% and more.
Figure 5 compares the temperature distributions in subgrade for two cases, one with accounting for the temperature correction and the other without it, for the climatic conditions of the city of Chita on September 1. Here, however, sun screens had been placed over the railway track in areas of permafrost soil, so the influence of solar radiation was excluded from the calculations. Therefore, comparing these results with those given in Figure 4 elucidates the efficiency of using sunscreens for prevention permafrost degradation under the main subgrade area in a cryolite zone.
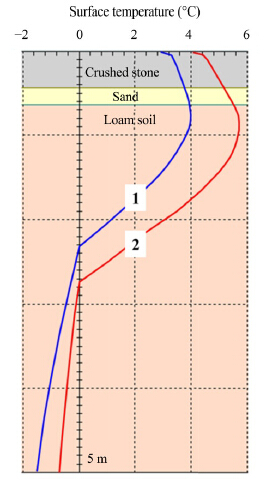 |
| Figure 5 Temperature distribution in soil under the main platform of a railway track, with accounting for the temperature correction(1) and without it(2) |
Sun screens have been shown to be one of the most efficient techniques for control of permafrost degradation in a subgrade base, but the use of polystyrene foam is also highly effective. Therefore, Figure 6 shows how the graph in Figure 4 might change if a layer of polystyrene foam 8 cm thick were placed on the main platform of the railway track subgrade.
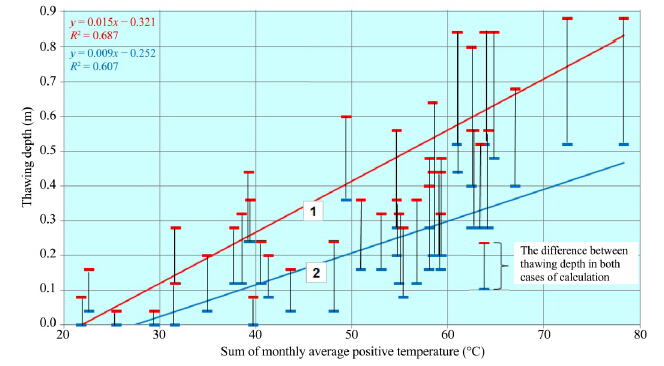 |
| Figure 6 Calculated depth of subgrade thawing under the main platform of a railway track with accounting for the temperature correction(1) and without it(2), in the presence of polystyrene foam 8 cm thick |
Figure 6 clearly illustrates that the influence of polystyrene foam on the thawing depth increases when the sum of monthly average positive temperatures on the ballast section surface increase. Also, the difference of relative values of thawing depth at presence of the polystyrene foam and without it may exceed 30%. At the same time, at the small values of the sum of monthly average positive temperatures on the ballast section surface the influence of polystyrene foam turned out to be insignificant.
5 Temperature criteria of origination of permafrostExperiments concerning the impact of solar radiation on the temperature mode of active layer grounds have shown that the use of sun screens in climatic zones which do not normally promote the origination of permafrost has actually influenced the development of permafrost. In such zones the use of sun screens has led to the appearance of streaks of non-thawing ground, that is, to the origination of streaks of permafrost soil in the active layer and below it. For example, Roshcin VV, in three years of experimenting, obtained a lens of permafrost under a 24m×11m sun shade constructed near the city of Bratsk, which is in a non-permafrost zone(Alekseev, 2007). In other words, excluding the solar radiation from the thermal balance nullified the temperature correction and took a decisive role in the appearance of permafrost. Thus, a natural question arises: How do the temperature conditions on the surface of the ground lead to the origination of permafrost in its depth? Figure 7 shows the results of many numerical experiments using the Freeze-1 program(Isakov and Kim, 2012; Isakov, 2013); the program was configured to evaluate the temperature mode change in the subgrade and its base during a yearly cycle.
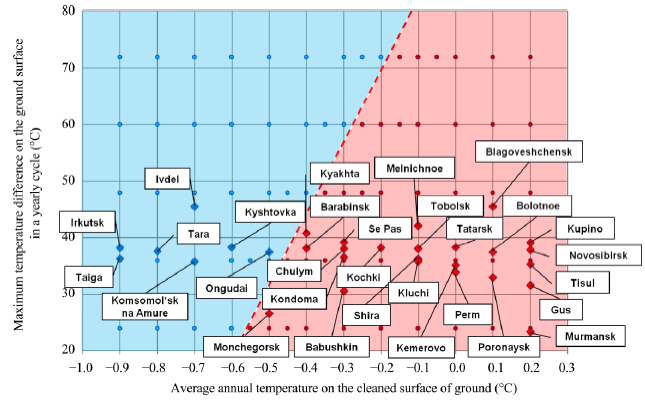 |
| Figure 7 Illustration of temperature criteria for origination of permafrost under sun shades(red: no permafrost; blue: presence of permafrost) |
Set along the abscissa axis are the average annual temperatures, Tavg, on the clean surfaces of ground(loamy clay)shielded by sun screens without snow cover in winter time, near approximately 30 Russian and foreign cities. Set along the ordinate axis are the maximum temperature differences on the ground surfaces in a yearly cycle, ΔT. In computing the ground temperature Tz0 at the depth of yearly zero amplitudes, Hz0 was taken as a second boundary condition. For uniformity in all cases, it was accepted that Hz0 = 25 m and Tz0 = +4 °C.
In Figure 5 the blue lines are the points corresponding to the conditions for the appearance of permafrost in the active layer of the ground body, and the red lines the absence of permafrost- all under sun screens. The dashed line in Figure 7 marks the boundary of the possible appearance of permafrost at the appropriate temperature conditions on the ground surface. Thus, given the above assumptions, the criterion for the appearance of permafrost is:
| $\Delta T > 45 + 107{T_{{\rm{avg}}}}$ | (4) |
If we exclude the impact of solar radiation on the ground surface, then the temperatures on the ground surface may be somewhat equated to air temperatures. Thus, in addition to the nameless computed points shown in Figure 7 shows real air temperature data in a number of cities of Russia and abroad, which are situated astride the line bounding the zone(blue color)of possible origination of permafrost in the presence of sun screens.
In accordance with the cited above computations(Figures 2, 4, 6, 7)are pointed selectively on the map of Russia(Figure 8)the cities systematized on the following features. The cities marked in red are situated in non-permafrost zones where, in the presence of sun screens, ground thawing always occurs to the full depth of their seasonal freezing. The cities marked in green are situated in non-permafrost zones where the presence of sun screens may lead to the origination of permafrost underneath them. And finally, the cities marked in blue are situated in cryolite zones.
 |
| Figure 8 The cities located in different zones of ground freezing-thawing conditions without accounting for solar radiation |
1)Our numerical computations showed the insignificant role of accounting for solar radiation in evaluating the depth of ground seasonal freezing in a wide range of average monthly air negative temperatures.
2)We validated a strong correlation between the depth of seasonal thawing of subgrades and the sum of average monthly air positive temperatures. Numerical analyses showed that excluding the solar radiation from the above computation led to decreasing the depth of seasonal thawing of railway track subgrade grounds in cryolite zones by an average of 20%.
3)Investigation of the construction of railway track with 8-cm-thick polystyrene foam laid on the subgrade main area in cryolite zone conditions shows that the influence of the foam on the thawing of the subgrade is directly dependent on the sum of average monthly air positive temperatures on the ballast section surface: the higher those sums of average temperatures, the more effective is the use of foam pads.
4)We formulated and illustrated with examples the temperature criterion of the origination of permafrost which binds the average yearly temperature on the ground surface with the temperature amplitude in a yearly cycle.
| Alekseev SI, 2007. Beds and foundations.Teaching aid for students of high school, St. Petersburg University of Railway, St. Petersburg. |
| Budyko MI, 1956. Thermal Balance of the Earth Surface. Leningrad: Gidrometizdat. |
| Isakov AL, 2013. Dangerous deformations of subgrade and methods of their calculation. Sciences in Cold and Arid Regions, 5(4): 353-362. DOI:10.3724/SP.J.1226.2013.00353. |
| Isakov AL, Kim HC, 2012. Thermal discrete model of soil freezing of roadbed. Transport of the Ural, 2(33): 121-125. |
| Kondratiev VG, 2011. Stabilization of subgrade on permafrost.In: Polygraph Resource. Chita, Russia. |
| Lukyanov VS, Golovko MD, 1957.Calculation of the Depth of Soil Freezing.Moscow:State Transport Railway Publisher. |
| Maslov AD, Osadchaya GG, Tumel NV, et al., 2005.Fundamentals of Geocryology. Teaching Aid, Institute of Management and Business Information,Uhta, Russia, pp. 176. |
| SNiP 23-01-99*, 2003.Building Climatology, Gosstroy of Russia. Moscow. |
| STN Z-01-95, 1996. Railway Track 1520 mm. Ministry of Railways, Moscow. |
| Teniz Ltd., 2013. Program for computation of effective radiation flow.http://maxteniz.kz/iak_in_rk/article_iac/ercalc/.(accessed on May,2015) |
| Tsoi AP, Granovsky AS, Baranenko AV, 2014. Modeling and mathematical program for computation of the value of effective radiation.Journal of International Academy of Refrigeration, 1: 7-10. |
| Weather and climate, 2015.Website: http://www.pogodaiklimat.ru/climate/29634.htm(accessed on May, 2015) |
 2015, 7


