Article Information
- Yu Zhang, JianHong Fang, JianKun Liu, AnHua Xu. 2015.
- Research on the distribution of saline soil along the Chaerhan-Golmud Highway, northwestern China
- Sciences in Cold and Arid Regions, 7(2): 189-193
- http://dx.doi.org/10.3724/SP.J.1226.2015.00189
Article History
- Received: April 13, 2014
- Accepted: September 16, 2014
2. Qinghai Research Institute of Transportation, Xining, Qinghai 810001, China;
3. China School of Civil Engineering, Beijing Jiaotong University, Beijing 100044, China
1 Introduction
Saline soil is a special kind of three-phase soil, making it different from general soil mass. When a saline soil phase change occurs, such as after soil salt dissolves in water, it will affect the physical and mechanical properties of the soil, including its strength, particle composition, salt content, salt type, and water content. Of these, salt content and salt type are the internal causes of strength changes of saline soil, whereas water content and penetration, the soluble filter function of dynamic water, and temperature are the external causes of strength changes of saline soil. Soil strength changes are the result of physical changes and chemical reactions, and they appear as structure reforming, expansion or contraction, dispersion, increase of strain rate, decrease of strength, and change of the hydraulic permeability of saline soil(Shi, 1999; Zhou et al., 2006). Frost heaving, leaching, and corrosion cause special geological problems for certain kinds of engineering construction, such as slope instability, building cracks, underground metal pipeline corrosion, and the need for subgrade mud pumping, all of which seriously harm transportation lines, water conservancy, and buildings in saline soil areas and cause huge economic losses for society(Luo, 2004). It is important to identify the areas of high water content and salt content in order to prevent the future emergence of wet saline soil subgrade problems.
Soil soluble salts mainly include chloride salts(NaCl, MgCl2, KCl, CaCl2), sulfate salts(Na2SO4, MgSO4, CaSO4), and carbonate salts(Na2CO3, NaHCO3), which the sodium salts(NaCl, Na2SO4, Na2CO3, and NaHCO3)are the most problematic in highway projects(Chen and Liu, 2006).
Saline soil is classified according to the level of highway engineering, salinization extent, and the nature of the salt content. The salinization extent classifications are excessive saline soil, strong saline soil, medium saline soil, and weak saline soil(Table 1). The classifications of the nature of the salt are chlorine saline soil, chlorite saline soil, sulfite saline soil, and sulfate saline soil(Table 2)(Xinjiang Highway Institute, 2006).
| Saline soil classification | Average soil salt content(Percentage of total quality) | |||
| Chlorine saline soil | Chlorite saline soil | Sulfite saline soil | Sulfate saline soil | |
| Weak saline soil | 0.3-1.5 | 0.3-1.0 | 0.3-0.8 | 0.3-0.5 |
| Medium saline soil | 1.5-5.0 | 1.0-4.0 | 0.8-2.0 | 0.5-1.5 |
| Strong saline soil | 5.0-8.0 | 4.0-7.0 | 2.0-5.0 | 1.5-4.0 |
| Excessive saline soil | >8.0 | >7.0 | >5.0 | >4.0 |
| Name of saline soil | Ion content ratio(mmol/kg) | |
| Cl−/SO42− | CO32−+HCO3−/ Cl−+SO42− | |
| Chlorine saline soil | >2 | — |
| Chlorite saline soil | 1-2 | — |
| Sulfite saline soil | 0.3-1.0 | — |
| Sulfate saline soil | <0.3 | — |
| Carbonate saline soil | — | >0.3 |
In order to grasp the scope of the distribution of saline soil along the Chaerhan-Golmud Highway in northwestern China, more than 200 monitoring points for saline soil soluble salt chemical tests were established in May 2012 along more than 40 km of the road, on both sides of the center line within the range of 3 to 6 m, in accordance with the "Test Methods of Soils for Highway Engineering(JTG E40-2007)"(Ministry of Transportation Highway Research Institute, 2007)requirements.
The salt type distribution along the road is shown in Table 3. Analysis of the salt nature classification showed that mostly chlorine saline soil was found along both sides of the road, 67.86% on the left side and 64.29% on the right side. In addition, there was a small amount of sulfite salt saline soil(17.86% and 25.00% on the left and right sides, respectively) and chlorite saline soil(10.71%). The salinization extent of saline soil was 67.86% and 53.57% on the left and right sides, respectively. There was a small amount of strong saline soil and medium saline soil on the left and right sides of road; strong saline soil accounted for 14.29%(left) and 32.14%(right), and medium saline soil accounted for 14.29%. As shown in Table 3, the saline soils were chloride salt type-excessive saline before milepost K604+500. From K604+600 to K622+000, sulfite saline soil, chlorite saline soil, and chlorine saline soil alternately appeared. From K622+000 to K641+600, the saline soils were chloride salt type-excessive saline. From K641+600 to K648+900, the saline soils were mostly sulfite saline.
| Milepost | Along the left side of road | Along the right side of road | |||
| Type of saline soil | Saline soil classification | Type of saline soil | Saline soil classification | ||
| K600+972 | Chlorine saline soil | Excessive saline soil | Chlorine saline soil | Excessive saline soil | |
| K601+047 | Chlorine saline soil | Excessive saline soil | Chlorine saline soil | Excessive saline soil | |
| K601+082 | Chlorine saline soil | Excessive saline soil | Chlorine saline soil | Strong saline soil | |
| K601+140 | Chlorine saline soil | Excessive saline soil | Chlorine saline soil | Excessive saline soil | |
| K602+000 | Chlorine saline soil | Excessive saline soil | Chlorine saline soil | Excessive saline soil | |
| K602+450 | Chlorine saline soil | Excessive saline soil | Chlorine saline soil | Excessive saline soil | |
| K602+650 | Chlorine saline soil | Excessive saline soil | Chlorine saline soil | Excessive saline soil | |
| K602+750 | Chlorine saline soil | Excessive saline soil | Chlorine saline soil | Excessive saline soil | |
| K603+260 | Chlorine saline soil | Excessive saline soil | Chlorine saline soil | Excessive saline soil | |
| K603+300 | Chlorine saline soil | Excessive saline soil | Chlorine saline soil | Excessive saline soil | |
| K603+640 | Chlorine saline soil | Excessive saline soil | Chlorine saline soil | Excessive saline soil | |
| K604+500 | Chlorine saline soil | Excessive saline soil | Chlorine saline soil | Excessive saline soil | |
| K604+600 | Sulfite saline soil | Strong saline soil | Sulfite saline soil | Strong saline soil | |
| K611+500 | Chlorite saline soil | Medium saline soil | Sulfite saline soil | Strong saline soil | |
| K616+400 | Chlorine saline soil | Excessive saline soil | Chlorine saline soil | Excessive saline soil | |
| K618+500 | Chlorite saline soil | Excessive saline soil | Chlorite saline soil | Strong saline soil | |
| K620+800 | Chlorine saline soil | Medium saline soil | Sulfite saline soil | Strong saline soil | |
| K622+000 | Sulfite saline soil | Strong saline soil | Chlorine saline soil | Strong saline soil | |
| K636+000 | Chlorine saline soil | Excessive saline soil | Chlorine saline soil | Strong saline soil | |
| K641+200 | Chlorine saline soil | Excessive saline soil | Chlorine saline soil | Strong saline soil | |
| K641+500 | Chlorine saline soil | Excessive saline soil | Chlorine saline soil | Excessive saline soil | |
| K641+600 | Chlorine saline soil | Excessive saline soil | Sulfite saline soil | Excessive saline soil | |
| K642+200 | Sulfite saline soil | Strong saline soil | Chlorite saline soil | Medium saline soil | |
| K642+300 | Chlorite saline soil | Excessive saline soil | Chlorine saline soil | Excessive saline soil | |
| K642+500 | Sulfite saline soil | Medium saline soil | Sulfite saline soil | Strong saline soil | |
| K648+660 | Chlorine saline soil | Medium saline soil | Chlorite saline soil | Medium saline soil | |
| K648+800 | Non-saline soil | Non-saline soil | Sulfite saline soil | Medium saline soil | |
| K648+900 | Sulfite saline soil | Strong saline soil | Sulfite saline soil | Medium saline soil | |
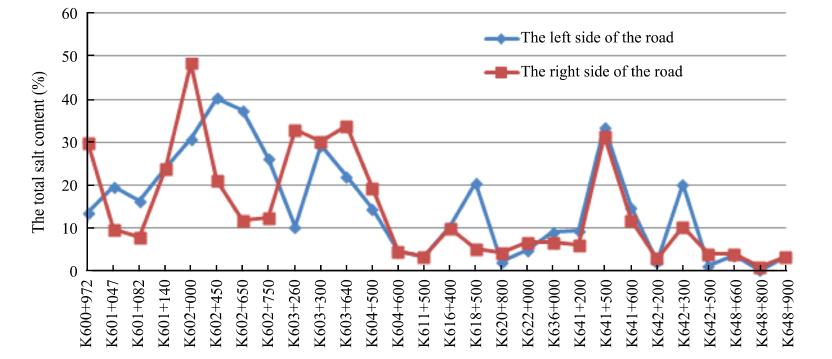
To clearly visualize the distribution of salt content along the sides of the highway, a series of figures were plotted. As can be seen in Figure 1, the salt content ranged from 0.221% to 48.464% along the studied 40-km length of the road. Therefore, as will be further discussed below, the choice of subgrade filler in this section of the highway must carefully consider the high salt content. Before milepost K604+500 and near K641+500 and K642+300, the total salt content along both sides of the road was more than 10%. The total salt content along the remaining sections was generally 10% or less. From K600+972 to K603+300, the differences between the total salt content along each side of the road were greater; beginning at K603+300, the difference between the two sides began to decrease, and the total salt content trends finally became nearly identical along both sides of the road.
|
| Figure 1 The total salt content distribution along both sides of the road |
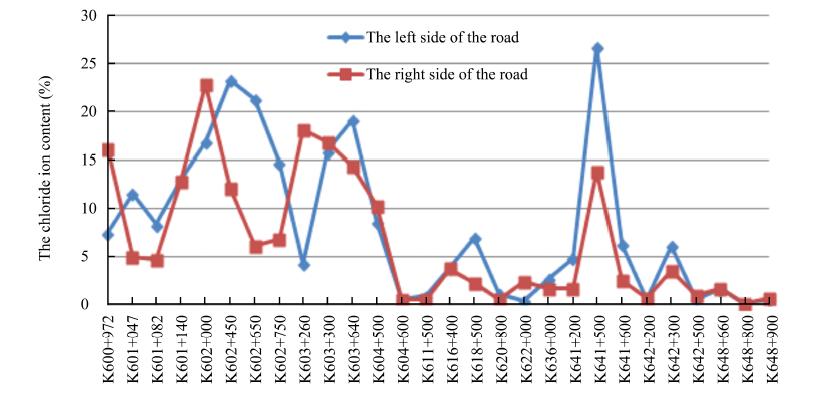
As can be seen in Figure 2, before milepost K604+500 and near K641+500 and K642+300, the chloride ion content along both sides of the road was more than 5%. The remaining sections of the road had generally 5% or less chloride ion content. From K600+972 to K603+300, the chloride ion content was significantly different along both sides of the road; beginning at K603+300, difference began to decrease, and finally became very similar along both sides of the road. Compared with Figure 1, the chloride ion content trends were close to the total salt content trends, suggesting that the total salt content was mainly affected by the chloride ion content changes.
|
| Figure 2 The chloride ion content distribution along both sides of the road |
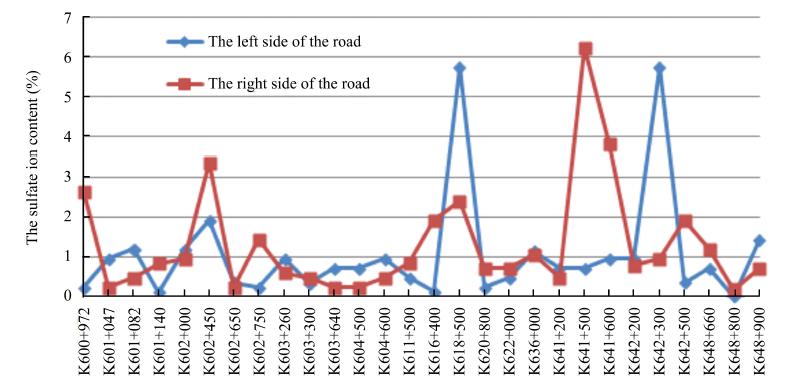
In Figure 3, at four monitoring points(near K602+450, K618+500, K641+500, and K642+300)the sulfate ion content all exceeds 2%. The remaining sections of sulfate ion content are basically stable, being approximately 1% or less. Sulfate ion content is one of the major factors that leads to salt expansion deformation of subgrade, so this section of the road should be the focus of paying more attention to. Comparing Figure 1 and Figure 2, the sulfate ion content has little relationship with the chloride ion content and the total salt content trends along both sides of the road. Only near K614+500 and K642+300, the total content decreased and the content of sulfate ions increased.
|
| Figure 3 The sulfate ion content distribution along both sides of the road |
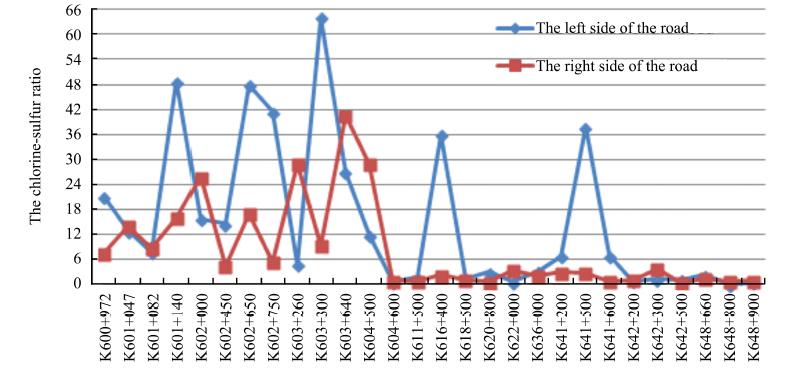
Previous studies(Chen and Liu, 2006)have found that when the Na2SO4 content exceeds 0.5%, the impact of salt expansion is more obvious, resulting in subgrade damage. However, when the chloride ion content is large, under corresponding temperature conditions, studies have found that with chlorine-sulfur ratio increases, Na2SO4 salt expansion can be effectively suppressed. When the ratio increases to more than 6, the effect will be significant. As shown in Figure 4, before milepost K604+500 the chlorine-sulfur ratio is close to 6, or more than 6, along both sides of road. After K604+500, where the total salt content and chloride ion content are reduced but the sulfate ion content is stable, the chlorine-sulfur ratio is less than 6. Therefore, this section of the road should be of greater concern, and the sulfate ion content should be determined and controlled.
|
| Figure 4 The chlorine-sulfur ratio distribution along both sides of the road |
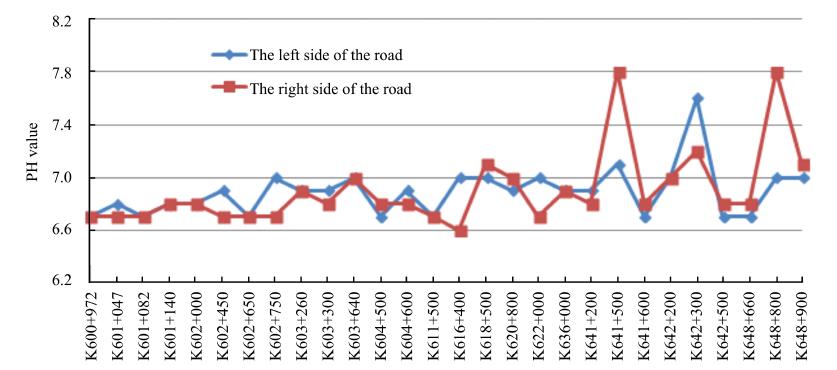
Figure 5 shows that at four positions(near K618+500, K641+500, K642+300, and K648+800)the PH value exceeded 7. In the remaining sections of the road, the PH value was stable at below 7 and was weakly alkaline along both sides of the road.
|
| Figure 5 The PH value distribution along both sides of the road |
Analysis of soil soluble salt contents along both sides of a 40-km section of the Chaerhan-Golmud Highway indicated that the total salt content, the chloride ion content, and the sulfate ion content are significantly different along each side of the road. There are also significant variations in the soil PH and the chlorine-sulfur ratio. As a result, there will be large differences in soil freezing temperatures, frost heave, and salt expansion, which directly affects the subgrade stability and, ultimately, the extent of subgrade damage. Therefore, when subgrade filler for this highway is selected, attention must be paid to its chemical indicators as well as its physical properties.
Acknowledgments: The authors wish to acknowledge the support and motivation provided by the Natural Science Foundation of Gansu Province(No. 145RJZA054) and Youth Science Foundation of Lanzhou Jiaotong University(No. 2012032). 2015, 7


