Article Information
- YanWei Zhang, QuanSheng Ge, FengQing Jiang, JingYun Zheng, WenShou Wei. 2015.
- Assessing changes in extreme precipitation over Xinjiang using regional climate model of PRECIS
- Sciences in Cold and Arid Regions, 7(2): 170-179
- http://dx.doi.org/10.3724/SP.J.1226.2015.00170
Article History
- Received: March 19, 2014
- Accepted: July 17, 2014
2. College of Environment and Planning, Shangqiu Normal University, Shangqiu, Henan 476000, China;
3. College of Geographical Science, Shanxi Normal University, Linfen 041000, Shanxi, China;
4. Xinjiang Institute of Ecology and Geography, Chinese Academy of Sciences, Urumqi, Xinjiang 830011, China
1 Introduction
Extreme climate events have attracted more attention in the past few years due to their potentially severe and adverse impacts on human life, social economy, and natural ecosystems(Rusticucci and Renom, 2008; Li et al., 2010; Zhang et al., 2013). Precipitation plays an important role among the most relevant climate variables, and its study about climate extremes over a regional scale is particularly meaningful(Santos et al., 2007; Marty and Blanchet, 2012). Precipitation is the main source of surface water on a l and mass. Underst and ing the spatial and temporal variability of precipitation is important, not only to climate scientists, but also hydrologists, agriculturalists, emergency managers, industrialists, and decision makers(Ebert et al., 2007; Brunsell, 2010). During the past decades, many studies about the spatial-temporal variability of extreme precipitation have been conducted. A lower frequency but higher intensity of extreme precipitation events was reported in the USA during the 20th century(Changnon et al., 2006; Kirchgäßner, 2011), with trends of downward precipitation frequency in the lower Midwest, South, and West Coast, while upward in the upper Midwest, East, and Northeast, and the entire country(Changnon et al., 2006). In Spain, Argüeso et al.(2012) showed that the frequency of blizzards during the latest decades(1970-1999)has increased. The regional climate model REMO 5.1 has been applied to the European region to investigate the impact of future climate change on the frequency and intensity of extreme precipitation events(Semmler and Jacob, 2004). Description of extreme precipitation in both intensity and frequency give a different and complementary overview of future extreme event changes with multi-scaled analyzed extreme climate(Sánchez et al., 2004). Regional climate models(RCMs)from the Ensembles project are analyzed to assess projected changes of heavy and extreme precipitation events over Europe in the 21st century(Rajczak et al., 2013). Projected changes of extreme precipitation in the Mediterranean at the end of the 21st century are analyzed by means of the statistical downscaling method(Hertig et al., 2013). Lucio(2004) simulated extremes in future scenarios with the analysis of risk or probability maps for spatial uncertainties. Revadekar et al.(2011) analyzed characteristic features of future precipitation extremes over India in the warming scenarios. Analysis of long-term precipitation variability based on entropy over Xinjiang, northwestern China(Jiang et al., 2011)show that in the south of Xinjiang, variability only increased slightly, consistent with the spatial distribution of precipitation. Due to the significant importance of such observational studies, more attention has been paid in the climate research on the development of statistical methods that provide inference on observed changes in extremes with necessary precision. This study focused on Xinjiang which presents important research aspects, e.g., inter-annual variability in precipitation and precipitation indices. The main statistical extreme value methods that the calculation of indices developed by ETCCDI is used in Xinjiang regions. This method has been widely applied in Europe, United States and other regions(Caesar et al., 2011; Gallego et al., 2011; Vincent et al., 2011).
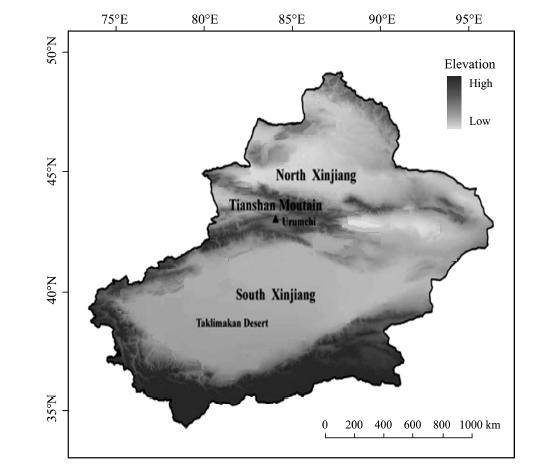
Xinjiang, located in northwestern China, is characterized by an arid climate and is defined as one of the most sensitive regions to global warming(Figure 1). Xinjiang is divided by the Tianshan Mountains into southern and northern parts. The climate is mostly affected by the westerly current from the Atlantic and Arctic oceans. Precipitation, melt-water of glaciers and runoff of rivers are rising with increasing flood damage, increasing vegetation coverage and decreasing dust storm events(Yang, 2003). In this sense, precipitation changes play a crucial role in the sustainable ecological environment and regional socio-economy. Increasing frequency and intensifying weather extremes such as precipitation extremes will further raise the sensitivity of ecological environment to climate change, which is the major motivation of this current study. Jiang and Yang(2004) and Jiang et al.(2002a, b, 2004, 2005)indicated an increase of droughts and floods in the study region and this observation is consistent with changing properties of floods and droughts in China and the world. Shi et al.(2002, 2003)showed that the regional climate in northwestern China exhibited a changing process from warm-dry pattern to warm-wet pattern over the last two decades while the globe experienced a warming process. Flood and drought will potentially increase, enhanced and intensified in the 21st century in Xinjiang in terms of global warming(Xu, 1997; Jiang et al., 2004; Zhang et al., 2008).
|
| Figure 1 The terrain of the research region |
In this paper, we assess the performance of PRECIS in simulating future extreme climate events by comparing with present observation in daily extreme precipitation indices. PRECIS projected changes in extremes under the two climate-change scenarios: IPCC SRES A2 high emission and B2 low emission.
2 Data and method 2.1 Regional climate model dataPRECIS, driven by two IPCC SRES(Special Report on Emission Scenarios)(Nakicenovic et al., 2004)A2 and B2 as boundary input, has simulated the climate environment for present(1961-1990) and the future(2071-2100)in Xinjiang. PRECIS is a regional climate model(RCM), developed by the UK Met Office Hadley Centre for Climate Prediction and Research. In this research, the simulation was run with a high horizontal resolution of 50km×50km and 19 layers in vertical, configured the upper left point(73°E, 50°N)in domain and the lower right point(97°E, 34°N)in domain. The boundary driven dataset is a high-resolution global climate model(GCM)(150km×150km)called HadAM3H in "time slice" experiments, which is the only atmosphere model derived from the atmospheric component of HadCM3(Gordon and Cooper, 2000; Pope et al., 2000). In this study, daily precipitation is selected from baseline period(1961-1990) and two future SRES A2 and B2 in the period of 2071-2100.
2.2 MethodologyIn this study, six extreme precipitation indices defined by the ETCCDI are utilized. The software is freely available from the ETCCDI website(http: //cccma.seos.uvic.ca/ETCCDI/). RClimDex performs data quality control and indices calculation, which is developed and maintained by Zhang and Yang(2004). RH(R language Homogeneity)test performs for homogeneity tests. For this study, the period from 1961 to 1990 is selected as extraction of anomaly time series. The calculated extreme precipitation indices are listed in Table 1.
| Index | Descriptive name | Definition | Units |
| PRCPTOT | Wet day precipitation | Annual total precipitation from wet days | mm |
| SDII | Simple daily intensity index | Average precipitation on wet days | mm/d |
| RX1day | Maximum 1-day precipitation | Annual maximum 1-day precipitation | mm |
| RX5day | Maximum 5-day precipitation | Annual maximum consecutive 5-day precipitation | mm |
| R95 | Very wet day precipitation | Annual total precipitation when RR >95% of 1961-1990 daily precipitation | d |
| CDD | Consecutive dry days | Maximum number of consecutive dry days | d |
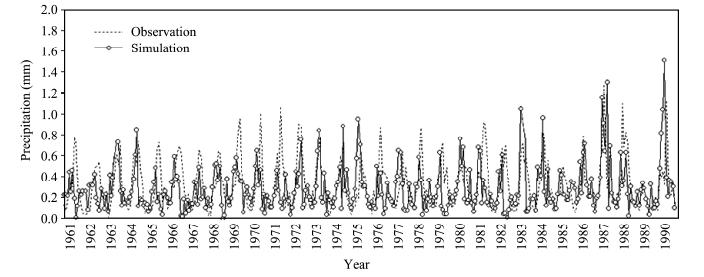
Figure 2 demonstrates the comparison of precipitation between PRECIS simulation and baseline observation period(1961-1990)in Xinjiang. For the historical period, PRECIS performs well in spatial distribution compared with observation. In recent years, PRECIS has been successfully deployed in Europe, the Indian sub-continent, and South Africa. Besides impact assessment(Jones et al., 2004), PRECIS has been driven by ECMWF's(European Centre for Medium-Range Weather Forecasts)(1979-1983)reanalysis dataset(Xu and Jones, 2004), proving it's capability over China. Also, mean temperature and precipitation could capture the annual cycle changing pattern(Xu et al., 2007; Chen et al., 2008). Zhang et al.(2006)considered that PRECIS is also able to capture spatial patterns of precipitation extremes over China compared with this study. Their analysis indicates that the model's simulations provide an adequate representation of present-day maximum rainfall in China.
|
| Figure 2 Comparison between observation and simulation |
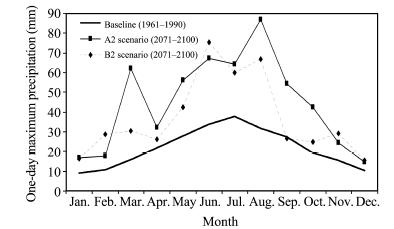
Mean annual precipitation over Xinjiang has experienced an increasing trend since the 1980s. Shi et al.(2002)showed that northwestern China experienced a warm-dry climate pattern from the end of the little Ice Age to the 1980s due to global warming. The arid and semi-arid regions(ASAR)of northern China cover half of China(Chen et al., 2009; Li et al., 2013). Annual rainfall in these regions is almost less than 400 mm. The most arid and semi-arid regions including Xinjiang, have more than 70% of annual rainfall occurring in the rainy months of June through September(JJAS). Thus, we redefine the seasons: MAM(March, April, May)for spring, JJAS(June, July, August, September)for summer, ON(October, November)for autumn and DJF(December, January, February)for winter, respectively. Increase precipitation is seen through the annual cycle based on monthly mean all-Xinjiang one-day maximum precipitation(Figure 3). Seasonal cycles are well captured with the dominance of summer(JJAS)season over the Xinjiang region with very high values of one-day maximum precipitation throughout the season. From A2 and B2 scenarios, we find similar patterns of annual cycles indicating no major changes in seasonality. Both A2 and B2 scenarios show increase in one-day maximum precipitation towards the end of the 21st century, but their magnitude change is different for each month. One-day maximum precipitation is seen in summer season, and dominance of summer season is likely to be enhanced over the Xinjiang region. In general, changes in one-day maximum precipitation are higher in A2 than in B2 scenarios. However, summer show high magnitude increment in one-day maximum precipitation than in the remaining months. Five-day maximum precipitation also represents similar features(not shown).
|
| Figure 3 Comparison among the baseline, SRES A2, and B2 in monthly mean one-day maximum precipitation(RX1day, mm)in entire Xinjiang |
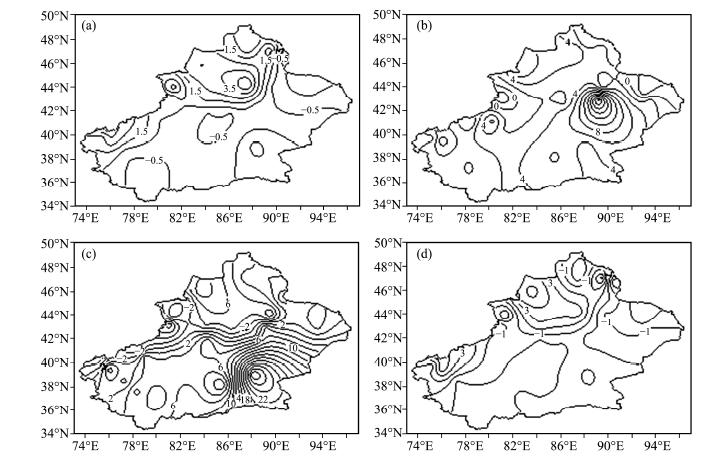
Extremes are calculated by grids with three periods, baselines, SRES A2 and SRES B2 in the seasons. Bias of one-day maximum precipitation between baselines and SRESs in the seasons is presented in terms of spatial pattern in Figure 4. Heavy rainfall activity in summer of SRES A2 occurs with high magnitude in Xinjiang, and there is less bias in winter and spring. However, northeastern Xinjiang shows heavy rainfall activity in spring.
|
| Figure 4 Spatial patterns of changes in anomalies of seasonal one-day maximum precipitation in mm, RX1day in DJF(a); MAM(b); JJAS(c); ON(d)(A2 minus baseline) |
In summer, the extensive area with one-day maximum precipitation for 2-22 mm covers the east and south of Xinjiang, including the Tarim and Turfan-Hami basins. In spite of this, the north and northwest of Xinjiang(including Ili region and Jungar Basin)show lower intensity in one-day maximum precipitation. Other seasons show less bias than summer. Changing pattern of five-day maximum precipitation indices is the same as one-day maximum precipitation indices. Thus, the enhanced heavy rainfall activity seen in summer and indicated by the all-Xinjiang mean annual cycles are associated with widespread projected increases in both one-day and five-day maximum precipitation over the entire Xinjiang.
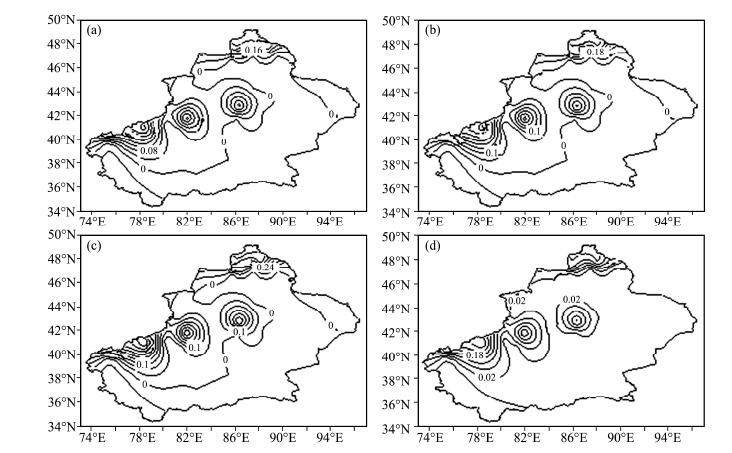
3.2.2 Frequency indicesFrequency of extreme precipitation is computed by counting the days in the season when daily precipitation exceeds 10 mm(R10mm). R10mm index is computed by grids for the baseline(1961-1990) and A2(2071-2100)scenario. The bias between A2 scenario and baseline is presented in Figure 5. Frequency of R10mm indicates a higher bias in summer and no remarkable change for the rest of the year. Only in spring, slightly high bias occurs in the northwest of Xinjiang. The regions which have high bias in frequency of R10mm, share the same area with intensity indices. R10mm shows precipitation is likely to increase in the future.
|
| Figure 5 Spatial patterns of changes in seasonal count of days when precipitation exceeding 10 mm, R10mm(A2(2071-2100)minus baseline(1961-1990))in DJF(a); MAM(b); JJAS(c); ON(d) |
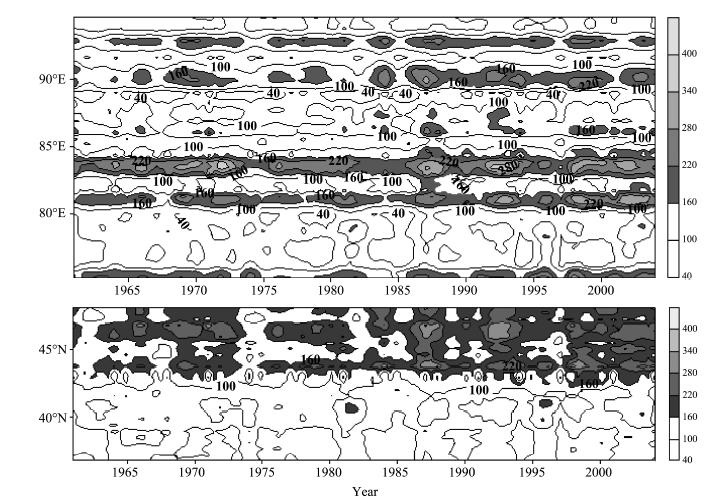
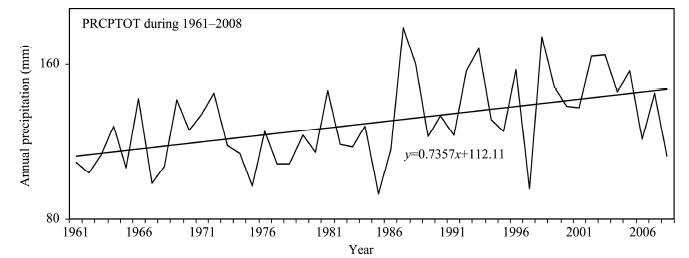
PRCPTOT is useful to detect precipitation on a spatial and temporal scale. For this purpose, PRCPTOT have been computed by grids in the baseline(1961-2008), A2 and B2 scenarios(2071-2100). PRCPTOT has shown a space-time distribution of annual precipitation in baseline(1961-2008), A2 scenario(2071-2100)in Xinjiang and the precipitation bias in A2 scenario referencing to baseline, averaged over the longitudinal range of 73°E-97°E and the latitudinal range of 34°N-50°N(Figure 6). This figure essentially presents annual precipitation over Xinjiang in terms of time-latitude variation and time-longitude variation. The plot for baseline(1961-2008)clearly shows the phases of onset, progress, and clear south-to-north withdrawal and reverse progressions are seen in Figure 6. The A2 scenario(2071-2100)also shows similar features indicating that future seasonal characteristics are likely to remain the same towards the end of the 21st century(not shown). There is a marked increasing trend in annual precipitation of 0.74 mm per decade in the baseline(Figure 7). Figure 6 shows that most precipitation is distributed in 42°N-48°N. It is well known that the precipitation distribution in Xinjiang varies considerably from south to north.
|
| Figure 6 PRCPTOT plot for spatial-temporal distribution of daily precipitation for baseline(1961-2008) |
|
| Figure 7 Annual precipitation during 1961-2008 |
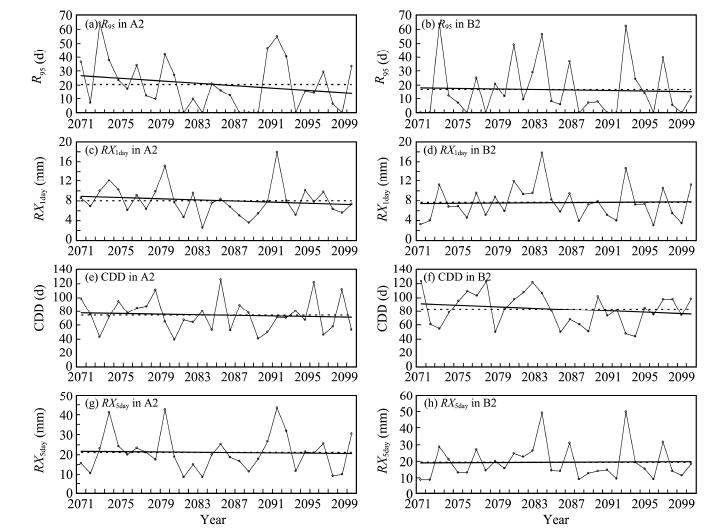
In general, R95 shows a decreasing trend with the rate of 0.43 day per decade(Figure 8a) and 0.1 day per decade(Figure 8b), which possibly contributed to the decline in annual total precipitation. Negative trends in R95 could cause water stress in most regions of the study area, especially the Urumqi City, as these areas have been undergoing serious water shortage and water pollution. RX1day shows a decreasing trend with the ratio of 0.05 day per decade(Figure 8c), and upward trends with the increasing ratio of 0.1 day per decade(Figure 8d). RX5day shows a decreasing trend with the ratio of 0.03 day per decade(Figure 8g) and increasing trend with the ratio of 0.03 day per decade(Figure 8h). Figures 8e and 8f show the trends of regional averaged indices of CDD in A2 and B2. CDD indicates a decreasing ratio of 0.22 day per decade in A2(Figure 8e) and a decreasing ratio of 0.53 day per decade in B2(Figure 8f), and this decreasing trend mainly happened in most regions of Xinjiang.
|
| Figure 8 Time series of regional averaged indices for(a)R95 in A2, (b)R95 in B2, (c)RX1day in A2, (d)RX1day in B2, (e)CDD in A2, (f)CDD in B2, (g)RX5day in A2, and (h)RX5day in B2 during 2071-2100 |
It is well known that each year, summer(JJAS)brings large amounts of rain for most of the region, while other parts of the region can experience serious drought. In Xinjiang, summer precipitation plays a dominant role in agricultural production, economy, and human lives. An attempt is made in this section to see explain changes in summer precipitation extremes towards the end of the 21st century.
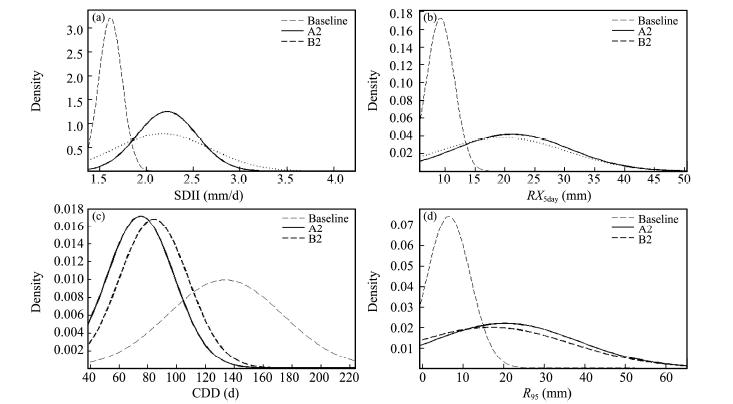
Probability distribution functions(PDFs)are calculated for indices of precipitation extremes for baseline(1961-1990), A2 and B2 scenarios(2071-2100)using yearly indices at all grids to underst and the changes which are likely to occur in the future over the Xinjiang l and mass. Figure 9 shows PDFs for(1)daily intensity(SDII, mm/rainy day);(2)five-day maximum precipitation(RX5day, mm);(3)maximum spell of continuous dry days(CDD) and (4)annual total precipitation when RR >95% of 1961-1990 daily precipitation(R95, d)for baseline, A2 and B2 scenarios. All PDFs show a positive shift in precipitation extremes in both A2 and B2 scenarios indicating decrease in low-precipitation extremes and increase in high-precipitation extremes. Changes in B2 scenarios are low compared to changes in A2 scenarios. It can also be seen from Figure 8 that the probability of mean value of precipitation extremes has been reduced in both A2 and B2 scenarios with slightly more reduction in A2 scenarios. Higher changes are seen for SDII and RX5day. Other indices of precipitation extremes during summer season like RX1day, R10mm, and CWD also represent similar features(not shown). In general, there is an indication towards a wetter climate, without increase in summer precipitation extremes.
|
| Figure 9 Probability distribution function of daily intensity(a); five-day maximum precipitation(b); maximum spell of continuous dry days(c); annual total precipitation when RR >95% of 1961-1990 daily precipitation(d)in baseline(1961-1990), A2 and B2 scenarios(2071-2100)in summer, Xinjiang |
Extreme precipitation events have serious impacts on human society, infrastructure, natural resources, and ecosystem. This paper analyzed the frequency and intensity trends of extreme precipitation characterized by six indices in Xinjiang, an arid l and in northwestern China. A comprehensive analysis has been done in this paper to study characteristic of precipitation extremes in detail and its seasonal behavior using st and ardized indices on PRECIS simulations over the Xinjiang region for the period of 2071-2100. The following important conclusions are obtained.
1)Model simulations under scenarios of increasing greenhouse gas concentration indicate marked increase in precipitation towards the end of the 21st century.
2)PRECIS simulations under both A2 and B2 scenarios indicate increase in frequency of extreme precipitation events and shift in their intensity towards the end of the 21st century. Daily precipitation and extreme precipitation is projected to increase during 2071-2100. However, B2 scenario shows slightly lower magnitudes changes than those in A2 scenarios.
3)Most extreme precipitation indices trend show a shift starting from the middle of the 1980s. In addition to the decadal fluctuations, the variation with three peaks and three valleys for the extreme precipitation indices of Xinjiang were identified. The variation became dramatic since the middle of the 1980s and greater in the 1990s.
4)The extreme precipitation indices probability density functions(PDFs)show a shift and a widening and flattening in future climate scenarios. Changes in B2 scenarios are lower than changes in A2 scenarios. The large spatial variability of future precipitation extremes is clear evidence of the importance of using regional climate models, improving our underst and ing of these issues.
Acknowledgments: The research presented in this article was jointly funded by Henan Province Office of education of Humanities and social science research projects(2014-qn-151); the "Western Light" Project(RCPY200902)of the Chinese Academy of Sciences; the special scientific research project(GYHY200706008); the project of National Social Science Foundation(14CJY077); Science and Technology Department of Henan Province key scientific and technological project(142102310299); and the National Natural Science Foundation(41171066)of Xinjiang Institute of Ecology and Geography. The authors would like to thank the reviewers for their invaluable suggestions.| Argüeso D, Hidalgo-Muñoz JM, Gámiz-Fortis SR, et al., 2012. Evaluation of WRF mean and extreme precipitation over Spain: present climate (1970-99). Journal of Climate, 25: 4883-4897. DOI: http://dx.doi.org/10.1175/JCLI-D-11-00276.1. |
| Brunsell NA, 2010. A multiscale information theory approach to assess spatial-temporal variability of daily precipitation. Journal of Hydrology, 385(1-4): 165-172. DOI: 10.1016/j.jhydrol. 2010.02.016. |
| Caesar J, Alexander LV, Trewin B, et al., 2011. Changes in temperature and precipitation extremes over the Indo-Pacific region from 1971 to 2005. International Journal of Climatolog, 31(6): 791-801. DOI: 10.1002/joc.2118. |
| Changnon SA, Changnon D, Karl TR, 2006. Temporal and spatial characteristics of snowstorms in the contiguous United States. Applied Meteorology and Climatology, 45: 1141-1155. DOI: http://dx.doi.org/10.1175/JAM2395.1. |
| Chen N, Xu YF, Chen XG, et al., 2008. Preliminary validation of PRECIS climate simulation in Ningxia. Scientia Meteorologica Sinica, 28(1): 94-99. DOI: 10.3969/j.issn.1009-0827. 2008.01.016. |
| Chen W, Zhu DQ, Liu HZ, et al., 2009. Land-air interaction over arid/semi-arid areas in China and its impact on the east Asian summer monsoon. Part I: Calibration of the land surface model (BATS) using multicriteria methods. Advances in Atmospheric Sciences, 26(6): 1088-1098. DOI: 10.1007/s00376-009-8 187-3. |
| Ebert EE, Janowiak JE, Kidd C, 2007. Comparison of near-real-time precipitation estimates from satellite observations and numerical models. Bulletin of the American Meteorological Society, 88(1): 47-64. DOI: http://dx.doi.org/10.1175/BAMS-88-1-47. |
| Gallego MC, Trigo RM, Vaquero JM, et al., 2011. Trends in frequency indices of daily precipitation over the Iberian Peninsula during the last century. Journal of Glaciology and Geocryology, 116(D2): D02109. DOI: 10.1029/2010JD014255. |
| Gordon C, Cooper C, 2000. The simulation of SST, sea ice extents and ocean heat transports in a version of the Hadley Center coupled model without flux adjustments. Climate Dynamics, 16(2-3): 147-168. |
| Hertig E, Seubert S, Paxian A, et al., 2013. Statistical modelling of extreme precipitation indices for the Mediterranean area under future climate change. International Journal of Climatology, 34(4): 1132-1156. DOI: 10.1002/joc.3751. |
| Jiang FQ, Hu RJ, Wang SP, et al., 2011. Trends of precipitation extremes during 1960-2008 in Xinjiang, the Northwest China. Theoretical and Applied Climatology, 111: 133-148. |
| Jiang FQ, Hu RJ, Yang YH, 2004. Abrupt change in the time sequences of flood disasters in Xinjiang and its possible climatic reasons. Journal of Glaciology and Geocryology, 26(6): 674-681. |
| Jiang FQ, Yang YH, 2004. Potential links of flood and drought disaters in Xinjiang to some larger-scale climatic driving forces. Arid Land Geography, 27: 148-152. DOI: 10.3321/j.issn:1000-6060.2004.02.004. |
| Jiang FQ, Zhu C, Hu RJ, et al., 2002a. Statistical and fractal features of the flood and drought disasters in Xinjiang from 1950 to 1997. Journal of Natural Disasters, 11: 96-100. |
| Jiang FQ, Zhu C, Mu GJ, et al., 2002b. Recent magnification of flood and drought calamities in Xinjiang: An analysis of anthropogenefic effects. Acta Geographica Sinica, 57: 57-66. |
| Jiang FQ, Zhu C, Mu GJ, et al., 2005. Magnification of Flood Disasters and its relation to regional precipitation since the 1980s in Xinjiang, North-western China. Natural Hazard, 36(3): 307-330. DOI: 10.1007/s11069-005-0977-z. |
| Jones R, Noguer M, Hassell D, et al., 2004. Generating High Resolution Climate Change Scenarios Using PRECIS, Hadley Centre for Climate Prediction and Research, Met. Office Hadley Centre, London, UK. |
| Kirchgäßner A, 2011. An analysis of precipitation data from the Antarctic base Faraday/Vernadsky. International Journal of Climatology, 31: 404-414. DOI: 10.1002/joc.2083. |
| Li BF, Cheng YN, Chen ZS, et al., 2013. Variations of temperature and precipitation of snowmelt period and its effect on runoff in the mountainous areas of Northwest China. Journal of Geographical Science, 23(1): 17-30. DOI: 10.1007/s11442-0 13-0990-1. |
| Li Z, Zheng FL, Liu WZ, et al., 2010. Spatial distribution and temporal trends of extreme temperature and precipitation events on the Loess Plateau of China during 1961-2007. Quaternary International, 226(1-2): 92-100. DOI: 10.1016/j.quaint.2010.03.003. |
| Lucio PS, 2004. Assessing HadCM3 simulations from NCEP reanalyzes over Europe: diagnostics of block-seasonal extreme temperature's regimes. Global and Planetary Change, 44(1-4): 39-57. DOI: 10.1016/j.gloplacha.2004.06.004. |
| Marty C, Blanchet J, 2012. Long-term changes in annual maximum snow depth and snowfall in Switzerland based on extreme value statistics. Climatic Change, 111(3-4): 705-721. DOI: 10.1007/s10584-011-0159-9. |
| Nakicenovic N, Alcamo J, Davis G, et al., 2004. "IPCC, Special Report on Emissions Scenarios (SRES)." Working Group III, Intergovernmental Panel on Climate Change (IPCC) number, Cambridge University Press, Cambridge, UK. |
| Pope VD, Gallani ML, Rowntree PR, et al., 2000. The impact of new physical parametrizations in the Hadley center climate model: HadAM3. Climate Dynamics, 16(2-3): 123-146. DOI: 10.1007/s003820050009. |
| Rajczak J, Pall P, Schär C, 2013. Projections of extreme precipitation events in regional climate simulations for Europe and the Alpine Region. Journal of Geophysical Research: Atmospheres, 118(9): 3610-3626. DOI: 10.1002/jgrd.50297. |
| Revadekar JV, Patwardhan SK, Rupa Kumar K, 2011. Characteristic features of precipitation extremes over India in the warming scenarios. Advances in Meteorology, 10: 1-11. DOI: 10.1155/ 2011/138425. |
| Rusticucci M, Renom M, 2008. Variability and trends in indices of quality-controlled daily temperature extremes in Uruguay. International Journal of Climatology, 28(8): 1083-1095. DOI: 10.1002/joc.1607. |
| Sánchez E, Gallardo C, Gaertner MA, et al., 2004. Future climate extreme events in the Mediterranean simulated by a regional climate model: a first approach. Global and Planetary Change, 44: 163-180. DOI: 10.1016/j.gloplacha.2004.06.010. |
| Santos JA, Corte-Real J, Ulbrich U, et al., 2007. European winter precipitation extremes and large-scale circulation: a coupled model and its scenarios. Theoretical and Applied Climatology, 87: 85-102. DOI: 10.1007/s00704-005-0224-2. |
| Semmler T, Jacob D, 2004. Modeling extreme precipitation events—a climate change simulation for Europe. Global and Planetary Change, 44: 119-127. DOI: 10.1016/j.gloplacha. 2004.06.008. |
| Shi YF, Shen YP, Hu RJ, 2002. Preliminary study on signal, impact and foreground of climatic shift from warm dry to warm-humid in Northwest China. Journal of Glaciology and Geocryology, 24: 219-226. |
| Shi YF, Shen YP, Li DL, et al., 2003. Discussion on the present climate change from warm-dry to warm-wet in Northwest China. Quaternary Sciences, 23: 152-164. |
| Vincent LA, Aguilar E, Saindou M, et al., 2011. Observed trends in indices of daily and extreme temperature and precipitation for the countries of the western Indian Ocean, 1961-2008. Journal of Geophysical Research: Atmospheres, 116: D10108. DOI: 10.1029/2010JD015303. |
| Xu G, 1997. Global climate warm up bring what on Sinkiang economic construction and sustainable development? Xinjiang Weather, 20: 1-3. |
| Xu YL, Huang XY, Zhang Y, et al., 2007. Validating PRECIS's capacity of simulating present climate over South China. ACTA Scientiarum Naturalium Universitatis Sunyatseni, 46(5): 93-97. |
| Xu YL, Jones R, 2004. Validating PRECIS with ECMWF reanalysis data over China. Chinese Journal of Agrometeorology, 25(1): 5-9. |
| Yang LM, 2003. Cliamte change of extreme precipitation in Xinjiang, China. Acta Geographica Sinica, 58(4): 577-583. |
| Zhang MJ, He JY, Wang BL, et al., 2013. Extreme drought changes in southwest China from 1960-2009. Journal of Geographical Sciences, 23(1): 3-16. DOI: 10.1007/s11442-013-0989-7. |
| Zhang Q, Chong XY, Zhang ZX, et al., 2008. Spatial and temporal variability of precipitation maxima during 1960-2005 in the Yangtze River basin and possible association with large-scale circulation. Journal of Hydrology, 353: 215-227. DOI: 10.1016/j.jhydrol.2007.11.023. |
| Zhang X, Yang F, 2004. RClimDex (1.0) User Manual. Available at: http://cccma.seos.uvic.ca/ETCCDMI/software.shtml. |
| Zhang XB, Zwiers FW, Hegerl G, 2009. The influences of data precision on the calculation of temperature percentile indices. International Journal of Climatology, 29(3): 321-327. DOI: 10.1002/joc.1738. |
| Zhang Y, Xu Y, Dong W, et al., 2006. Change of extreme precipitation events in China in future: an analysis based on prediction of climate change. Journal of Natural Disasters, 15(6): 228-234. |
 2015, 7


