Article Information
- Gideon O. Okunlola, Olusanya A. Olatunji, Akinjide M. Afolabi, Kolade K. Gbadegesin. 2015.
- Effects of nitrogen nutritional stress on the morphological and yield parameters of tomato (Solanum lycopersicum L.)
- Sciences in Cold and Arid Regions, 7(2): 137-145
- http://dx.doi.org/10.3724/SP.J.1226.2015.00137
Article History
- Received: July 14, 2014
- Accepted: November 17, 2014
Plant stress is generally defined as any external factor that exerts a negative impact upon a plant(Taiz and Zeiger, 1998). Stress is a state in which its increasing effect produces an initial destabilization of functions, followed by normalization and improved resistance, i.e., stress is both destructive and constructive and as well as a driving force for improved resistance and adaptive evolution(Larcher, 1980). It has been known for many years that an excess of certain mineral elements have a strong effect on transpiration, stomata conductance and root hydraulic conductivity of a plant. When these mineral elements, in form of ions, are deficient in the growth medium, nitrates, phosphates and sulphates are transported, metabolized and utilized in different ways, producing similar effects on stomata conductance and root hydraulic conductivity. However, every plant has encoded within its genome a toleration to stress(Bohnert et al.,1995), and the acclimation capacity depends on external conditions. A plant with a lower acclimation capacity has a lower resistance to a given stress while higher acclimation capacity has a greater resistance to a given stress. Plant resistivity results in rapid phenological development, increased stomata and cuticular resistance, changes in leaf area, orientation and anatomy(Morgan, 1984 ; Jones and Corlett, 1992).
Solanum lycopersicon(Solanaceae, night shade family)is globally cultivated for its fleshy fruits and known as a protective food because of special nutritive value and widespread production(Taylor, 1986). The fruit is eaten directly as a raw vegetable or consumed in a variety of processed products such as ketchup, sauce, chutney, juice, diced, soup, paste, and puree. It is a rich source of vitamin A and C and also contains minerals such as iron and phosphorus(Kalloo, 1991). Furthermore, it is the richest source of nutrients, dietary fibers, and antioxidants such as lycopene and beta-carotene, compounds that protect cells from cancer(Hobson and Grierson, 1993). Numerous studies have been conducted on the response of tomatoes to nitrogen rich fertilizers. It was observed that tomatoes are susceptible to the supply of ammonium as a sole or dominating nitrogen form(Kirkby and Knight, 1977 ; Ganmoreneumann and Kafkafi, 1980 ; Pill and Lambeth, 1980 ; Magalhães and Wilcox, 1983 ; Errebhi and Wilcox, 1990 ; Imas et al.,1997). Nitrogen influences plant metabolism due to differences in the intracellular assimilation pathways(Raab and Terry, 1994 ; Gerendás et al.,1997) and according to Claussen(2002) , the use of ammonium as sole or dominating nitrogen source in a solution culture of tomato always resulted in impaired growth and yield restrictions. Siddiqi et al.(2002) and Akl et al.(2003)observed a restriction of both vegetative growth and fruit yield of tomatoes when ammonium in the nutrient solution was high while Claussen(2002) and Dong et al.(2004)observed an increase in both total and fruit dry weight when the ammonium fraction was high. However, it is important to underst and the response of S. lycopersicon to different levels of nit rogen stress. Therefore, the objective of this research is to determine the effect of different levels of nitrogen stress on morphological and yield parameters of S. lycopersicon. 2 Materials and methods
Soil samples were collected from Obafemi Awolowo University Ile-Ife, Osun State, Nigeria, and thoroughly mixed to obtain homogeneity. The soil was then transferred into 32 plastic pots containing bored holes at the bottom to allow for drainage of excess water during the course of the experiment. The pots were divided into four groups of eight pots each. The complete nutrient solution was prepared based on Long Ashton formula, as modified by Hewit(1954). The first group(n)is the control experiment(i.e., supplied with distilled water only). The second group(N)was supplied with 200 mL of complete nutrient solution once a day. The third group(N5)was supplied with a concentration of nitrogen sources(i.e., KNO3 and NH4NO3)multiplied by a factor of 5. The fourth group(N10)was supplied with a concentration of nitrogen sources(i.e., KNO3 and NH4NO3)multiplied by a factor of 10. The pots were then placed inside a screen house to prevent extraneous materials from interfering with the experiment. The average light intensity in the screen house was measured with a digital lux meter TCX100 and was found to be 48, 800 Lux throughout the duration of the experiment. S. lycopersicon seeds were planted in the pots, and emerged seedlings were watered twice daily with 100 mL of distilled water until they were fully established. The established seedlings were thinned to five plants per pot. The first group received 200 mL of distilled water twice daily. The second group received 200 mL of compl ete nutrient solution in the morning and 200 mL of distilled water in the evening. The third group received 200 mL of N5 in the morning and 200 mL of distilled water in the evening. The fourth group received 200 mL of N10 in the morning and 200 mL of distilled water in the evening. Sampling was carried out at weekly intervals starting from the first week after planting(i.e., seven days after treatment). Three replicates were r and omly picked from each of the four groups for each parameter. A Metric ruler was used to measure shoot height, leaf length and leaf width. Leaf area(LA)was calculated from the measured leaf length(L) and width(W)using the formula of Osei-Yeboah et al.(1983)as follows:
LA = L ∙ W ∙ 2.325
The number of leaves, plant fresh weight and dry weight were determined. The number of fruits per plant in each treatment, fruit fresh weight, fruit dry weight were determined on metler Toledo PB 153 digital balance, fruit length and fruit diameter were all recorded. One-way analysis of variance(ANOVA)was carried out to investigate the effect of nitrogen stress on morphological and yield parameters. Post hoc test was carried out using Bonferroni test to separate the significance means at 0.05 confidence level. 3 Result
There was a progressive increase from week one to week eight in shoot height of S. lycopersicon(tomato)grown in different nitrogen treatments(Figure 1). Shoot height in all treatments increased from the beginning of the experiment to the end. S. lycopersicon treated with high concentration of nitrogen(N10-plants)recorded a higher shoot height than the other treatments, followed by N5-, N-, and n- plants with the lowest shoot height. However, ANOVA results show that there was a significant effect of nitrogen treatments on the shoot height of tomato plants(p <0.05)(Table 1).
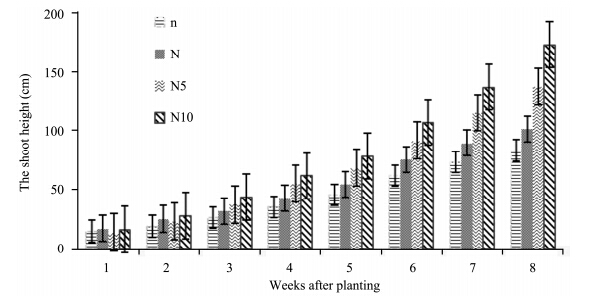 |
| Figure 1 Shoot height of S. lycopersicon grown under different nitrogen treatments |
| Treatment | Shoot height | No. of leaves | Leaf area | Plant dry weight | Plant fresh weight | No. of flowers | No. of fruits | Fruit length | Fruit diameter | Fruit fresh weight | Fruit dry weight |
| n | 45.12d | 65.63d | 48.39d | 1.98 | 23.95d | 2.88d | 0.75d | 2.25d | 2.80b | 9.46d | 0.83d |
| N | 54.91c | 81.13c | 60.01c | 2.21 | 27.96c | 4.63c | 1.38c | 3.15b | 2.71d | 11.48c | 1.05c |
| N5 | 67.91b | 103.75b | 81.90b | 3.16 | 41.50b | 9.63b | 3.88b | 4.01a | 3.30a | 20.90a | 1.48a |
| N10 | 80.88a | 127.75a | 87.70a | 3.46 | 46.36a | 13.00a | 5.38a | 2.78c | 2.78c | 14.81b | 1.18b |
| Superior characters of a, b, c, and d mean within the same column with different superscript are significantly(p ≤0.05)different. | |||||||||||
There was an incremental increase in the number of tomato seedling leaves grown under different nitrogen treatments from the beginning to the end of the experiment(Figure 2). N10- and N5-plants recorded a considerable increase from week 6 to 8. N10-plants had the highest while n-plants had the lowest rate of leaf formation. By the end of the experiment, N10-plants recorded the highest number of leaves, followed by N5- and N-plants while n-plants recorded the lowest number of leaves. ANOVA results show that nitrogen concentrations had a significant effect on the number of tomato leaves(p <0.05)(Table 1).
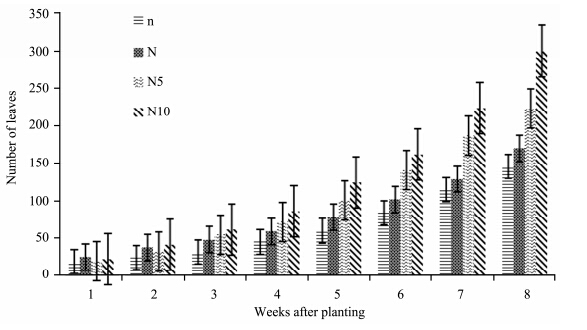 |
| Figure 2 Number of S. lycopersicon leaves grown under different nitrogen treatments |
S. lycopersicon treated with high concentration of nitrogen(N5- and N10-plants)show a great increment in leaf area(Figure 3). N10- and N5-plants recorded equal leaf area on the 4th week. The leaf area followed a decreasing order of N10 > N5 > N > n with highest leaf area recorded at high concentration of nitrogen(N10-plants). ANOVA results show that there was a significant effect of nitrogen treatments on the leaf area of tomato plants(p <0.05)(Table 1).
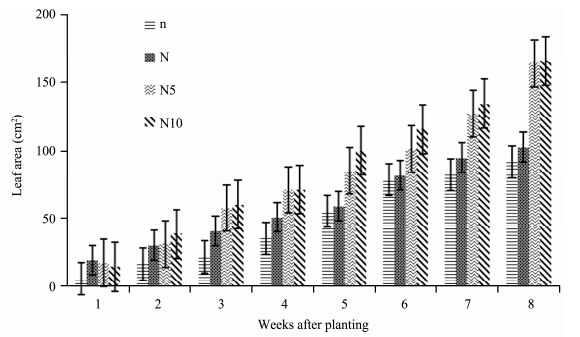 |
| Figure 3 The leaf area of S. lycopersicum grown under different nitrogen treatments |
Figure 4shows a gradual increase in biomass accumulation(fresh weight)of tomatoes under different nitrogen treatments from the beginning to the end of the experiment. Plants under high nitrogen stress recorded more biomass accumulation. N10- and N5-plants show a considerable increase from week 7 to 8. N10-plants recorded the highest biomass accumulation followed N5-, N- and n-plants which had the lowest biomass accumulation. However, there was no significant effect of nitrogen concentrations on plant fresh weight(p >0.05)(Table 1).
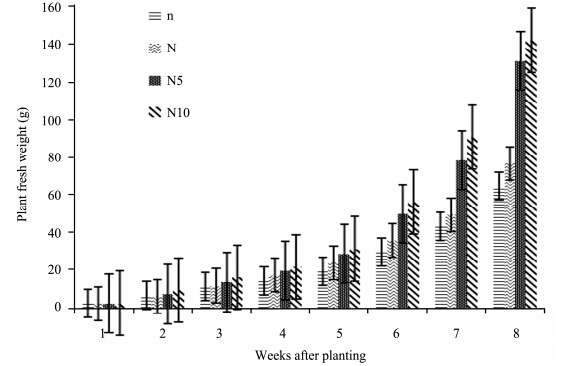 |
| Figure 4 Fresh weight of S. lycopersicon grown under different nitrogen treatments |
The result of biomass accumulation(dry weight)of tomatoes under different nitrogen treatments show that under high concentration of nitrogen treatments, N10-plants had more biomass than N5 plants(Figure 5). N10- and N-plants show a considerable increase from week 7 to 8. There was a fluctuation within the group in the 1st and 2nd week of the experiment but they maintained a gradual increase in biomass accumulation till the end of the experiment. At the end of the experiment, N10-plants recorded the highest biomass, followed by N5-, N- and n-plants. Nitrogen concentrations had no significant effect on biomass accumulation of S. lycopersicon(p >0.05)(Table 1).
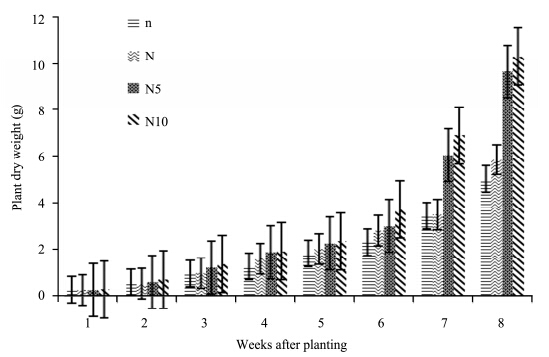 |
| Figure 5 Dry weight of S. lycopersicon grown under different nitrogen treatments |
No plants in each treatment produced flowers until the 5th week of the experiment. N10- and N5-plants produced flowers on the 5th week while N- and n-plants started producing flowers on the 7th week. There was a considerable increase in the number of flowers in all treatment from the 5th week to the end of the experiment. At the end of the experiment, N10-plants had the highest number of flowers, followed by N5-, N-, and n-plants which had the lowest number of flowers(Figure 6). Table 1 show that nitrogen concentrations had no significant effect on the number of S. lycopersicon flowers(p >0.05).
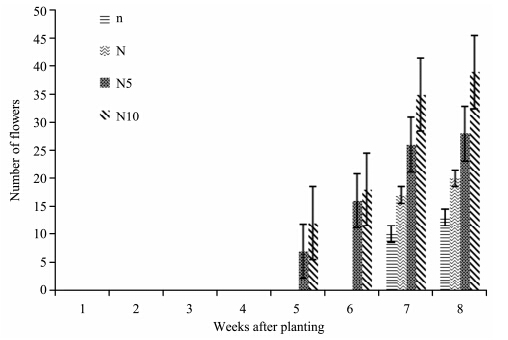 |
| Figure 6 Number of S. lycopersicon flowers grown under different nitrogen treatments |
No fruits were produced until the 6th week of the experiment. From the 6th to 8th week, the number of fruits increased in N10- and N5-plants. N- and n-plants produced fruits on the 8th week. At the end of the experiment, N10-plants recorded the highest number of fruits, followed by N5-, N-, and n-plants which had the lowest number of fruits(Figure 7). Table 1 show that nitrogen concentrations had a significant effect on the number of S. lycopersicon fruits(p >0.05).
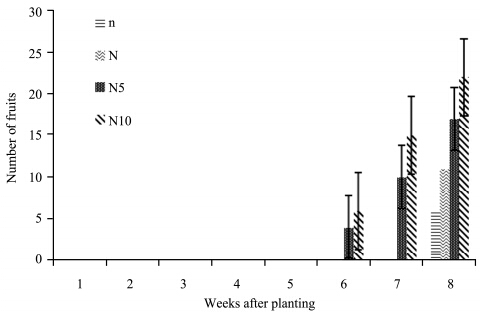 |
| Figure 7 Number of S. lycopersicon fruits grown under different nitrogen treatments |
S. lycopersicon fruits under high nitrogen concentration show a considerable increase in fruit length compared to the other concentrations(Figure 8, Plate 1). N5-plants had the highest fruit length, followed by N-, N10-, and n-plants which had the lowest fruit length. ANOVA results show that nitrogen concentrations had a significant effect on fruit length(p <0.05). N5- and n-plants were significantly different from N10- and N-plants.
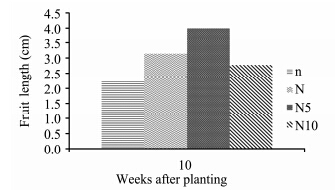 |
| Figure 8 S. lycopersicon fruit length grown under different nitrogen treatments |
Figure 9 and Plate 1 show the effects of nitrogen stress on tomato fruits grown under different nitrogen treatments. Fruits under a nitrogen concentration show an effect on fruit diameter. N5-plants had the highest fruit diameter, followed by N10-, n-, and N-plants which had the lowest fruit diameter. ANOVA results show that nitrogen concentrations had a significant effect on fruit diameter(p <0.05). N5-plants were significantly different from N10-, N- and n-plants.
 |
| Figure 9S. lycopersicon fruit diameter grown under different nitrogen treatments |
Solanum lycopersicon under the high nitrogen concentration showed a considerable increase in fruit fresh weight compared to other concentrations. N5-plants had the highest fruit fresh weight, followed by N10-, N-, and n-plants which had the lowest fruit weight(Figure 10). ANOVA results show that nitrogen concentrations had a significant effect on fruit fresh weight(p <0.05). Both N5- and N10-plants were significantly different from N- and n-plants. N5-plants had the highest fruit dry weight, followed by N10-, N-, and n-plants which had the lowest fruit dry weight(Figure 11). ANOVA results show that nitrogen concentrations had a significant effect on fruit dry weight(p <0.05). N5- and n-plants were significantly different from N10- and N-plants.
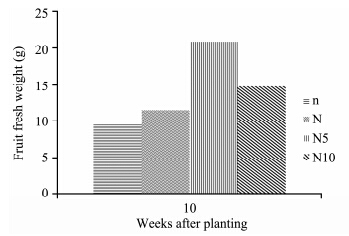 |
| Figure 10 Fruit fresh weight of S. lycopersicon grown under different nitrogen treatments |
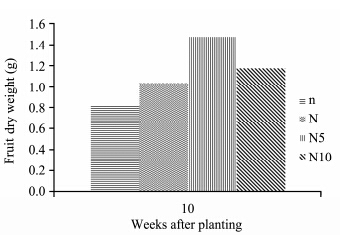 |
| Figure 11Fruit dry weight of S. lycopersicon grown under different nitrogen treatments |
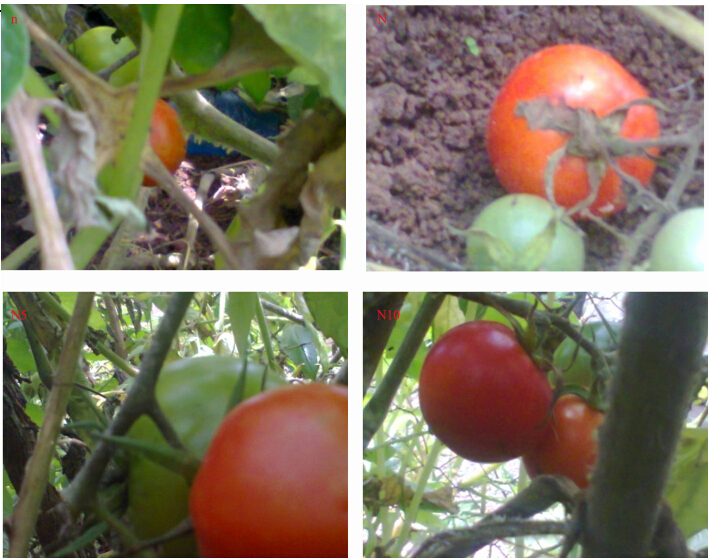 |
| Plate 1 Effect of different nitrogen concentrations on the length and shape of ripe tomato fruits. n: without nutrients, N: complete nutrients, N5: complete nutrients with 5% nitrogen concentration, N10: complete nutrient with 10% nitrogen concentration |
The observed higher plant height and leaf number(growth parameters)in N10- and N5-plants agree with the result of Marschner(1995) even up to the highest rate of nitrogen. The supply of nitrogen is related to carbohydrate utilization and when nitrogen supplies are adequate and conditions are favorable for growth, proteins are formed from the manufactured carbohydrates, less carbohydrate is thus deposited in the vegetative portion, more protoplasm is formed and because the protoplasm is highly hydrated, a more succulent plant results. The observed lower plant height and leaf number in N- and n-plants agree with the findings of Tisdale et al.(2003) who found that when nitrogen supplies are insufficient, carbohydrates are deposited in vegetative cells causing them to thicken. Therefore, increase in crop growth is in line with an increase in n nitrogen application.
The higher plant fresh weight with higher concentration of nitrogen was is in accordance with the result of Verma et al.(1996). This result may be related to nitrogen supply which is related to carbohydrate utilization enhancing protein synthesis. This allows the plants to grow faster, increasing the rate of metabolism, cell division, cell elongation and thereby stimulating apical growth as well as formation of leaves. This result may also be due to increased auxin activity, production of carbohydrates and other organic compounds which lead to accelerated meristematic activity at the shoot apex at high nitrogen levels(Kiruthikadevi, 2002).
The higher dry matter recorded in N10- and N5-plants agreed with the result of Langton et al.(2003)who found that dry matter increase is a result of increase in chlorophyll content. The observed lower dry matter in N- and n-plants is in accordance with the findings of Zhao et al.(2005)who reported that nitrogen deficiency suppressed total plant biomass production, and this deficiency is associated with reduction in both leaf area and leaf photosynthetic capacity. Hence, greater reduction in plant growth could be observed under nitrogen deficiency.
The highest number of flowers and early flowering observed in N10- and N5-plants was reported by Humphreys and Riveros(1986) who found that the role of nitrogen fertilizer in increasing tropical fruit yield may function in several ways such as increasing photosynthetic capacity, grown canopy, and by stimulating a higher proportion of flowering shoots. Bahnisch and Humphreys(1977) found that fertility of the main stem was positively related to additional nitrogen supply and high nitrogen increased tiller fertility and accelerated flowering. The observed higher yield in N10- and N-plants in this treatment was reported by Kulvinder and Srivastava(1988) where higher yield might be due to increased shoot and leaf growth at optimal levels of nitrogen. This might have helped in manufacturing greater amount of carbohydrates which are translocate to fruits resulting in a higher yield. Similar findings have been reported by Medhi et al.(1990) and Sharma(1995).
The highest leaf area recorded in N10-plants and lowest leaf area in n-plants was reported by Hassan and Khan(2007) where enhanced nitrogen rates significantly increased leaf area and maximum leaf area was observed in treatment of high nitrogen supplies. This influence of nitrogen could be due to the nature of this nutrient and its role in inducing growth vegetation. In terms of growth, ample nitrogen increases the number of cells per leaf and can increase cell size and as a result increases leaf area(Lawlor et al.,2001). Radin and Boyer(1982) found that leaves with low nitrogen had lower turgor and slower leaf enlargement than leaves with high nitrogen. The depressed turgor discouraged increases in cell size. 5 Conclusion
Most morphological parameter analyzed in this study show a positive response to higher nitrogen conditions. Also, the yield of S. lycopersicon was greatly enhanced under higher nitrogen conditions, because there was an increase in shoot height, total plant biomass, root biomass, leaf area, shoot biomass, the number of leaves and fruits produced. We therefore suggest a moderately higher nitrogen conditions to farmers who are interested in cultivating S. lycopersicon because they could flower early, produce increased number of fruits, larger fruits and good fruit settings.
| Akl IA, Savvas D, Papadantonakis N, et al., 2003. Influence of ammonium to total nitrogen supply ratio on growth, yield and fruit quality of tomato grown in a closed hydroponic system. European Journal of Horticultural Science, 68: 204–211. |
| Bahnisch LM, Humphreys LR, 1977. Nitrogen supply, tillering, and floral initiation of Setaria anceps cv. Narok. Journal of the Australian Institute of Agricultural Science, 43: 167–168. |
| Bohnert HJ, Nelson DE, Jensen RG, 1995. Adaptations to envi-ronmental stresses. The Plant Cell, 7(7): 1099–1111. |
| Claussen W, 2002. Growth, water use efficiency, and proline content of hydroponically grown tomato plants as affected by nitrogen source and nutrient concentration. Plant and Soil, 247: 199–209. |
| Dong CX, Shen QR, Wang G, 2004. Tomato growth and organic acid changes in response to partial replacement of NO3?–N by NH4+–N. Pedosphere, 14(2): 159–164. |
| Errebhi M, Wilcox GE, 1990. Tomato growth and nutrient uptake pattern as influenced by nitrogen form ratio. Journal of Plant Nutrition, 13: 1031–1034. |
| Ganmore-Neumann R, Kafkafi U, 1980. Root temperature and percentage NO3?NH4+ effect on tomato plant development. I. Morphology and growth. Agronomy Journal, 72: 758–761. |
| Gerendás J, Zhu Z, Bendixen R, et al., 1997. Physiological and biochemical processes related to ammonium toxicity in higher plants. Zeitschrift für Pflanzeneru?hrung und Bodenkunde, 160: 239–251. |
| Hassan G, Khan H, 2007. Effect of wild oat (Avena fatua L.) density on wheat (Triticum aestivum) and its components under varying nitrogen regimes. Pakistan. Journal of Botany, 39: 2585–2594. |
| Hobson G, Grierson D, 1993. Tomato. In: Seymour GB, Taylor JE, Tucker GA (eds.). Biochemistry of Fruit Ripening. New York: Chapman and Hall. |
| Humphreys LR, Riveros F, 1986. Tropical pasture seed production. Food and Agriculture Organization of the United Nations, Rome, pp. 203. |
| Imas P, Bar-Yosef B, Kafkafi U, et al., 1997. Release of carboxylic anions and protons by tomato roots in response to ammonium nitrate ratio and pH in nutrient solution. Plant and Soil, 191: 27–34. |
| Jones HG, Corlett JE, 1992. Current topics in drought physiology. Journal of Agricultural Science, 119(3): 291–296. |
| Kalloo, 1991. Review of literature on tomato. University of Hyderaba, 56: 1–48. |
| Kirkby EA, Knight AH, 1977. Influence of the level of nitrate nutrition on ion uptake and assimilation, organic acid accumulation, and cation-anion balance in whole tomato plants. Plant Physiology, 60: 349–353. |
| Kiruthikadevi V, 2002. Nutritional studies on root yield and quality of ashwagandha (Withania somnifera Dunal). M.Sc. Thesis, Horticultural College and Research Institute, Periyakulam, Tamil Nadu Agricultural University. |
| Kulvinder S, Srivastava BK, 1988. Effect of various levels of nitrogen and phosphorus on growth and yield of chilli. Indian Journal of Horticulture, 45(3–4): 319–324. |
| Langton FA, Adams SR, Cockshull KE, 2003. Effects of photoperiod on leaf greenness of four bedding plant species. Journal of Horticultural Science and Biotechology, 78(3): 400–404. |
| Larcher W, 1980. Physiological Plant Ecology. Springer-Verlag, New York. |
| Lawlor D, Lemaire G, Fastal F, 2001. Plant growth and crop yield. In: Lea PJ, Morot-Gaudry JF (eds.). Plant Nitrogen. New York: Springer-Verlag Berlin Heidelberg, pp. 343–368. |
| Magalh?es JR, Wilcox GE, 1983. Tomato growth and mineral composition as influenced by nitrogen form and light intensity. Journal of Plant Nutrition, 6: 847–862. |
| Marschner H, 1995. Mineral Nutrition of Higher Plants (2nd Ed.). Academic Press Ltd. London, U.K., pp. 229–312. |
| Medhi RP, Singh B, Parthasarathy VS, 1990. Effect of N, P and K on chillies. Progressive Horticulture, 22(1–4): 173–175. |
| Morgan JM, 1984. Osmoregulation and water stress in higher plants. Annual Review Plant Physiology, 35: 299–319. |
| Osei-Yeboah S, Lindsay JI, Gumb SFA, 1983. Estimating leaf area of cowpea (Vigna ungiculata (L.) Walp) from linear measurement of terminal leaflets. Tropical Agriculture, 60(2): 149–150. |
| Pill WG, Lambeth VN, 1980. Effects of soil water regime and nitrogen form on blossom-end rot, yield, water relations, and elemental composition of tomato. Journal of the American So-ciety for Horticultural Science, 105: 730–734. |
| Raab TK, Terry N, 1994. Nitrogen-source regulation of growth and photosynthesis in Beta vulgaris L.. Plant Physiology, 105: 1159–1166. |
| Radin JW, Boyer JS, 1982. Control of leaf expansion by nitrogen nutrition in sunflower plants. Plant Physiology, 69: 771–775. |
| Sharm SK, 1995. Response of nitrogen and phosphorus on plant growth and fruit yield in hybrid sweet pepper cultivar Pusa Deepti. Vegetable Science, 22(1): 19–21. |
| Siddiqi MY, Malhotra B, Min X, et al., 2002. Effects of ammonium and inorganic carbon enrichment on growth and yield of a hydroponic tomato crop. Journal of Plant Nutrition and Soil Science, 165: 191–197. |
| Taiz L, Zeiger E, 1998. Plant Physiology (3rd edition). Sinauer Associates. Sunderland, Massachustt, USA. |
| Taylor IB, 1986. Biosystematic of the tomato. In: Atherton IG, Rudich I (eds.). The Tomato Crop: A Scientific Basis for Im-provement, Chapman and Hall, London, pp. 1–34. |
| Tisdale SL, Nelson WL, Beaton JD, et al., 2003. Soil Fertility and Fertilizers. 5th edition. Prentice-Hall of India. Prt Ltd., New Delhi. |
| Verma RB, Singh PK, Singh SB, 1996. Effect of nitrogen and potassium levels on growth, yield and nutrient uptake of Colocasia. Journal of Root Crops, 22(2): 139–143. |
| Zhao D, Reddy KR, Kakani VG, et al., 2005. Nitrogen deficiency effects on plant growth, leaf photosynthesis, and hyperspectral reflectance properties of sorghum. European Journal of Agronomy, 22: 391–403. |
 2015, 7


