Estimate the influence of snow grain size and black carbon on albedo
1 Introduction
IPCC,2007
Glacier and snowpack changes are key indicators of climatic changes as they show an enhanced and well recognizable reaction to even small climatic fluctuations, which results from their proximity to melting conditions(IPCC, 2007). Also, glaciers and snowpacks stored roughly 2.4×10⁸ km3 water(Oki and Kanae, 2006), thereby variation of these can affect available water resources in many regions of the world(e.g., Mote, 2003; Yao et al.,2004). Snow albedo is a critical player in the growth and ablation of glacier snowpack; a higher albedo implies less available energy for melting or sublimating snow(Yasunari et al.,2011). Influence factors, which determine snow albedo, including snow grain size, black carbon, snow depth, snow density, liquid water content, dust content and solar zenith angle(e.g., Warren and Wiscombe, 1980; Wiscombe and Warren, 1980; Bai and Tetsuo, 1989; Grenfell et al., 1994; Aoki et al., 2000 , 2006; Motoyoshi et al.,2005; Jiang, 2006; Flanner et al.,2007; Aoki and Tanaka, 2008;Tanikawa et al.,2009; Hadley and Kirchstetter, 2012).
Snow grain size growth(also called "Snow aging"), which was accelerated by warmer snow temperatures, can darken the snow itself and causes reflectance to vary significantly on timescales of days. This variability influences the strength of snow albedo feedback and can affect the timing of snowmelt(Flanner and Zender, 2006). Previous studies account for the role of grain growth on albedo evolution only with empirical representations(e.g., Verseghy, 1991; Marshall and Oglesby, 1994; Douville et al.,1995; Loth and Graf, 1998). Nowadays, several models and new technology are employed to evaluate the relationship between snow grain size and albedo. Simulated results by Green et al.(2002) indicated that spectral reflectance was stronger dependent to the size of snow particle in the region of 800-1, 400 nm. However, the increased particle size have an limited effect on the snow surface albedo effect is not unlimited, Bergen(1975) suggested that for grain sizes larger than 1.5 mm, density is the primary factor governing albedo. In general, snow grain size ranges from 20 to 1, 500 µm. An examination of a wide variety of references(e.g., Nakaya, 1954; Liljequist, 1956; Arai, 1966; Gow, 1969; LaChapelle, 1969; Hobbs, 1974; Colbeck, 1975;Mellor, 1977)suggests average grain radii in the range of 20-100 µm for new snow, 100-300 mm for fine-grained older snow, and 1.0-1.5 mm for old snow near the melting point. The albedo of new snow is at its maximum. Markvart and Castaner(2003) showed that fresh snow can reflect up to 90% of incoming radiation while underlying soil and grass have albedos of only 20%-30%, and compared with fresh snow, old or dirty snow experiences a drastic reduction in albedo, as values can be reduced to as low as 45%. Flanner and Zender(2006) observed an albedo decrease of up to 13% in the two weeks following a fresh snowfall.
Snow albedo can also be strongly affected by the black carbon(Warren and Wiscombe, 1980). Industrial and biomass burning emissions of black carbon from low- and mid-latitudes dominate the radiative forcing by absorbing impurities trapped in snow and ice at mid- and high-northern latitudes(Zender et al.,2009). The deposition of soot particles on snow can reduce snow albedo and affect snowmelt(Warren and Wiscombe, 1980 , 1985; Hansen and Nazarenko, 2004; Jacobson, 2004; Flanner et al.,2007), leading to climate change on global and regional scales. Black carbon aerosol has gradually attracted the attention of experts ever since the London smog events during the 1950s. Research on black carbon in snow started during the 1980s, and Wiscombe and Warren(1980) found that a concentration of 15 μg/kg of black carbon in snow may reduce snow albedo by about 1%. And then the effects of black carbon in snow have been widely researched(e.g., Clarkelek and Ramaswamy, 1983; Warren, 1984; Clarke and Noone, 1985; Warren and Wiscombe, 1985; Warren and Clarke, 1990; Hansen and Nazarenko, 2004;Flanner et al.,2007; Doherty et al., 2010; Reay et al., 2012). Hansen and Nazarenko(2004) estimated the effect of soot on snow and ice albedos(1.5% in the Arctic and 3% in Northern Hemisphere l and areas)that would yield a climate forcing of +0.3 W/m2in the Northern Hemisphere. Jacobson(2004) suggested that 25 ng/g of black carbon can reduce surface albedo of sea ice at a wavelength of 550 nm to 97.9% of the original value. Qian et al.(2009) found that the soot-induced snow albedo perturbations increase the surface net solar radiation flux during late winter to early spring, increase the surface air temperature, and reduce the snow accumulation and spring snowmelt in Western United States. The rough estimation made by Ming et al.(2009) for the reduced albedos in certain glaciers in western China suggested that black carbon deposited on the surface may accelerate the melting of these glaciers, and that the reduced albedo of certain glaciers that were severely contaminated by black carbon on their surfaces exceeded 5% due to the black carbon deposits.
Several studies have focused mainly on using the relationship between snow grain size and albedo to retrieve the snow grain size(e.g., Dozier and Marks, 1987; Hyvärinen, 1987; Nolin and Dozier, 1993 , 2000; Jin et al.,2008; Lyapustin et al.,2009), moreover, quantitative estimation the effect of snow grain size on albedo mainly simulated using model and was relatively less. In this paper, field measurement data, including snow grain size, density and snow depth was obtained. Black carbon sample was collected from the snow surface. A simultaneous observation using Analytical Spectral Devices was employed in the Qiyi Glacier located in the Qilian Mountain. Analytical Spectral Devices spectrum data were used to analyze spectral reflectance of snow for different grain size and black carbon content. The measurements were compared with the results obtained from the Snow, Ice, and Aerosol Radiation model, and the other factors were assumed to be constant using the corrected SNICAR model to estimate the influence of measured snow grain size and black carbon on albedo. Field measurements were controlled to fit the relationship between the snow grain size and black carbon in order to estimate the influence of these factors on the snow albedo.
2 Study area
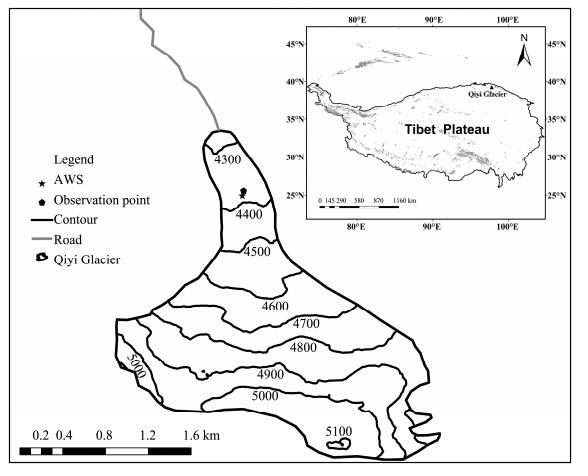
The Qiyi Glacier(39°14.22′N, 97°45.34′E, numbered 5Y437C18)is located in the Qilian Mountains in the north edge of the Tibet Plateau(Figure 1). Its melt water feeds into the tributary of the Beida River(Pu et al.,2005). The glacier was the first to be subject to modern Chinese glaciological studies in 1958(Snow and Ice Research Team of Chinese Academy of Sciences 1958), and its name, Qiyi Glacier(July 1st Glacier), commemorates Chinese glaciologists climbing on it on July 1st of that year. Based on digital stereophotogrammetry, the Qiyi Glacier was 2.817 km2 and 3.8 km long in 1975, its terminus altitude was 4, 304 m a.s.l., its summit altitude was 5, 158.8 m a.s.l.. The Qiyi Glacier belongs to a cirque-valley glacier based on its morphology, and is categorized as sub-continental glacier according to its physical properties.
Observation and sampling were performed at a single-point(39°14.921′N, 97°45.215′E, 4, 401 m in height)on the surface of the Qiyi Glacier during September 7 to 15, 2011. The relatively flat and wide observation point was located near the Automatic Weather Station(AWS), hence, the temperature data can be used to estimate the influence of temperature on the snow grain size.
3 Method and data
The snow grain size, snow samples(for analyzing black carbon and dust content)on the snow surface, snow spectrum, snow depth and snow density were measured or collected from 11:00 to 18:00 during September 7 to 15, 2011. Before we started work, it is worth nothing that there is a new snow event in the Qiyi Glacier. The spectral reflectance will greater than 1 when the amount of cloud cover is large, and to avoid the influence of solar zenith angle on albedo, the data on the condition of noon(11:00-14:00) and cloudless were used to estimate the snow grain size and black carbon on albedo.
3.1 Measuring the snow grain size
The snow grain sizes were measured using a h and held lens with calibration on the surface of the snow(0.5 cm)from 11:00 to 18:00 during September 7 to 15, 2011. The accurate calculation of the single scattering properties of a snow grain can be a challenge because of the complexity of each particle shape. However, Mugnai and Wiscombe(1987) demonstrated that a collection of unoriented non-spheroids produce the same scattering results as spheres, and Grenfell and Warren(1999) showed that the radius of a non-spherical particle was equal to that of a spherical particle that has the same volume-to-surface-area(V/A)ratio. Consequently, V/A ratio was used to transfer the measured snow grain size into the optical grain size. On this basis of field measurement, Hao(2009) proposed two assumptions: 1)The snow particle is an inequilateral spheroid; and 2)The major axis, minor axis, and height of the inequilateral spheroid is denoted by a, b, and c, respectively, in such a way that the relationship a = 2b = 3c exists. Then the optical grain size can be calculated using the following equation(Hao, 2009):
$R \approx 0.48\alpha $
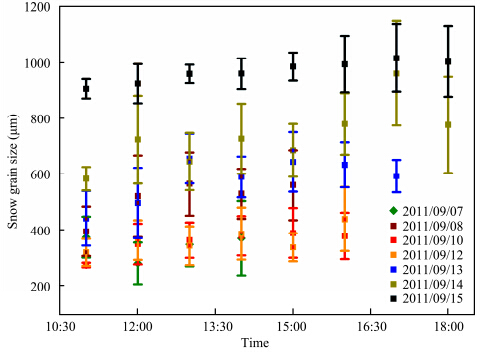
Equation (1) was employed to calculate the optical snow grain size during September 7 to 15, 2011. To avoid r and om error and to evaluate the accuracy of the data, the mean snow grain and its st and ard deviation was calculated at 1-hour interval(Figure 2).
3.2 Analyzing the black carbon content
Black carbon content is not detected visually and directly. Analyzing the black carbon content include 3 steps:(1)Collecting the snow sample: The snow samples for measurement of black carbon were collected from the surface layer and kept frozen until analysis, and approximately 100-200 g of snow sample in common because black carbon in the snow manifested a ng/g magnitude order(Hansen and Nazarenko, 2004).(2)Filtering the snow sample: Firstly, the samples were melted in a class 100 cleanroom, and were shaken about 10-15 minutes in order to reduce the residual sample in the sample bottle/bag using an ultrasonic wave concussion container. Secondly, weighed and filtered the sample a stainless steel unit(volume 400 mL)(Xu et al.,2006), which can prevent the inner surface of the container from absorbing the particles in the sample. Detailed operation steps were presented by Xu et al.(2009) . The filter efficiency of this method is approximately 95%(Chýlek et al.,1987; Cachier and Pertuisot, 1994; Lavanchy et al.,1999a). Then dried the quartz fiber filters(a circle with diameter of 1.0 cm)in the class 100 of clean table. Carbonates were removed prior to analysis by dripping 50 mL of 0.1 M HCl into the sample spot three times to avoid possible positive black carbon artifacts(Lavanchy et al.,1999b).(3)Testing the black carbon content: Analyzing the black carbon content in the filter using a Desert Research Institute Model 2001 Thermal/Optical Carbon Analyzer(Atmoslytic Inc., Calabasas, California). The reliability of this analysis system was verified through the comparative study of the carbonaceous aerosol test method(Schmid et al.,2001). The measure theory and procedure of analysis of black carbon were provided by previous literature(Cao et al.,2003; Chow et al.,2004; Ming et al.,2005; Wang et al.,2010).
Surface snow samples were collected using a shovel at the fixed point at 1-hour intervals from 11:00-18:00 during September 7 to 15 in 2011.
3.3 Observing the spectral reflectance
Spectrum data were observed using the Analytical Spectral Devices(ASD)Spectroradiometers FieldSpec Pro(America). FieldSpec Spectroradiometer is a general-purpose spectrometer useful in for several applications in areas requiring the measurement of reflectance, transmittance, radiance, or irradiance.Spectrum of point observation was implemented at 11:00-18:00 during September 7 to 15, 2011. The spectrograph sensor probe was positioned perpendicular to snow surface at a distance 0.3 m from the snow surface, and at least three spectrums were collected at every point, which were then used to calculate the mean value at each point. Then, the surface features reflectance is calculated using the ratio between the surface features spectrum and the reference white board:
| ${R_s}(\lambda) = \frac{{{D_s}(\lambda) \cdot {R_w}(\lambda)}}{{{D_w}(\lambda)}}$ |
(1)
|
where Rs(λ) and Rw(λ)is the reflectance of the surface features and the reference white board, respectively; Ds(λ) and Dw(λ)is the radiance of the surface features and the reference white board, respectively; and λ is the central wavelength of the spectrum sample site.
3.4 Other data
Snow density was measured using the snow fork(radio wave sensor)developed by the Helsinki University of Technology(Finl and). The snow fork is based on the measurement of the dielectric properties(real and imaginary part)of snow around 1 GHz(Tiuri and Sihvola, 1986), and is explicitly designed for field use. It is designed to operate under extreme conditions, ranging from rainy weather to as low as 40 °C below zero. The snow depth was measured near the observation point by digging a snow pit using ruler. Snow density and depth were collected near the fixed point at 1-hour intervals from 11:00-14:00 during September 7 to 15 in 2011.
3.5 Converting the narrowb and to broadb and albedo
The reflectance of surface features corresponding to every wavelength can be calculated using Equation (2). To acquire the accuracy of ASD data and convert ASD spectrum reflectance of wavelength into reflectance of b and , we used the response function of the L and sat data, the formula for which is as follows:
| ${A_s} = \frac{{\sum {\left( {{R_s}\left( \lambda \right) \cdot f\left( \lambda \right)} \right)} }}{{\sum {f\left( \lambda \right)} }}$ |
(2)
|
In order to compare the ASD albedo to L and sat albedo, the narrowb and albedo must be converted to broadb and albedo because the L and sat data was collected from the discontinuous narrow b and . Greuell et al.(2002) used the data sets from Icel and and Greenl and , as well as the data sets with ground-based albedo measurements, to set up equations for narrowb and to broadb and conversion for glacier ice and snow. The equations have a residual st and ard deviation of 0.011 for TM and can be applied without the need to classify the surface. The equation is given as follows:
| $\alpha {\rm{ = }}0.539 \cdot {\rho _2}{\rm{ + }}0.166 \cdot {\rho _4} \cdot \left( {1{\rm{ + }}{\rho _4}} \right)$ |
(3)
|
where αis the broadb and albedo, and ρ2 and ρ4 is the albedo of the L and sat TM b and 2 and b and 4, respectively. The method of converting the measured reflectance to broadb and albedo was verified by Huo et al.(2010) and Wu et al.(2013) .
Before narrowb and to broadb and albedo conversion, the L and sat TM/ETM+ image should be preprocessed:(1)radiometric calibration, which is the conversion of the digital numbers of 8-bit satellite images digital numbers(DN)to the top of atmosphere reflectance or at-sensor spectral radiance;(2)atmospheric correction through FLAASH(Fast Line-of-sight Atmospheric Analysis of Spectral Hypercubes), which provides an accurate, physics-based derivation of apparent surface reflectance through the derivation of atmospheric properties.
4 Results and discussion
4.1 Measured spectral reflectance using ASD
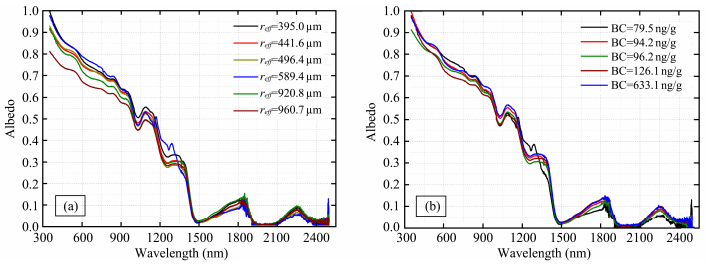
The spectral reflection characteristics of snow are analyzed using the spectrum curves of the different snow grain size and the black carbon content of snow(Figure 3). Figure 3 showed that snow spectral curves are changed with different snow grain size and black carbon content. In general, snow albedo reduced with the increase of the snow grain size and black carbon content. Snow reflectance is high in the visible b and , in general, the value is in the region of 0.60-0.99, reflectance decreased sharply in the near-infrared region. The b and s near 1, 030 nm, 1, 250 nm, 1, 470 nm and 2, 000 nm are four obvious spectral absorption peaks of snow. But the reflectance was almost zero in the b and near 1, 470 nm and 2, 000 nm, and difference of the spectrum curve of different snow type was small.
The substantial downward trend of the reflectance with the increase of the black carbon content shows that black carbon is the primary factor affecting the reflectance of the visible region. However, it has little impact near the infrared spectral region(Figure 3b). Moreover, albedo does not simply decrease with the increase of black carbon content because albedo is not only controlled by a single factor, but also is influenced by several factors.
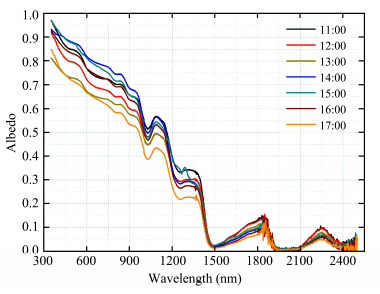
Figure 4 shows the spectrum at 11:00-17:00 on September 15, 2011. The influence factors can be observed to affect primarily the visible region. The reflectance of snow is very high in the visible region, approximately 0.61µm to 0.97 µm, whereas a major decrease is exhibited in the range of 750nm to 2, 500 nm in the near-infrared b and . Particularly near the 1, 350 nm, the reflectance displayed a nearly linear descending trend. In general, the spectral reflectance of the snow initially increased, then decreased. The maximum of the reflectance is 0.93-0.97 at 14:00 and 15:00, whereas the spectral reflectance is minimal at 17:00. The peak value is 0.85, which is mainly attributed to the effect of the solar altitude angle on the reflectance of the snow surface, that is, the reduction of the reflectance of snow is caused by an increase in the solar altitude angle.
4.2 Estimate the influence of black carbon and snow grain size on albedo using SNICAR model
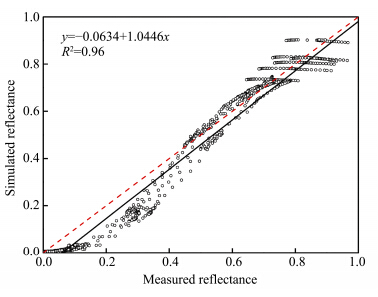
Snowpack reflectance was predicted using the two-stream, multi-layer Snow, Ice, and Aerosol Radiation model(SNICAR)(Flanner and Zender, 2005)based on Wiscombe and Warren(1980) and Toon et al.(1989), which treats snow as a collection of ice spheres. It obtains Mie parameters(single scattering albedo, extinction coefficient, and asymmetry parameter)for any lognormal size distribution from a lookup table computed offline. The model depends on vertically resolved effective radius(reff), solar zenith angle, snow depth and density, direct and diffuse incident radiation, bare surface reflectance, and concentrations of absorbing impurities. Figure 5 shows the relationship between the simulated spectral reflectance by a SNICAR model and the measured spectral reflectance at 11:00-17:00 on September 15, 2011, which proved a significant correction between the two values(R2 = 0.98, P <0.01). As the reflectance of snow is higher in the visible b and and mostly distributed in the range of 0.7-1.0 µm, this phenomenon can be shown as a circle partially overlapping a parallel distribution on a graph. The simulated reflectance is lower than the measured reflectance in some near-infrared range, whereas the former is generally greater than the latter in the visible range. Therefore, the SNICAR model needs a correction factor of 0.98.
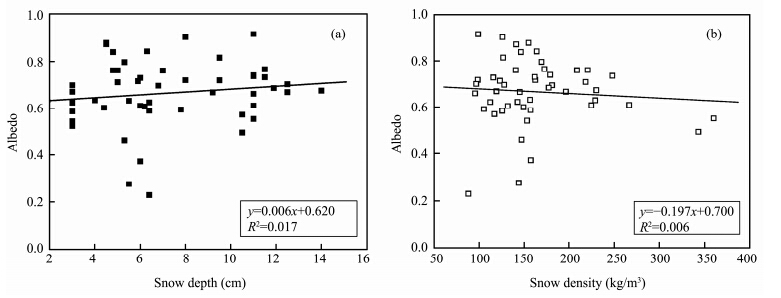
The influence factors on albedo includes snow depth, density, liquid water content, dust content and solar zenith angle except snow grain size and black carbon. Because this experimentally simultaneously observed snow depth and density data, and we estimated the influence of snow depth and density on albedo, respectively, using linear fit the relationship between snow depth, density and albedo. Albedo increased(decreased)with snow depth(density)increased. Figure 6 showed that the variation of snow depth may result in a 1.7% change in albedo, while the change of snow depth may cause a 0.6% variation in albedo. The influence of snow depth and density on albedo was relatively small, compared to snow grain size and black carbon. Consequently, the average value of measured snow depth and density was input when we estimated the influence of snow grain size and black carbon on albedo using SNICAR model.
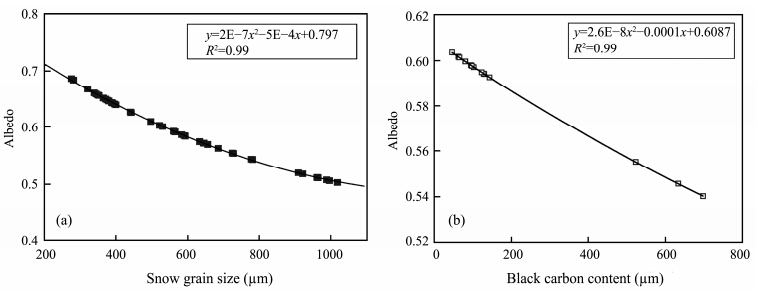
Consequently, the effect of snow grain size on snow albedo was estimated using the SNICAR model by inputting the measured snow grain size data collected during September 7 to 15. The range of snow grain size was 280-1, 018 mm during the observation period. In addition, the average value of snow depth, density, and black carbon content were used as input parameters as well. Therefore, the influence of snow grain size on albedo, at noon and in a cloudless sky, when the black carbon content BC=125.15 ng/g, was obtained(Figure 7). Figure 7a showed that albedo is reduced significantly with the increase in snow grain size. In particular, the albedo dramatically declined when snow grain size increased from 280 µm to 800 µm. However, the variation of albedo became relatively flat when the snow grain size exceeded 800 when the snow grain size wasm. When the snow grain size was 280 mm, and the corresponding albedo was 0.68, and albedo was 0.50 when the snow grain size was 1, 018 µm, so the variation of snow grain size was 738 µm, and this change may reduce albedo by 18%. Based on fitted curve we can conclude that an increase in snow grain size by 100 µm can lead to a decrease in albedo by ≤4.4%.
In the same way, the influence of black carbon on snow albedo can be discussed using the SNICAR model by inputting the measured black carbon data collected during September 7 to 15. The range of black carbon was 34-698 ng/g during the observation period. Therefore, at noon and in a cloudless sky, when the snow grain size reff =500 µm(Using the average snow grain size because the snow grain size mainly distributed in the range of 300-700 µm), the influence of black carbon content on albedo was got(Figure 7b). Other parameters should keep consistent with the previous. The variation of snow albedo with black carbon content was particularly remarkable, and albedo declined sharply with the increase of black carbon content. It is mainly because black carbon increase significantly on September 15. The black carbon content was concentrated distributed in the range of 30-200 ng/g. Since there was a new snowfall event during September 6 and 9, then black carbon content was enriched with the snow cover ablation. When the black carbon content was 34 ng/g and 698 ng/g, then the corresponding snow albedo was 0.6 and 0.54, respectively. Therefore, the variation of black carbon content was 664 ng/g, and may reduce albedo by 6%. Based on linear fitted w e can conclude that an increase in black carbon content by 100 ng/g can lead to a decrease in albedo by 1%.
5 Conclusions
Snow grain size and black carbon are the major influence factor on albedo. Quantitative estimation these influence factors mainly depend on various models or controlled experiment in laboratory or field. We have employed measured data and SNICAR model to estimate the influence of snow grain size and black carbon on albedo.
Conclusions are drawn as follows:
1)The influence of snow grain size on albedo greater than black carbon on albedo as well as simulated results using SNICAR model and measured results.
2)SNICAR model was verified using the measured data. The simulation was found to correlate well with the observed data, and the model does not consider the impact of the liquid water content.
3)Albedo is reduced significantly with the increase in snow grain size. In particular, the albedo dramatically declined when snow grain size increased from 280 µm to 800 µm. However, the variation of albedo became relatively flat when the snow grain size exceeded 800 µm.
4)Due to the cloud appeared, continuity of Spectral reflectance data was destroyed, and L and sat image data which used to compare with measured reflectance was unavailable.
5)Snow albedo was affected by many influence factors, and the field observations are often complicated and variable, to simplify we consider only the snow particle size and the influence of black carbon.
Acknowledgments:
Funding for this research was supported by "Strategic Priority Research Program(B)" of the Chinese Academy of Sciences(Grant No. XDB03030204), SKLCS(No. SKLCS-OP-2014-03) and Major Research of National Natural Science Foundation of China(Grant No. 41190084).
 2015, 7


